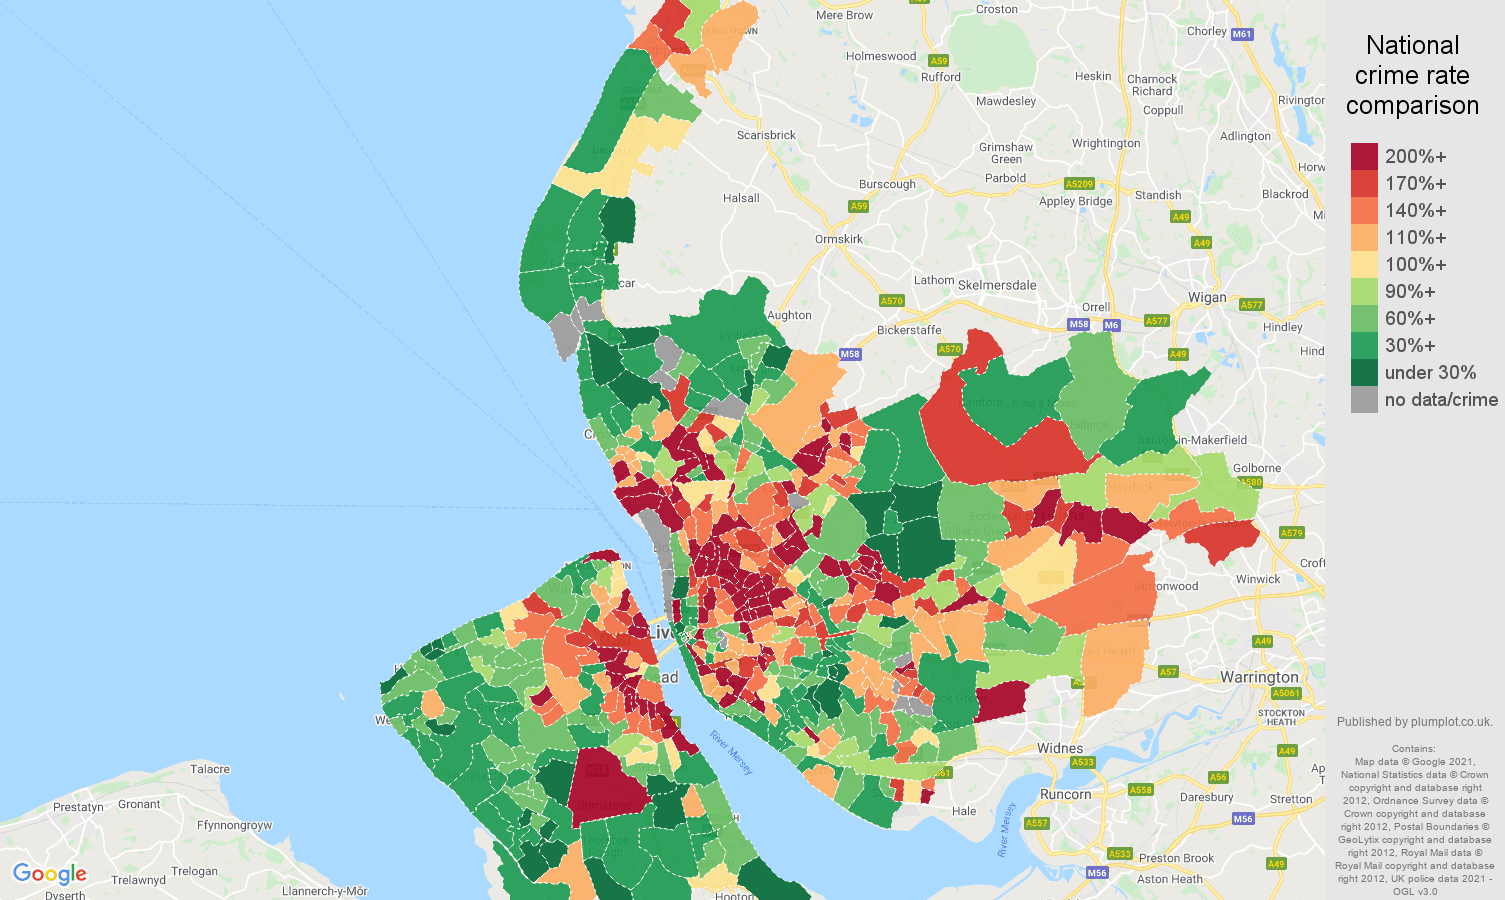
As of June 2026, the annual crime rate in Merseyside county stands at 44.1 crimes per 1000 people. Merseyside's current crime levels are at 124% of the national crime rate. Violent crime makes up 39.7% of all crimes reported in the county. Violent crime totalled 60.3k representing an increase 2.7% year-over-year.
| Merseyside county | crime statistic | England & Wales |
|---|---|---|
| 44.1 | annual crime rate per 1k workday people | 35.7 |
| 124% | ratio of national crime rate | 100% |
| 39.7% | share of all crimes | 35.4% |
| 60.3k | crimes reported | 2.0M |
| 2.7% | annual change | 1.8% |
| Postcode sector | Crime rate vs. ENG & WLS rate | Crime rate per 1000 workday people | Total number of crimes | |
|---|---|---|---|---|
| CH41 0 | 150% | 53 | 148 | |
| CH41 1 | 169% | 60 | 98 | |
| CH41 2 | 242% | 86 | 344 | |
| CH41 3 | 179% | 64 | 134 | |
| CH41 4 | 157% | 56 | 274 | |
| CH41 5 | 55% | 19 | 88 | |
| CH41 6 | 215% | 77 | 340 | |
| CH41 7 | 133% | 47 | 148 | |
| CH41 8 | 194% | 69 | 238 | |
| CH41 9 | 147% | 52 | 189 | |
| CH42 0 | 191% | 68 | 159 | |
| CH42 1 | 220% | 78 | 238 | |
| CH42 2 | 191% | 68 | 135 | |
| CH42 3 | 145% | 52 | 101 | |
| CH42 4 | 141% | 50 | 166 | |
| CH42 5 | 194% | 69 | 163 | |
| CH42 6 | 157% | 56 | 150 | |
| CH42 7 | 201% | 72 | 126 | |
| CH42 8 | 73% | 26 | 49 | |
| CH42 9 | 132% | 47 | 159 | |
| CH43 0 | 62% | 22 | 70 | |
| CH43 1 | 121% | 43 | 107 | |
| CH43 2 | 39% | 14 | 39 | |
| CH43 3 | 63% | 23 | 72 | |
| CH43 4 | 196% | 70 | 175 | |
| CH43 5 | 115% | 41 | 96 | |
| CH43 6 | 76% | 27 | 36 | |
| CH43 7 | 140% | 50 | 255 | |
| CH43 8 | 85% | 30 | 36 | |
| CH43 9 | 115% | 41 | 226 | |
| CH44 0 | 207% | 74 | 169 | |
| CH44 1 | 132% | 47 | 102 | |
| CH44 2 | 134% | 48 | 103 | |
| CH44 3 | 41% | 15 | 28 | |
| CH44 4 | 131% | 47 | 183 | |
| CH44 5 | 145% | 52 | 186 | |
| CH44 6 | 210% | 75 | 211 | |
| CH44 7 | 170% | 61 | 177 | |
| CH44 8 | 165% | 59 | 134 | |
| CH44 9 | 259% | 92 | 239 | |
| CH45 0 | 95% | 34 | 42 | |
| CH45 1 | 125% | 45 | 96 | |
| CH45 2 | 270% | 96 | 184 | |
| CH45 3 | 67% | 24 | 60 | |
| CH45 4 | 114% | 41 | 148 | |
| CH45 5 | 75% | 27 | 91 | |
| CH45 6 | 79% | 28 | 43 | |
| CH45 7 | 112% | 40 | 122 | |
| CH45 8 | 77% | 28 | 85 | |
| CH45 9 | 57% | 20 | 27 | |
| CH46 0 | 89% | 32 | 98 | |
| CH46 1 | 118% | 42 | 110 | |
| CH46 2 | 167% | 59 | 121 | |
| CH46 3 | 115% | 41 | 49 | |
| CH46 4 | 74% | 26 | 7 | |
| CH46 5 | 41% | 15 | 6 | |
| CH46 6 | 90% | 32 | 119 | |
| CH46 7 | 115% | 41 | 98 | |
| CH46 8 | 121% | 43 | 138 | |
| CH46 9 | 106% | 38 | 84 | |
| CH47 0 | 9% | 3 | 3 | |
| CH47 1 | 43% | 15 | 11 | |
| CH47 2 | 86% | 31 | 59 | |
| CH47 3 | 63% | 23 | 42 | |
| CH47 4 | 47% | 17 | 18 | |
| CH47 5 | 34% | 12 | 10 | |
| CH47 6 | 30% | 11 | 7 | |
| CH47 7 | 38% | 14 | 10 | |
| CH47 8 | 66% | 23 | 6 | |
| CH47 9 | 35% | 13 | 9 | |
| CH48 0 | 50% | 18 | 25 | |
| CH48 1 | 39% | 14 | 17 | |
| CH48 2 | 6% | 2 | 2 | |
| CH48 3 | 30% | 11 | 14 | |
| CH48 4 | 64% | 23 | 39 | |
| CH48 5 | 76% | 27 | 58 | |
| CH48 6 | 93% | 33 | 55 | |
| CH48 7 | 39% | 14 | 10 | |
| CH48 8 | 15% | 5 | 5 | |
| CH48 9 | 44% | 16 | 19 | |
| CH49 0 | 100% | 36 | 73 | |
| CH49 1 | 33% | 12 | 18 | |
| CH49 2 | 62% | 22 | 53 | |
| CH49 3 | 58% | 21 | 52 | |
| CH49 4 | 60% | 21 | 78 | |
| CH49 5 | 89% | 32 | 187 | |
| CH49 6 | 58% | 21 | 52 | |
| CH49 7 | 127% | 45 | 112 | |
| CH49 8 | 138% | 49 | 102 | |
| CH49 9 | 141% | 50 | 91 | |
| CH60 0 | 78% | 28 | 37 | |
| CH60 1 | 52% | 19 | 26 | |
| CH60 2 | 11% | 4 | 4 | |
| CH60 3 | 36% | 13 | 11 | |
| CH60 4 | 3% | 1 | 1 | |
| CH60 5 | 50% | 18 | 31 | |
| CH60 6 | 36% | 13 | 13 | |
| CH60 7 | 58% | 21 | 34 | |
| CH60 8 | 47% | 17 | 18 | |
| CH60 9 | 42% | 15 | 14 | |
| CH61 0 | 72% | 26 | 12 | |
| CH61 1 | 24% | 9 | 10 | |
| CH61 2 | 23% | 8 | 4 | |
| CH61 3 | 39% | 14 | 17 | |
| CH61 4 | 56% | 20 | 33 | |
| CH61 5 | 103% | 37 | 56 | |
| CH61 6 | 48% | 17 | 31 | |
| CH61 7 | 47% | 17 | 20 | |
| CH61 8 | 93% | 33 | 53 | |
| CH61 9 | 65% | 23 | 35 | |
| CH62 0 | 60% | 22 | 33 | |
| CH62 1 | 166% | 59 | 134 | |
| CH62 2 | 65% | 23 | 55 | |
| CH62 3 | 79% | 28 | 67 | |
| CH62 4 | 59% | 21 | 83 | |
| CH62 5 | 113% | 40 | 108 | |
| CH62 6 | 49% | 17 | 43 | |
| CH62 7 | 52% | 19 | 132 | |
| CH62 8 | 60% | 21 | 75 | |
| CH62 9 | 125% | 45 | 110 | |
| CH63 0 | 33% | 12 | 34 | |
| CH63 1 | 30% | 11 | 6 | |
| CH63 2 | 63% | 22 | 72 | |
| CH63 3 | 48% | 17 | 76 | |
| CH63 4 | 207% | 74 | 119 | |
| CH63 5 | 48% | 17 | 51 | |
| CH63 6 | 48% | 17 | 6 | |
| CH63 7 | 95% | 34 | 115 | |
| CH63 8 | 101% | 36 | 82 | |
| CH63 9 | 26% | 9 | 40 | |
| CH64 1 | 30% | 11 | 12 | |
| CH64 3 | 102% | 36 | 74 | |
| CH64 6 | 38% | 14 | 29 | |
| CH64 7 | 60% | 21 | 17 | |
| CH65 1 | 169% | 60 | 7 | |
| L1 0 | 7629% | 2720 | 68 | |
| L1 1 | 480% | 171 | 730 | |
| L1 2 | 105% | 38 | 61 | |
| L1 3 | 81% | 29 | 125 | |
| L1 4 | 575% | 205 | 1107 | |
| L1 5 | 138% | 49 | 192 | |
| L1 6 | 307% | 110 | 501 | |
| L1 7 | 99% | 35 | 34 | |
| L1 8 | 165% | 59 | 117 | |
| L1 9 | 161% | 57 | 129 | |
| L10 0 | 162% | 58 | 31 | |
| L10 1 | 84% | 30 | 89 | |
| L10 2 | 29% | 10 | 14 | |
| L10 3 | 75% | 27 | 25 | |
| L10 4 | 90% | 32 | 78 | |
| L10 6 | 83% | 30 | 26 | |
| L10 7 | 187% | 67 | 100 | |
| L10 8 | 62% | 22 | 41 | |
| L10 9 | 121% | 43 | 54 | |
| L11 0 | 86% | 31 | 61 | |
| L11 1 | 272% | 97 | 260 | |
| L11 2 | 223% | 79 | 251 | |
| L11 3 | 189% | 67 | 202 | |
| L11 4 | 151% | 54 | 116 | |
| L11 5 | 91% | 32 | 43 | |
| L11 6 | 92% | 33 | 27 | |
| L11 7 | 106% | 38 | 94 | |
| L11 8 | 101% | 36 | 52 | |
| L11 9 | 151% | 54 | 109 | |
| L12 0 | 91% | 32 | 189 | |
| L12 1 | 95% | 34 | 34 | |
| L12 2 | 74% | 26 | 43 | |
| L12 3 | 47% | 17 | 25 | |
| L12 4 | 171% | 61 | 125 | |
| L12 5 | 76% | 27 | 66 | |
| L12 6 | 133% | 47 | 63 | |
| L12 7 | 88% | 31 | 61 | |
| L12 8 | 88% | 31 | 71 | |
| L12 9 | 91% | 33 | 109 | |
| L13 0 | 96% | 34 | 58 | |
| L13 1 | 128% | 46 | 105 | |
| L13 2 | 132% | 47 | 127 | |
| L13 3 | 99% | 35 | 133 | |
| L13 4 | 124% | 44 | 134 | |
| L13 5 | 126% | 45 | 190 | |
| L13 6 | 117% | 42 | 110 | |
| L13 7 | 164% | 59 | 203 | |
| L13 8 | 180% | 64 | 173 | |
| L13 9 | 112% | 40 | 84 | |
| L14 0 | 140% | 50 | 186 | |
| L14 1 | 170% | 61 | 97 | |
| L14 2 | 124% | 44 | 101 | |
| L14 3 | 129% | 46 | 120 | |
| L14 4 | 239% | 85 | 123 | |
| L14 5 | 55% | 20 | 66 | |
| L14 6 | 76% | 27 | 47 | |
| L14 7 | 96% | 34 | 77 | |
| L14 8 | 201% | 72 | 133 | |
| L14 9 | 181% | 65 | 196 | |
| L15 0 | 216% | 77 | 185 | |
| L15 1 | 242% | 86 | 175 | |
| L15 2 | 84% | 30 | 54 | |
| L15 3 | 66% | 24 | 87 | |
| L15 4 | 118% | 42 | 189 | |
| L15 5 | 74% | 26 | 48 | |
| L15 6 | 80% | 28 | 74 | |
| L15 7 | 82% | 29 | 57 | |
| L15 8 | 149% | 53 | 154 | |
| L15 9 | 88% | 31 | 35 | |
| L16 0 | 18% | 6 | 5 | |
| L16 1 | 33% | 12 | 9 | |
| L16 2 | 85% | 30 | 44 | |
| L16 3 | 43% | 15 | 21 | |
| L16 4 | 38% | 14 | 9 | |
| L16 5 | 65% | 23 | 21 | |
| L16 6 | 80% | 28 | 18 | |
| L16 7 | 77% | 28 | 38 | |
| L16 8 | 46% | 16 | 13 | |
| L16 9 | 14% | 5 | 14 | |
| L17 0 | 114% | 41 | 110 | |
| L17 1 | 119% | 42 | 49 | |
| L17 2 | 103% | 37 | 55 | |
| L17 3 | 300% | 107 | 185 | |
| L17 4 | 298% | 106 | 123 | |
| L17 5 | 96% | 34 | 33 | |
| L17 6 | 50% | 18 | 42 | |
| L17 7 | 67% | 24 | 74 | |
| L17 8 | 226% | 81 | 161 | |
| L17 9 | 81% | 29 | 45 | |
| L18 0 | 41% | 15 | 13 | |
| L18 1 | 56% | 20 | 90 | |
| L18 2 | 20% | 7 | 10 | |
| L18 3 | 56% | 20 | 48 | |
| L18 4 | 50% | 18 | 26 | |
| L18 5 | 82% | 29 | 64 | |
| L18 6 | 39% | 14 | 29 | |
| L18 7 | 51% | 18 | 34 | |
| L18 8 | 112% | 40 | 124 | |
| L18 9 | 60% | 21 | 51 | |
| L19 0 | 71% | 25 | 51 | |
| L19 1 | 87% | 31 | 44 | |
| L19 2 | 89% | 32 | 215 | |
| L19 3 | 58% | 21 | 31 | |
| L19 4 | 141% | 50 | 111 | |
| L19 5 | 165% | 59 | 81 | |
| L19 6 | 189% | 67 | 65 | |
| L19 7 | 16% | 6 | 4 | |
| L19 8 | 168% | 60 | 159 | |
| L19 9 | 70% | 25 | 61 | |
| L2 0 | 42% | 15 | 37 | |
| L2 2 | 97% | 35 | 114 | |
| L2 3 | 66% | 24 | 25 | |
| L2 4 | 30% | 11 | 35 | |
| L2 5 | 152% | 54 | 81 | |
| L2 6 | 348% | 124 | 296 | |
| L2 7 | 115% | 41 | 99 | |
| L2 8 | 640% | 228 | 153 | |
| L2 9 | 146% | 52 | 30 | |
| L20 0 | 163% | 58 | 141 | |
| L20 1 | 157% | 56 | 6 | |
| L20 2 | 239% | 85 | 221 | |
| L20 3 | 173% | 62 | 274 | |
| L20 4 | 224% | 80 | 638 | |
| L20 5 | 209% | 75 | 185 | |
| L20 6 | 104% | 37 | 208 | |
| L20 7 | 136% | 48 | 255 | |
| L20 8 | 115% | 41 | 55 | |
| L20 9 | 124% | 44 | 230 | |
| L21 0 | 173% | 62 | 201 | |
| L21 1 | 214% | 76 | 235 | |
| L21 2 | 148% | 53 | 48 | |
| L21 3 | 297% | 106 | 51 | |
| L21 4 | 213% | 76 | 96 | |
| L21 5 | 83% | 30 | 33 | |
| L21 6 | 306% | 109 | 82 | |
| L21 7 | 174% | 62 | 167 | |
| L21 8 | 221% | 79 | 237 | |
| L21 9 | 115% | 41 | 140 | |
| L22 0 | 116% | 41 | 67 | |
| L22 1 | 94% | 33 | 32 | |
| L22 2 | 48% | 17 | 18 | |
| L22 3 | 59% | 21 | 38 | |
| L22 4 | 95% | 34 | 47 | |
| L22 5 | 157% | 56 | 105 | |
| L22 6 | 84% | 30 | 24 | |
| L22 7 | 49% | 17 | 13 | |
| L22 8 | 201% | 72 | 56 | |
| L22 9 | 81% | 29 | 32 | |
| L23 0 | 52% | 18 | 74 | |
| L23 1 | 165% | 59 | 92 | |
| L23 2 | 94% | 33 | 120 | |
| L23 3 | 42% | 15 | 27 | |
| L23 4 | 81% | 29 | 30 | |
| L23 5 | 102% | 36 | 79 | |
| L23 6 | 54% | 19 | 47 | |
| L23 7 | 53% | 19 | 42 | |
| L23 8 | 25% | 9 | 16 | |
| L23 9 | 127% | 45 | 176 | |
| L24 0 | 196% | 70 | 120 | |
| L24 1 | 54% | 19 | 137 | |
| L24 2 | 120% | 43 | 164 | |
| L24 3 | 58% | 21 | 120 | |
| L24 6 | 191% | 68 | 64 | |
| L24 7 | 274% | 98 | 98 | |
| L24 9 | 72% | 26 | 41 | |
| L25 0 | 51% | 18 | 86 | |
| L25 1 | 77% | 27 | 46 | |
| L25 2 | 153% | 55 | 204 | |
| L25 3 | 115% | 41 | 88 | |
| L25 4 | 67% | 24 | 40 | |
| L25 5 | 131% | 47 | 139 | |
| L25 6 | 51% | 18 | 39 | |
| L25 7 | 94% | 34 | 126 | |
| L25 8 | 73% | 26 | 62 | |
| L25 9 | 99% | 35 | 119 | |
| L26 0 | 173% | 62 | 106 | |
| L26 1 | 132% | 47 | 110 | |
| L26 2 | 183% | 65 | 13 | |
| L26 3 | 91% | 32 | 8 | |
| L26 6 | 108% | 38 | 32 | |
| L26 7 | 55% | 20 | 47 | |
| L26 9 | 73% | 26 | 141 | |
| L27 0 | 112% | 40 | 2 | |
| L27 1 | 129% | 46 | 60 | |
| L27 2 | 56% | 20 | 1 | |
| L27 4 | 262% | 93 | 29 | |
| L27 5 | 82% | 29 | 21 | |
| L27 6 | 163% | 58 | 46 | |
| L27 7 | 160% | 57 | 74 | |
| L27 8 | 162% | 58 | 40 | |
| L28 0 | 169% | 60 | 40 | |
| L28 1 | 176% | 63 | 96 | |
| L28 3 | 267% | 95 | 14 | |
| L28 4 | 155% | 55 | 45 | |
| L28 5 | 201% | 72 | 48 | |
| L28 6 | 385% | 137 | 43 | |
| L28 7 | 240% | 86 | 41 | |
| L28 8 | 89% | 32 | 11 | |
| L29 1 | 351% | 125 | 5 | |
| L29 5 | 62% | 22 | 1 | |
| L29 6 | 33% | 12 | 2 | |
| L29 9 | 83% | 30 | 5 | |
| L3 0 | 16% | 6 | 3 | |
| L3 1 | 42% | 15 | 61 | |
| L3 2 | 52% | 19 | 92 | |
| L3 3 | 431% | 154 | 211 | |
| L3 4 | 47% | 17 | 143 | |
| L3 5 | 102% | 36 | 255 | |
| L3 6 | 105% | 37 | 158 | |
| L3 7 | 392% | 140 | 91 | |
| L3 8 | 152% | 54 | 195 | |
| L3 9 | 25% | 9 | 93 | |
| L30 0 | 214% | 76 | 121 | |
| L30 1 | 80% | 29 | 156 | |
| L30 2 | 238% | 85 | 212 | |
| L30 3 | 107% | 38 | 64 | |
| L30 4 | 1080% | 385 | 62 | |
| L30 5 | 221% | 79 | 188 | |
| L30 6 | 89% | 32 | 21 | |
| L30 7 | 95% | 34 | 78 | |
| L30 8 | 72% | 26 | 34 | |
| L30 9 | 90% | 32 | 52 | |
| L31 0 | 44% | 16 | 28 | |
| L31 1 | 215% | 77 | 329 | |
| L31 2 | 56% | 20 | 52 | |
| L31 3 | 108% | 38 | 62 | |
| L31 4 | 55% | 20 | 37 | |
| L31 5 | 67% | 24 | 56 | |
| L31 6 | 72% | 26 | 61 | |
| L31 7 | 47% | 17 | 46 | |
| L31 8 | 39% | 14 | 36 | |
| L31 9 | 55% | 20 | 58 | |
| L32 0 | 211% | 75 | 191 | |
| L32 1 | 98% | 35 | 37 | |
| L32 2 | 111% | 39 | 60 | |
| L32 3 | 141% | 50 | 47 | |
| L32 4 | 225% | 80 | 109 | |
| L32 5 | 283% | 101 | 67 | |
| L32 6 | 46% | 16 | 59 | |
| L32 7 | 124% | 44 | 107 | |
| L32 8 | 206% | 73 | 228 | |
| L32 9 | 128% | 46 | 113 | |
| L33 0 | 182% | 65 | 84 | |
| L33 1 | 160% | 57 | 192 | |
| L33 2 | 101% | 36 | 29 | |
| L33 3 | 48% | 17 | 12 | |
| L33 5 | 89% | 32 | 91 | |
| L33 6 | 89% | 32 | 78 | |
| L33 7 | 39% | 14 | 21 | |
| L33 8 | 169% | 60 | 52 | |
| L33 9 | 177% | 63 | 138 | |
| L34 0 | 43% | 15 | 50 | |
| L34 1 | 92% | 33 | 104 | |
| L34 2 | 75% | 27 | 68 | |
| L34 3 | 197% | 70 | 60 | |
| L34 4 | 46% | 17 | 9 | |
| L34 5 | 252% | 90 | 230 | |
| L34 6 | 121% | 43 | 69 | |
| L34 7 | 8% | 3 | 1 | |
| L34 8 | 5% | 2 | 2 | |
| L34 9 | 2% | 1 | 1 | |
| L35 0 | 37% | 13 | 31 | |
| L35 1 | 51% | 18 | 35 | |
| L35 2 | 89% | 32 | 134 | |
| L35 3 | 121% | 43 | 271 | |
| L35 4 | 88% | 31 | 71 | |
| L35 5 | 265% | 95 | 330 | |
| L35 6 | 99% | 35 | 50 | |
| L35 7 | 103% | 37 | 68 | |
| L35 8 | 40% | 14 | 69 | |
| L35 9 | 151% | 54 | 60 | |
| L36 0 | 106% | 38 | 153 | |
| L36 1 | 178% | 63 | 130 | |
| L36 2 | 148% | 53 | 204 | |
| L36 3 | 211% | 75 | 283 | |
| L36 4 | 60% | 22 | 90 | |
| L36 5 | 78% | 28 | 118 | |
| L36 6 | 120% | 43 | 135 | |
| L36 7 | 142% | 51 | 193 | |
| L36 8 | 141% | 50 | 188 | |
| L36 9 | 66% | 24 | 75 | |
| L37 0 | 55% | 20 | 7 | |
| L37 1 | 34% | 12 | 26 | |
| L37 2 | 62% | 22 | 80 | |
| L37 3 | 73% | 26 | 105 | |
| L37 4 | 48% | 17 | 53 | |
| L37 6 | 109% | 39 | 97 | |
| L37 7 | 35% | 12 | 36 | |
| L37 8 | 50% | 18 | 26 | |
| L38 0 | 36% | 13 | 5 | |
| L38 1 | 96% | 34 | 6 | |
| L38 3 | 37% | 13 | 4 | |
| L38 5 | 92% | 33 | 2 | |
| L38 6 | 89% | 32 | 7 | |
| L38 7 | 479% | 171 | 7 | |
| L38 9 | 66% | 24 | 16 | |
| L4 0 | 310% | 111 | 308 | |
| L4 1 | 285% | 102 | 229 | |
| L4 2 | 208% | 74 | 323 | |
| L4 3 | 210% | 75 | 249 | |
| L4 4 | 308% | 110 | 438 | |
| L4 5 | 261% | 93 | 432 | |
| L4 6 | 158% | 56 | 136 | |
| L4 7 | 130% | 46 | 116 | |
| L4 8 | 151% | 54 | 121 | |
| L4 9 | 137% | 49 | 220 | |
| L5 0 | 161% | 57 | 88 | |
| L5 1 | 255% | 91 | 52 | |
| L5 2 | 175% | 62 | 76 | |
| L5 3 | 159% | 57 | 92 | |
| L5 4 | 72% | 26 | 35 | |
| L5 5 | 233% | 83 | 135 | |
| L5 6 | 254% | 90 | 191 | |
| L5 7 | 130% | 46 | 72 | |
| L5 8 | 156% | 55 | 91 | |
| L5 9 | 97% | 34 | 102 | |
| L6 0 | 219% | 78 | 158 | |
| L6 1 | 178% | 63 | 158 | |
| L6 2 | 144% | 51 | 109 | |
| L6 3 | 275% | 98 | 159 | |
| L6 4 | 242% | 86 | 312 | |
| L6 5 | 161% | 58 | 157 | |
| L6 6 | 187% | 67 | 162 | |
| L6 7 | 504% | 180 | 141 | |
| L6 8 | 230% | 82 | 102 | |
| L6 9 | 143% | 51 | 69 | |
| L7 0 | 217% | 77 | 368 | |
| L7 1 | 119% | 42 | 34 | |
| L7 2 | 222% | 79 | 135 | |
| L7 3 | 127% | 45 | 152 | |
| L7 4 | 257% | 92 | 40 | |
| L7 5 | 257% | 92 | 67 | |
| L7 6 | 105% | 37 | 67 | |
| L7 7 | 51% | 18 | 73 | |
| L7 8 | 88% | 31 | 285 | |
| L7 9 | 115% | 41 | 68 | |
| L8 0 | 209% | 75 | 429 | |
| L8 1 | 203% | 73 | 101 | |
| L8 2 | 139% | 50 | 97 | |
| L8 3 | 219% | 78 | 202 | |
| L8 4 | 110% | 39 | 123 | |
| L8 5 | 175% | 62 | 102 | |
| L8 6 | 126% | 45 | 146 | |
| L8 7 | 126% | 45 | 228 | |
| L8 8 | 172% | 61 | 230 | |
| L8 9 | 195% | 69 | 152 | |
| L9 0 | 98% | 35 | 127 | |
| L9 1 | 322% | 115 | 754 | |
| L9 2 | 88% | 32 | 72 | |
| L9 3 | 151% | 54 | 179 | |
| L9 4 | 237% | 85 | 105 | |
| L9 5 | 178% | 64 | 43 | |
| L9 6 | 152% | 54 | 203 | |
| L9 7 | 233% | 83 | 352 | |
| L9 8 | 114% | 40 | 151 | |
| L9 9 | 63% | 23 | 149 | |
| PR8 1 | 183% | 65 | 475 | |
| PR8 2 | 46% | 16 | 135 | |
| PR8 3 | 103% | 37 | 340 | |
| PR8 4 | 78% | 28 | 239 | |
| PR8 6 | 106% | 38 | 476 | |
| PR9 0 | 171% | 61 | 648 | |
| PR9 7 | 79% | 28 | 262 | |
| PR9 9 | 83% | 29 | 348 | |
| WA10 1 | 181% | 65 | 509 | |
| WA10 2 | 204% | 73 | 515 | |
| WA10 3 | 121% | 43 | 439 | |
| WA10 4 | 151% | 54 | 312 | |
| WA10 5 | 66% | 24 | 103 | |
| WA10 6 | 125% | 45 | 258 | |
| WA11 0 | 99% | 35 | 469 | |
| WA11 7 | 139% | 49 | 290 | |
| WA11 8 | 55% | 20 | 105 | |
| WA11 9 | 94% | 34 | 387 | |
| WA12 0 | 92% | 33 | 151 | |
| WA12 8 | 197% | 70 | 381 | |
| WA12 9 | 142% | 51 | 463 | |
| WA8 3 | 72% | 26 | 125 | |
| WA8 4 | 184% | 66 | 301 | |
| WA8 5 | 107% | 38 | 72 | |
| WA9 1 | 214% | 76 | 570 | |
| WA9 2 | 230% | 82 | 439 | |
| WA9 3 | 147% | 52 | 583 | |
| WA9 4 | 124% | 44 | 483 | |
| WA9 5 | 129% | 46 | 544 | |
| WN4 0 | 40% | 14 | 101 | |
| WN5 7 | 36% | 13 | 100 | |
Crime rate ranking : Merseyside county has the 6. highest crime rate out of 54 counties
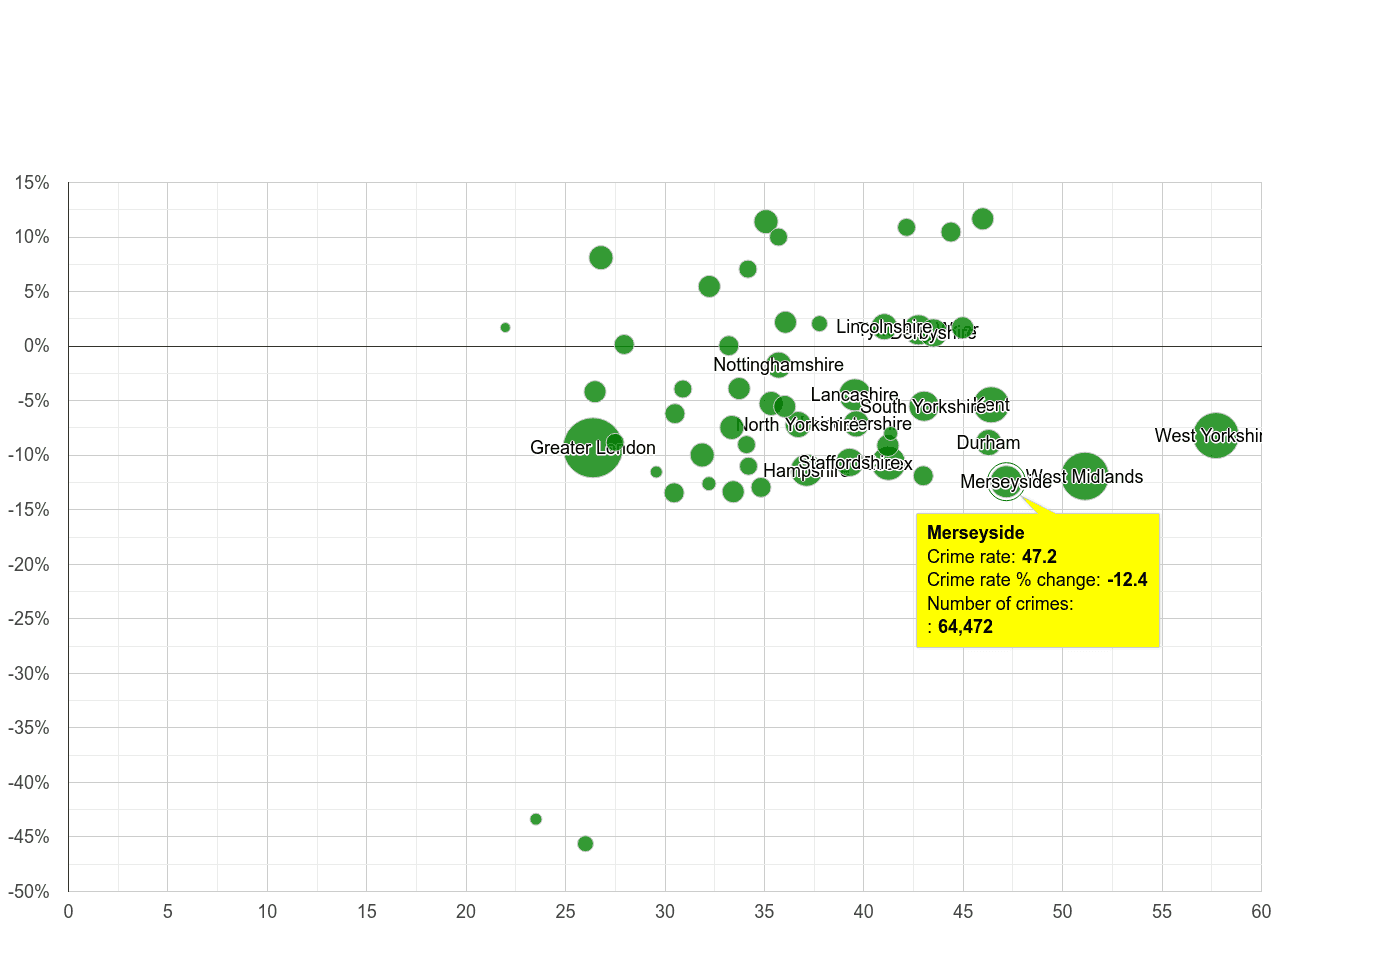
Violent crime totalled 60.3k representing an increase 2.7% year-over-year. In the graph below, county are compared by crime rate and crime rate percentage change. Crime rate percentage change compares the county crime rate between June 2025 - May 2026 to the county crime rate in the previous 12 months. The size of the circle reflects the number of total crimes reported. The bigger the circle, the higher the number of crimes reported in the county.
+2.7% annual change, crime is increasing
60.3k crimes reported
 Crime rate percentage change
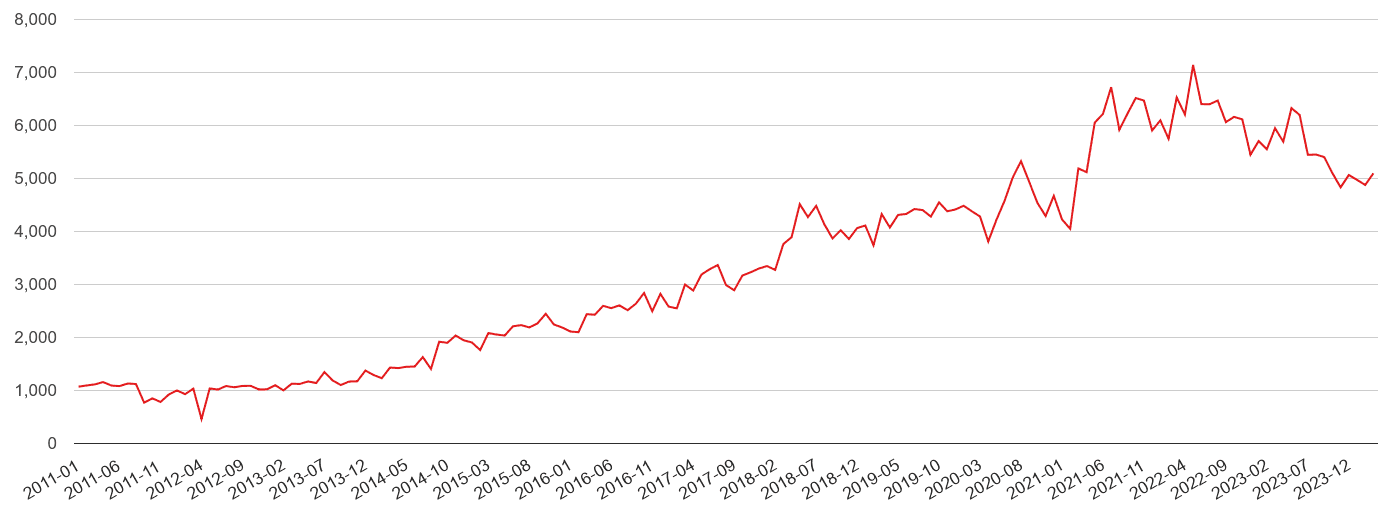
Number of crime incidents by month from January 2014 to May 2026.
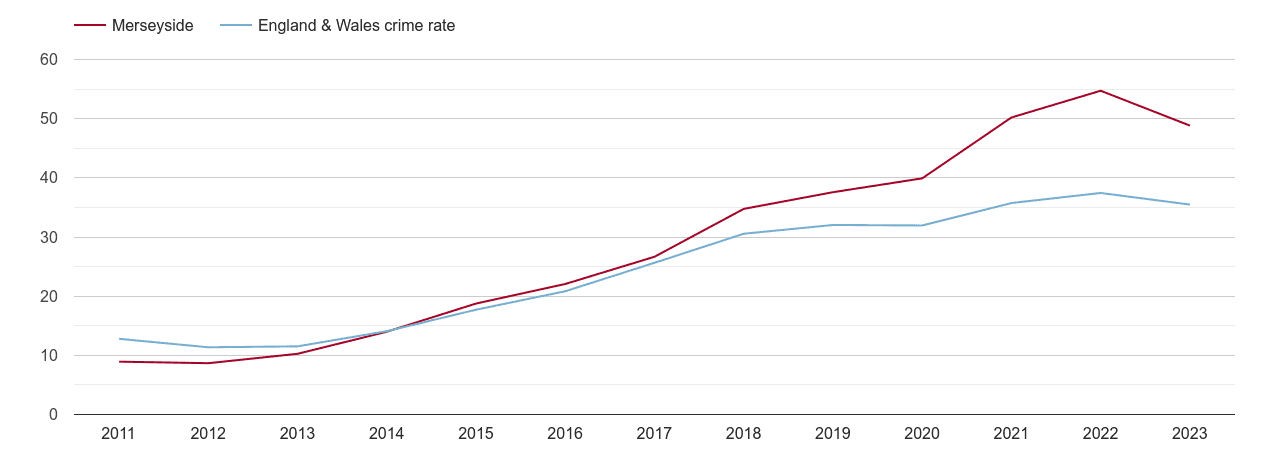
Crime rate per 1000 workday people compared to the national crime rate by year.
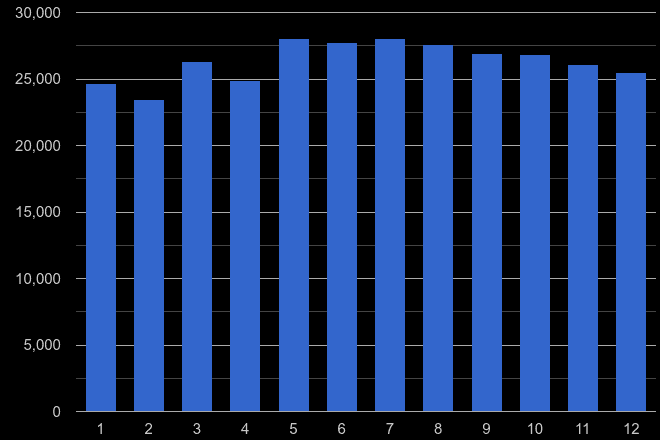
Total number of crimes reported in a given calendar month (1 = January … 12 = December) in the previous five years, i.e. from 2020 till 2024.

For details, click on the crime name with '→'
 login →


