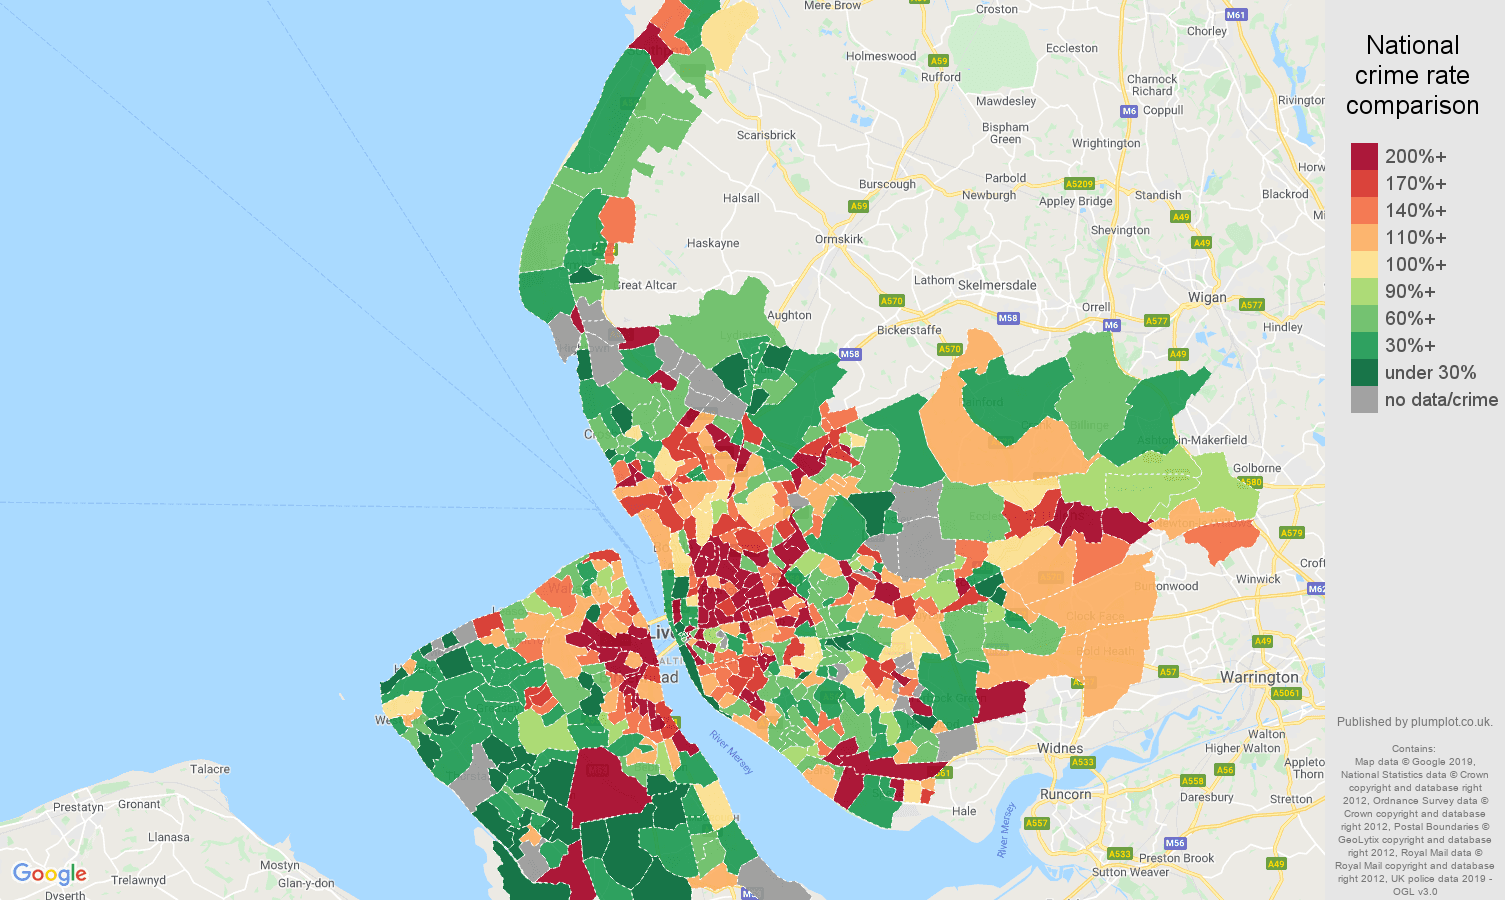
As of April 2026, the annual crime rate in Merseyside county stands at 11.2 crimes per 1000 people. Merseyside's current crime levels are at 162% of the national crime rate. Public order crime makes up 10.0% of all crimes reported in the county. Public order crime totalled 15.3k representing a decrease 2.1% year-over-year.
| Merseyside county | crime statistic | England & Wales |
|---|---|---|
| 11.2 | annual crime rate per 1k workday people | 6.9 |
| 162% | ratio of national crime rate | 100% |
| 10.0% | share of all crimes | 6.9% |
| 15.3k | crimes reported | 387k |
| -2.1% | annual change | -4.4% |
| Postcode sector | Crime rate vs. ENG & WLS rate | Crime rate per 1000 workday people | Total number of crimes | |
|---|---|---|---|---|
| CH41 0 | 156% | 11 | 30 | |
| CH41 1 | 276% | 19 | 31 | |
| CH41 2 | 462% | 32 | 127 | |
| CH41 3 | 200% | 14 | 29 | |
| CH41 4 | 213% | 15 | 72 | |
| CH41 5 | 173% | 12 | 54 | |
| CH41 6 | 477% | 33 | 146 | |
| CH41 7 | 190% | 13 | 41 | |
| CH41 8 | 442% | 31 | 105 | |
| CH41 9 | 193% | 13 | 48 | |
| CH42 0 | 230% | 16 | 37 | |
| CH42 1 | 219% | 15 | 46 | |
| CH42 2 | 233% | 16 | 32 | |
| CH42 3 | 267% | 18 | 36 | |
| CH42 4 | 136% | 9 | 31 | |
| CH42 5 | 246% | 17 | 40 | |
| CH42 6 | 108% | 7 | 20 | |
| CH42 7 | 173% | 12 | 21 | |
| CH42 8 | 138% | 10 | 18 | |
| CH42 9 | 219% | 15 | 51 | |
| CH43 0 | 64% | 4 | 14 | |
| CH43 1 | 129% | 9 | 22 | |
| CH43 2 | 36% | 2 | 7 | |
| CH43 3 | 95% | 7 | 21 | |
| CH43 4 | 185% | 13 | 32 | |
| CH43 5 | 180% | 12 | 29 | |
| CH43 6 | 33% | 2 | 3 | |
| CH43 7 | 186% | 13 | 66 | |
| CH43 8 | 97% | 7 | 8 | |
| CH43 9 | 105% | 7 | 40 | |
| CH44 0 | 214% | 15 | 34 | |
| CH44 1 | 161% | 11 | 24 | |
| CH44 2 | 148% | 10 | 22 | |
| CH44 3 | 38% | 3 | 5 | |
| CH44 4 | 96% | 7 | 26 | |
| CH44 5 | 190% | 13 | 47 | |
| CH44 6 | 195% | 13 | 38 | |
| CH44 7 | 119% | 8 | 24 | |
| CH44 8 | 140% | 10 | 22 | |
| CH44 9 | 257% | 18 | 46 | |
| CH45 0 | 12% | 1 | 1 | |
| CH45 1 | 189% | 13 | 28 | |
| CH45 2 | 591% | 41 | 78 | |
| CH45 3 | 103% | 7 | 18 | |
| CH45 4 | 159% | 11 | 40 | |
| CH45 5 | 89% | 6 | 21 | |
| CH45 6 | 57% | 4 | 6 | |
| CH45 7 | 47% | 3 | 10 | |
| CH45 8 | 108% | 7 | 23 | |
| CH45 9 | 44% | 3 | 4 | |
| CH46 0 | 51% | 4 | 11 | |
| CH46 1 | 128% | 9 | 23 | |
| CH46 2 | 220% | 15 | 31 | |
| CH46 3 | 121% | 8 | 10 | |
| CH46 4 | 109% | 8 | 2 | |
| CH46 5 | 35% | 2 | 1 | |
| CH46 6 | 59% | 4 | 15 | |
| CH46 7 | 103% | 7 | 17 | |
| CH46 8 | 150% | 10 | 33 | |
| CH46 9 | 137% | 9 | 21 | |
| CH47 1 | 102% | 7 | 5 | |
| CH47 2 | 165% | 11 | 22 | |
| CH47 3 | 101% | 7 | 13 | |
| CH47 4 | 67% | 5 | 5 | |
| CH47 5 | 71% | 5 | 4 | |
| CH47 6 | 110% | 8 | 5 | |
| CH47 8 | 57% | 4 | 1 | |
| CH47 9 | 20% | 1 | 1 | |
| CH48 0 | 124% | 9 | 12 | |
| CH48 1 | 70% | 5 | 6 | |
| CH48 2 | 64% | 4 | 4 | |
| CH48 3 | 55% | 4 | 5 | |
| CH48 4 | 93% | 6 | 11 | |
| CH48 5 | 61% | 4 | 9 | |
| CH48 6 | 87% | 6 | 10 | |
| CH48 7 | 20% | 1 | 1 | |
| CH48 8 | 30% | 2 | 2 | |
| CH48 9 | 24% | 2 | 2 | |
| CH49 0 | 178% | 12 | 25 | |
| CH49 1 | 19% | 1 | 2 | |
| CH49 2 | 18% | 1 | 3 | |
| CH49 3 | 74% | 5 | 13 | |
| CH49 4 | 68% | 5 | 17 | |
| CH49 5 | 210% | 15 | 86 | |
| CH49 6 | 138% | 10 | 24 | |
| CH49 7 | 140% | 10 | 24 | |
| CH49 8 | 98% | 7 | 14 | |
| CH49 9 | 231% | 16 | 29 | |
| CH60 0 | 76% | 5 | 7 | |
| CH60 1 | 10% | 1 | 1 | |
| CH60 2 | 28% | 2 | 2 | |
| CH60 3 | 50% | 3 | 3 | |
| CH60 4 | 28% | 2 | 2 | |
| CH60 5 | 83% | 6 | 10 | |
| CH60 6 | 28% | 2 | 2 | |
| CH60 7 | 80% | 6 | 9 | |
| CH60 8 | 41% | 3 | 3 | |
| CH60 9 | 47% | 3 | 3 | |
| CH61 0 | 31% | 2 | 1 | |
| CH61 1 | 50% | 3 | 4 | |
| CH61 2 | 58% | 4 | 2 | |
| CH61 3 | 12% | 1 | 1 | |
| CH61 4 | 61% | 4 | 7 | |
| CH61 5 | 57% | 4 | 6 | |
| CH61 6 | 56% | 4 | 7 | |
| CH61 7 | 120% | 8 | 10 | |
| CH61 8 | 64% | 4 | 7 | |
| CH61 9 | 57% | 4 | 6 | |
| CH62 0 | 47% | 3 | 5 | |
| CH62 1 | 191% | 13 | 30 | |
| CH62 2 | 97% | 7 | 16 | |
| CH62 3 | 225% | 16 | 37 | |
| CH62 4 | 66% | 5 | 18 | |
| CH62 5 | 189% | 13 | 35 | |
| CH62 6 | 99% | 7 | 17 | |
| CH62 7 | 57% | 4 | 28 | |
| CH62 8 | 91% | 6 | 22 | |
| CH62 9 | 182% | 13 | 31 | |
| CH63 0 | 10% | 1 | 2 | |
| CH63 1 | 51% | 4 | 2 | |
| CH63 2 | 77% | 5 | 17 | |
| CH63 3 | 58% | 4 | 18 | |
| CH63 4 | 90% | 6 | 10 | |
| CH63 5 | 68% | 5 | 14 | |
| CH63 6 | 42% | 3 | 1 | |
| CH63 7 | 111% | 8 | 26 | |
| CH63 8 | 95% | 7 | 15 | |
| CH63 9 | 23% | 2 | 7 | |
| CH64 1 | 52% | 4 | 4 | |
| CH64 3 | 150% | 10 | 21 | |
| CH64 6 | 61% | 4 | 9 | |
| CH64 7 | 72% | 5 | 4 | |
| CH65 1 | 874% | 60 | 7 | |
| L1 0 | 8686% | 600 | 15 | |
| L1 1 | 1160% | 80 | 342 | |
| L1 2 | 196% | 14 | 22 | |
| L1 3 | 235% | 16 | 70 | |
| L1 4 | 670% | 46 | 250 | |
| L1 5 | 129% | 9 | 35 | |
| L1 6 | 684% | 47 | 216 | |
| L1 7 | 75% | 5 | 5 | |
| L1 8 | 321% | 22 | 44 | |
| L1 9 | 321% | 22 | 50 | |
| L10 0 | 458% | 32 | 17 | |
| L10 1 | 102% | 7 | 21 | |
| L10 2 | 119% | 8 | 11 | |
| L10 3 | 108% | 7 | 7 | |
| L10 4 | 41% | 3 | 7 | |
| L10 6 | 132% | 9 | 8 | |
| L10 7 | 106% | 7 | 11 | |
| L10 8 | 78% | 5 | 10 | |
| L10 9 | 162% | 11 | 14 | |
| L11 0 | 182% | 13 | 25 | |
| L11 1 | 302% | 21 | 56 | |
| L11 2 | 339% | 23 | 74 | |
| L11 3 | 193% | 13 | 40 | |
| L11 4 | 154% | 11 | 23 | |
| L11 5 | 87% | 6 | 8 | |
| L11 6 | 53% | 4 | 3 | |
| L11 7 | 133% | 9 | 23 | |
| L11 8 | 120% | 8 | 12 | |
| L11 9 | 158% | 11 | 22 | |
| L12 0 | 72% | 5 | 29 | |
| L12 1 | 57% | 4 | 4 | |
| L12 2 | 62% | 4 | 7 | |
| L12 3 | 39% | 3 | 4 | |
| L12 4 | 169% | 12 | 24 | |
| L12 5 | 95% | 7 | 16 | |
| L12 6 | 120% | 8 | 11 | |
| L12 7 | 52% | 4 | 7 | |
| L12 8 | 140% | 10 | 22 | |
| L12 9 | 82% | 6 | 19 | |
| L13 0 | 205% | 14 | 24 | |
| L13 1 | 334% | 23 | 53 | |
| L13 2 | 327% | 23 | 61 | |
| L13 3 | 193% | 13 | 50 | |
| L13 4 | 114% | 8 | 24 | |
| L13 5 | 144% | 10 | 42 | |
| L13 6 | 93% | 6 | 17 | |
| L13 7 | 246% | 17 | 59 | |
| L13 8 | 225% | 16 | 42 | |
| L13 9 | 144% | 10 | 21 | |
| L14 0 | 159% | 11 | 41 | |
| L14 1 | 298% | 21 | 33 | |
| L14 2 | 133% | 9 | 21 | |
| L14 3 | 78% | 5 | 14 | |
| L14 4 | 210% | 15 | 21 | |
| L14 5 | 47% | 3 | 11 | |
| L14 6 | 50% | 3 | 6 | |
| L14 7 | 205% | 14 | 32 | |
| L14 8 | 319% | 22 | 41 | |
| L14 9 | 195% | 14 | 41 | |
| L15 0 | 392% | 27 | 65 | |
| L15 1 | 193% | 13 | 27 | |
| L15 2 | 153% | 11 | 19 | |
| L15 3 | 67% | 5 | 17 | |
| L15 4 | 129% | 9 | 40 | |
| L15 5 | 88% | 6 | 11 | |
| L15 6 | 156% | 11 | 28 | |
| L15 7 | 133% | 9 | 18 | |
| L15 8 | 170% | 12 | 34 | |
| L15 9 | 195% | 13 | 15 | |
| L16 0 | 73% | 5 | 4 | |
| L16 2 | 90% | 6 | 9 | |
| L16 3 | 42% | 3 | 4 | |
| L16 4 | 44% | 3 | 2 | |
| L16 5 | 64% | 4 | 4 | |
| L16 6 | 91% | 6 | 4 | |
| L16 7 | 105% | 7 | 10 | |
| L16 8 | 18% | 1 | 1 | |
| L16 9 | 21% | 1 | 4 | |
| L17 0 | 102% | 7 | 19 | |
| L17 1 | 352% | 24 | 28 | |
| L17 2 | 136% | 9 | 14 | |
| L17 3 | 268% | 19 | 32 | |
| L17 4 | 400% | 28 | 32 | |
| L17 5 | 134% | 9 | 9 | |
| L17 6 | 68% | 5 | 11 | |
| L17 7 | 52% | 4 | 11 | |
| L17 8 | 268% | 19 | 37 | |
| L17 9 | 167% | 12 | 18 | |
| L18 0 | 148% | 10 | 9 | |
| L18 1 | 99% | 7 | 31 | |
| L18 2 | 121% | 8 | 12 | |
| L18 3 | 66% | 5 | 11 | |
| L18 4 | 10% | 1 | 1 | |
| L18 5 | 120% | 8 | 18 | |
| L18 6 | 69% | 5 | 10 | |
| L18 7 | 77% | 5 | 10 | |
| L18 8 | 94% | 6 | 20 | |
| L18 9 | 61% | 4 | 10 | |
| L19 0 | 144% | 10 | 20 | |
| L19 1 | 51% | 4 | 5 | |
| L19 2 | 165% | 11 | 77 | |
| L19 3 | 125% | 9 | 13 | |
| L19 4 | 118% | 8 | 18 | |
| L19 5 | 158% | 11 | 15 | |
| L19 6 | 225% | 16 | 15 | |
| L19 7 | 21% | 1 | 1 | |
| L19 8 | 152% | 11 | 28 | |
| L19 9 | 83% | 6 | 14 | |
| L2 0 | 75% | 5 | 13 | |
| L2 2 | 172% | 12 | 39 | |
| L2 3 | 110% | 8 | 8 | |
| L2 4 | 35% | 2 | 8 | |
| L2 5 | 368% | 25 | 38 | |
| L2 6 | 436% | 30 | 72 | |
| L2 7 | 180% | 12 | 30 | |
| L2 8 | 108% | 7 | 5 | |
| L2 9 | 200% | 14 | 8 | |
| L20 0 | 89% | 6 | 15 | |
| L20 1 | 135% | 9 | 1 | |
| L20 2 | 190% | 13 | 34 | |
| L20 3 | 277% | 19 | 85 | |
| L20 4 | 301% | 21 | 166 | |
| L20 5 | 303% | 21 | 52 | |
| L20 6 | 69% | 5 | 27 | |
| L20 7 | 184% | 13 | 67 | |
| L20 8 | 194% | 13 | 18 | |
| L20 9 | 123% | 8 | 44 | |
| L21 0 | 111% | 8 | 25 | |
| L21 1 | 155% | 11 | 33 | |
| L21 2 | 175% | 12 | 11 | |
| L21 3 | 541% | 37 | 18 | |
| L21 4 | 184% | 13 | 16 | |
| L21 5 | 235% | 16 | 18 | |
| L21 6 | 366% | 25 | 19 | |
| L21 7 | 199% | 14 | 37 | |
| L21 8 | 255% | 18 | 53 | |
| L21 9 | 81% | 6 | 19 | |
| L22 0 | 152% | 11 | 17 | |
| L22 1 | 121% | 8 | 8 | |
| L22 2 | 56% | 4 | 4 | |
| L22 3 | 105% | 7 | 13 | |
| L22 4 | 125% | 9 | 12 | |
| L22 5 | 223% | 15 | 29 | |
| L22 6 | 162% | 11 | 9 | |
| L22 7 | 39% | 3 | 2 | |
| L22 8 | 260% | 18 | 14 | |
| L22 9 | 143% | 10 | 11 | |
| L23 0 | 50% | 3 | 14 | |
| L23 1 | 158% | 11 | 17 | |
| L23 2 | 165% | 11 | 41 | |
| L23 3 | 81% | 6 | 10 | |
| L23 4 | 224% | 15 | 16 | |
| L23 5 | 160% | 11 | 24 | |
| L23 6 | 82% | 6 | 14 | |
| L23 7 | 39% | 3 | 6 | |
| L23 8 | 24% | 2 | 3 | |
| L23 9 | 97% | 7 | 26 | |
| L24 0 | 245% | 17 | 29 | |
| L24 1 | 137% | 9 | 68 | |
| L24 2 | 181% | 13 | 48 | |
| L24 3 | 69% | 5 | 28 | |
| L24 6 | 216% | 15 | 14 | |
| L24 7 | 246% | 17 | 17 | |
| L24 9 | 117% | 8 | 13 | |
| L25 0 | 126% | 9 | 41 | |
| L25 1 | 43% | 3 | 5 | |
| L25 2 | 353% | 24 | 91 | |
| L25 3 | 87% | 6 | 13 | |
| L25 4 | 51% | 4 | 6 | |
| L25 5 | 214% | 15 | 44 | |
| L25 6 | 54% | 4 | 8 | |
| L25 7 | 108% | 7 | 28 | |
| L25 8 | 66% | 5 | 11 | |
| L25 9 | 90% | 6 | 21 | |
| L26 0 | 371% | 26 | 44 | |
| L26 1 | 118% | 8 | 19 | |
| L26 2 | 436% | 30 | 6 | |
| L26 3 | 59% | 4 | 1 | |
| L26 6 | 87% | 6 | 5 | |
| L26 7 | 73% | 5 | 12 | |
| L26 9 | 61% | 4 | 23 | |
| L27 1 | 177% | 12 | 16 | |
| L27 4 | 140% | 10 | 3 | |
| L27 5 | 20% | 1 | 1 | |
| L27 6 | 165% | 11 | 9 | |
| L27 7 | 134% | 9 | 12 | |
| L27 8 | 126% | 9 | 6 | |
| L28 0 | 131% | 9 | 6 | |
| L28 1 | 312% | 22 | 33 | |
| L28 3 | 295% | 20 | 3 | |
| L28 4 | 142% | 10 | 8 | |
| L28 5 | 151% | 10 | 7 | |
| L28 6 | 462% | 32 | 10 | |
| L28 7 | 484% | 33 | 16 | |
| L28 8 | 166% | 11 | 4 | |
| L29 1 | 1086% | 75 | 3 | |
| L3 1 | 111% | 8 | 31 | |
| L3 2 | 99% | 7 | 34 | |
| L3 3 | 1928% | 133 | 183 | |
| L3 4 | 74% | 5 | 44 | |
| L3 5 | 157% | 11 | 76 | |
| L3 6 | 189% | 13 | 55 | |
| L3 7 | 467% | 32 | 21 | |
| L3 8 | 318% | 22 | 79 | |
| L3 9 | 39% | 3 | 28 | |
| L30 0 | 420% | 29 | 46 | |
| L30 1 | 85% | 6 | 32 | |
| L30 2 | 191% | 13 | 33 | |
| L30 3 | 156% | 11 | 18 | |
| L30 4 | 450% | 31 | 5 | |
| L30 5 | 255% | 18 | 42 | |
| L30 6 | 220% | 15 | 10 | |
| L30 7 | 452% | 31 | 72 | |
| L30 8 | 77% | 5 | 7 | |
| L30 9 | 54% | 4 | 6 | |
| L31 0 | 130% | 9 | 16 | |
| L31 1 | 196% | 14 | 58 | |
| L31 2 | 56% | 4 | 10 | |
| L31 3 | 117% | 8 | 13 | |
| L31 4 | 84% | 6 | 11 | |
| L31 5 | 111% | 8 | 18 | |
| L31 6 | 48% | 3 | 8 | |
| L31 7 | 26% | 2 | 5 | |
| L31 8 | 33% | 2 | 6 | |
| L31 9 | 44% | 3 | 9 | |
| L32 0 | 143% | 10 | 25 | |
| L32 1 | 219% | 15 | 16 | |
| L32 2 | 105% | 7 | 11 | |
| L32 3 | 62% | 4 | 4 | |
| L32 4 | 278% | 19 | 26 | |
| L32 5 | 435% | 30 | 20 | |
| L32 6 | 60% | 4 | 15 | |
| L32 7 | 144% | 10 | 24 | |
| L32 8 | 494% | 34 | 106 | |
| L32 9 | 99% | 7 | 17 | |
| L33 0 | 213% | 15 | 19 | |
| L33 1 | 185% | 13 | 43 | |
| L33 2 | 54% | 4 | 3 | |
| L33 3 | 62% | 4 | 3 | |
| L33 5 | 30% | 2 | 6 | |
| L33 6 | 82% | 6 | 14 | |
| L33 7 | 58% | 4 | 6 | |
| L33 8 | 151% | 10 | 9 | |
| L33 9 | 179% | 12 | 27 | |
| L34 0 | 89% | 6 | 20 | |
| L34 1 | 168% | 12 | 37 | |
| L34 2 | 68% | 5 | 12 | |
| L34 3 | 237% | 16 | 14 | |
| L34 4 | 53% | 4 | 2 | |
| L34 5 | 572% | 40 | 101 | |
| L34 6 | 154% | 11 | 17 | |
| L34 8 | 14% | 1 | 1 | |
| L34 9 | 22% | 2 | 2 | |
| L35 0 | 130% | 9 | 21 | |
| L35 1 | 82% | 6 | 11 | |
| L35 2 | 72% | 5 | 21 | |
| L35 3 | 145% | 10 | 63 | |
| L35 4 | 103% | 7 | 16 | |
| L35 5 | 344% | 24 | 83 | |
| L35 6 | 153% | 11 | 15 | |
| L35 7 | 47% | 3 | 6 | |
| L35 8 | 24% | 2 | 8 | |
| L35 9 | 130% | 9 | 10 | |
| L36 0 | 93% | 6 | 26 | |
| L36 1 | 71% | 5 | 10 | |
| L36 2 | 202% | 14 | 54 | |
| L36 3 | 265% | 18 | 69 | |
| L36 4 | 55% | 4 | 16 | |
| L36 5 | 64% | 4 | 19 | |
| L36 6 | 170% | 12 | 37 | |
| L36 7 | 183% | 13 | 48 | |
| L36 8 | 174% | 12 | 45 | |
| L36 9 | 123% | 9 | 27 | |
| L37 0 | 163% | 11 | 4 | |
| L37 1 | 61% | 4 | 9 | |
| L37 2 | 72% | 5 | 18 | |
| L37 3 | 65% | 4 | 18 | |
| L37 4 | 89% | 6 | 19 | |
| L37 6 | 64% | 4 | 11 | |
| L37 7 | 55% | 4 | 11 | |
| L37 8 | 69% | 5 | 7 | |
| L38 0 | 37% | 3 | 1 | |
| L38 3 | 48% | 3 | 1 | |
| L38 5 | 712% | 49 | 3 | |
| L38 6 | 66% | 5 | 1 | |
| L38 9 | 149% | 10 | 7 | |
| L4 0 | 421% | 29 | 81 | |
| L4 1 | 276% | 19 | 43 | |
| L4 2 | 259% | 18 | 78 | |
| L4 3 | 275% | 19 | 63 | |
| L4 4 | 486% | 34 | 134 | |
| L4 5 | 302% | 21 | 97 | |
| L4 6 | 198% | 14 | 33 | |
| L4 7 | 87% | 6 | 15 | |
| L4 8 | 193% | 13 | 30 | |
| L4 9 | 195% | 14 | 61 | |
| L5 0 | 160% | 11 | 17 | |
| L5 1 | 177% | 12 | 7 | |
| L5 2 | 250% | 17 | 21 | |
| L5 3 | 187% | 13 | 21 | |
| L5 4 | 170% | 12 | 16 | |
| L5 5 | 544% | 38 | 61 | |
| L5 6 | 329% | 23 | 48 | |
| L5 7 | 149% | 10 | 16 | |
| L5 8 | 309% | 21 | 35 | |
| L5 9 | 161% | 11 | 33 | |
| L6 0 | 308% | 21 | 43 | |
| L6 1 | 250% | 17 | 43 | |
| L6 2 | 150% | 10 | 22 | |
| L6 3 | 277% | 19 | 31 | |
| L6 4 | 236% | 16 | 59 | |
| L6 5 | 233% | 16 | 44 | |
| L6 6 | 262% | 18 | 44 | |
| L6 7 | 664% | 46 | 36 | |
| L6 8 | 302% | 21 | 26 | |
| L6 9 | 192% | 13 | 18 | |
| L7 0 | 277% | 19 | 91 | |
| L7 1 | 108% | 7 | 6 | |
| L7 2 | 204% | 14 | 24 | |
| L7 3 | 150% | 10 | 35 | |
| L7 4 | 133% | 9 | 4 | |
| L7 5 | 416% | 29 | 21 | |
| L7 6 | 121% | 8 | 15 | |
| L7 7 | 98% | 7 | 27 | |
| L7 8 | 131% | 9 | 82 | |
| L7 9 | 200% | 14 | 23 | |
| L8 0 | 262% | 18 | 104 | |
| L8 1 | 197% | 14 | 19 | |
| L8 2 | 155% | 11 | 21 | |
| L8 3 | 252% | 17 | 45 | |
| L8 4 | 147% | 10 | 32 | |
| L8 5 | 221% | 15 | 25 | |
| L8 6 | 156% | 11 | 35 | |
| L8 7 | 145% | 10 | 51 | |
| L8 8 | 259% | 18 | 67 | |
| L8 9 | 231% | 16 | 35 | |
| L9 0 | 128% | 9 | 32 | |
| L9 1 | 284% | 20 | 129 | |
| L9 2 | 133% | 9 | 21 | |
| L9 3 | 135% | 9 | 31 | |
| L9 4 | 420% | 29 | 36 | |
| L9 5 | 577% | 40 | 27 | |
| L9 6 | 135% | 9 | 35 | |
| L9 7 | 228% | 16 | 67 | |
| L9 8 | 105% | 7 | 27 | |
| L9 9 | 77% | 5 | 35 | |
| PR8 1 | 376% | 26 | 189 | |
| PR8 2 | 53% | 4 | 30 | |
| PR8 3 | 117% | 8 | 75 | |
| PR8 4 | 83% | 6 | 49 | |
| PR8 6 | 100% | 7 | 87 | |
| PR9 0 | 291% | 20 | 214 | |
| PR9 7 | 83% | 6 | 53 | |
| PR9 9 | 99% | 7 | 81 | |
| WA10 1 | 390% | 27 | 212 | |
| WA10 2 | 319% | 22 | 156 | |
| WA10 3 | 138% | 10 | 97 | |
| WA10 4 | 178% | 12 | 71 | |
| WA10 5 | 76% | 5 | 23 | |
| WA10 6 | 103% | 7 | 41 | |
| WA11 0 | 85% | 6 | 78 | |
| WA11 7 | 163% | 11 | 66 | |
| WA11 8 | 46% | 3 | 17 | |
| WA11 9 | 92% | 6 | 73 | |
| WA12 0 | 78% | 5 | 25 | |
| WA12 8 | 182% | 13 | 68 | |
| WA12 9 | 190% | 13 | 120 | |
| WA8 3 | 74% | 5 | 25 | |
| WA8 4 | 195% | 14 | 62 | |
| WA8 5 | 154% | 11 | 20 | |
| WA9 1 | 314% | 22 | 162 | |
| WA9 2 | 254% | 18 | 94 | |
| WA9 3 | 162% | 11 | 125 | |
| WA9 4 | 138% | 10 | 104 | |
| WA9 5 | 140% | 10 | 114 | |
| WN4 0 | 14% | 1 | 7 | |
| WN5 7 | 52% | 4 | 28 | |
Crime rate ranking : Merseyside county has the 3. highest crime rate out of 54 counties
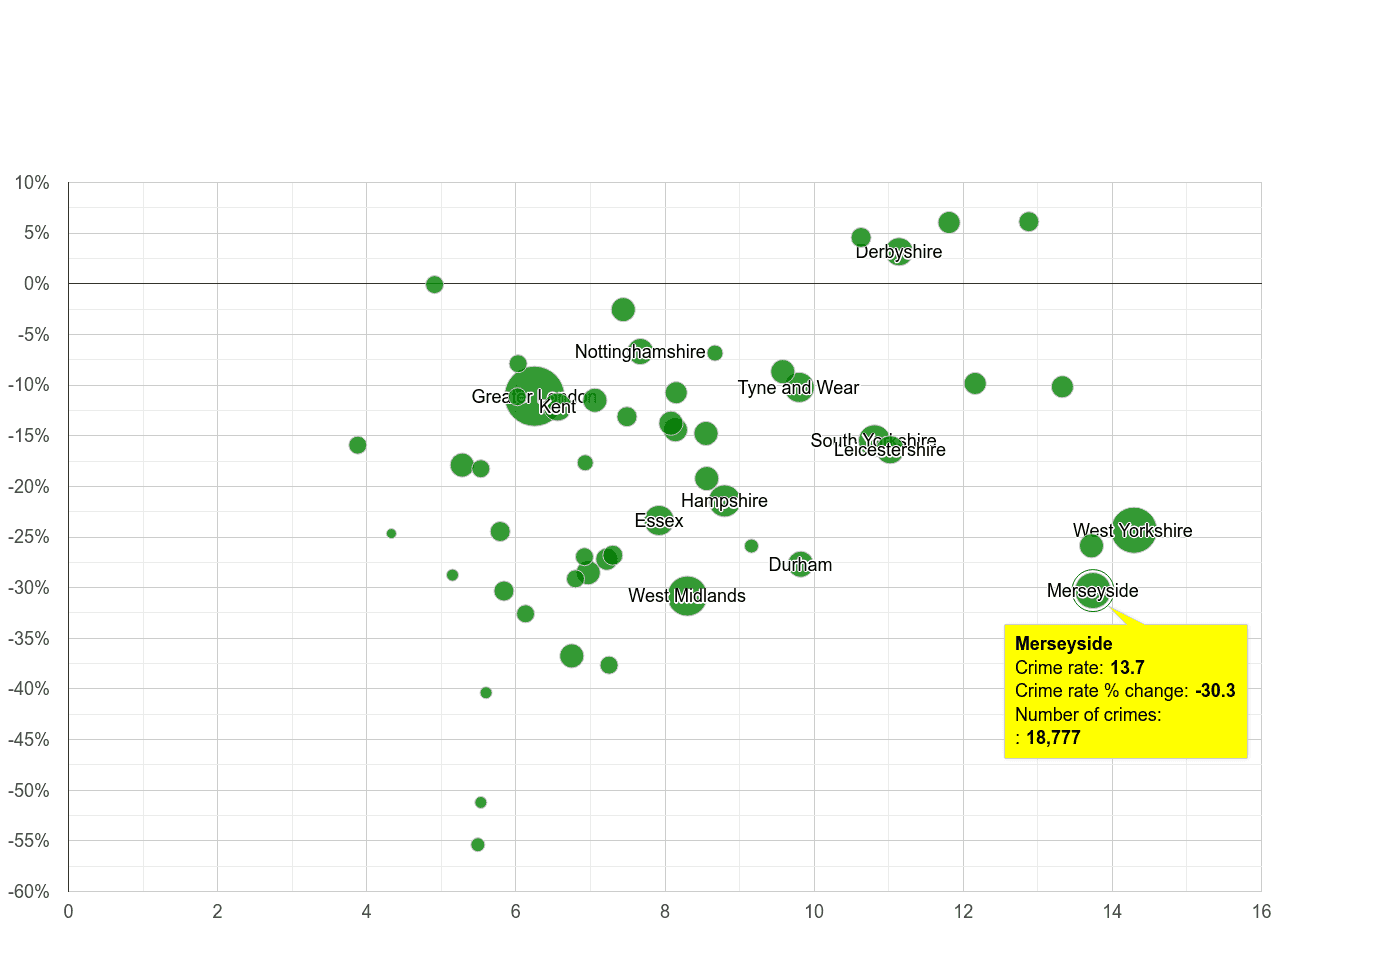
Public order crime totalled 15.3k representing a decrease 2.1% year-over-year. In the graph below, county are compared by crime rate and crime rate percentage change. Crime rate percentage change compares the county crime rate between May 2025 - April 2026 to the county crime rate in the previous 12 months. The size of the circle reflects the number of total crimes reported. The bigger the circle, the higher the number of crimes reported in the county.
-2.1% annual change, crime is declining
15.3k crimes reported
 Crime rate percentage change
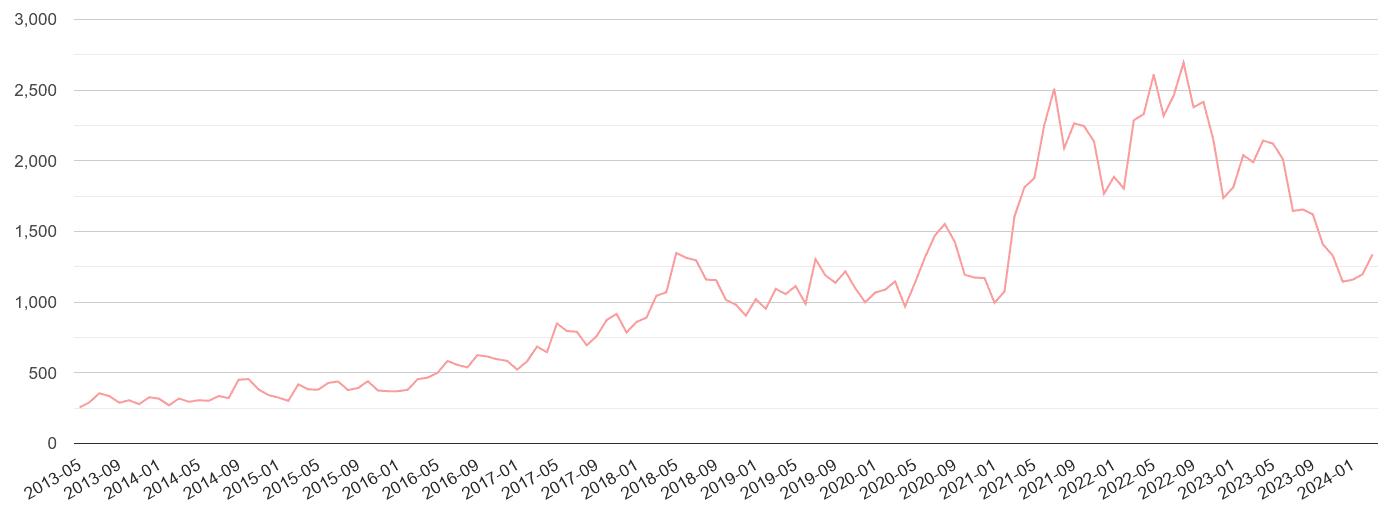
Number of crime incidents by month from January 2014 to April 2026.
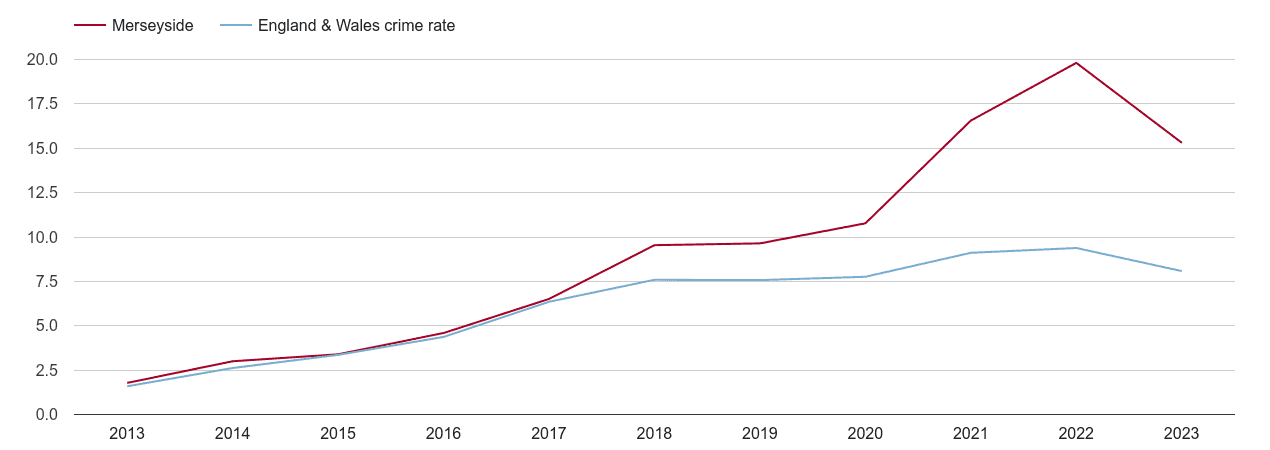
Crime rate per 1000 workday people compared to the national crime rate by year.
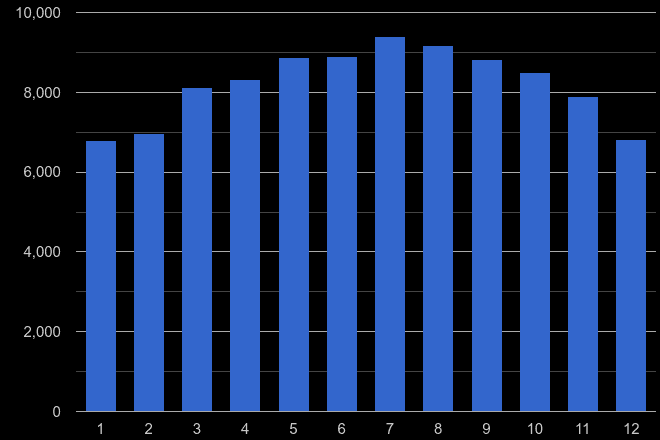
Total number of crimes reported in a given calendar month (1 = January … 12 = December) in the previous five years, i.e. from 2020 till 2024.

For details, click on the crime name with '→'
 login →


