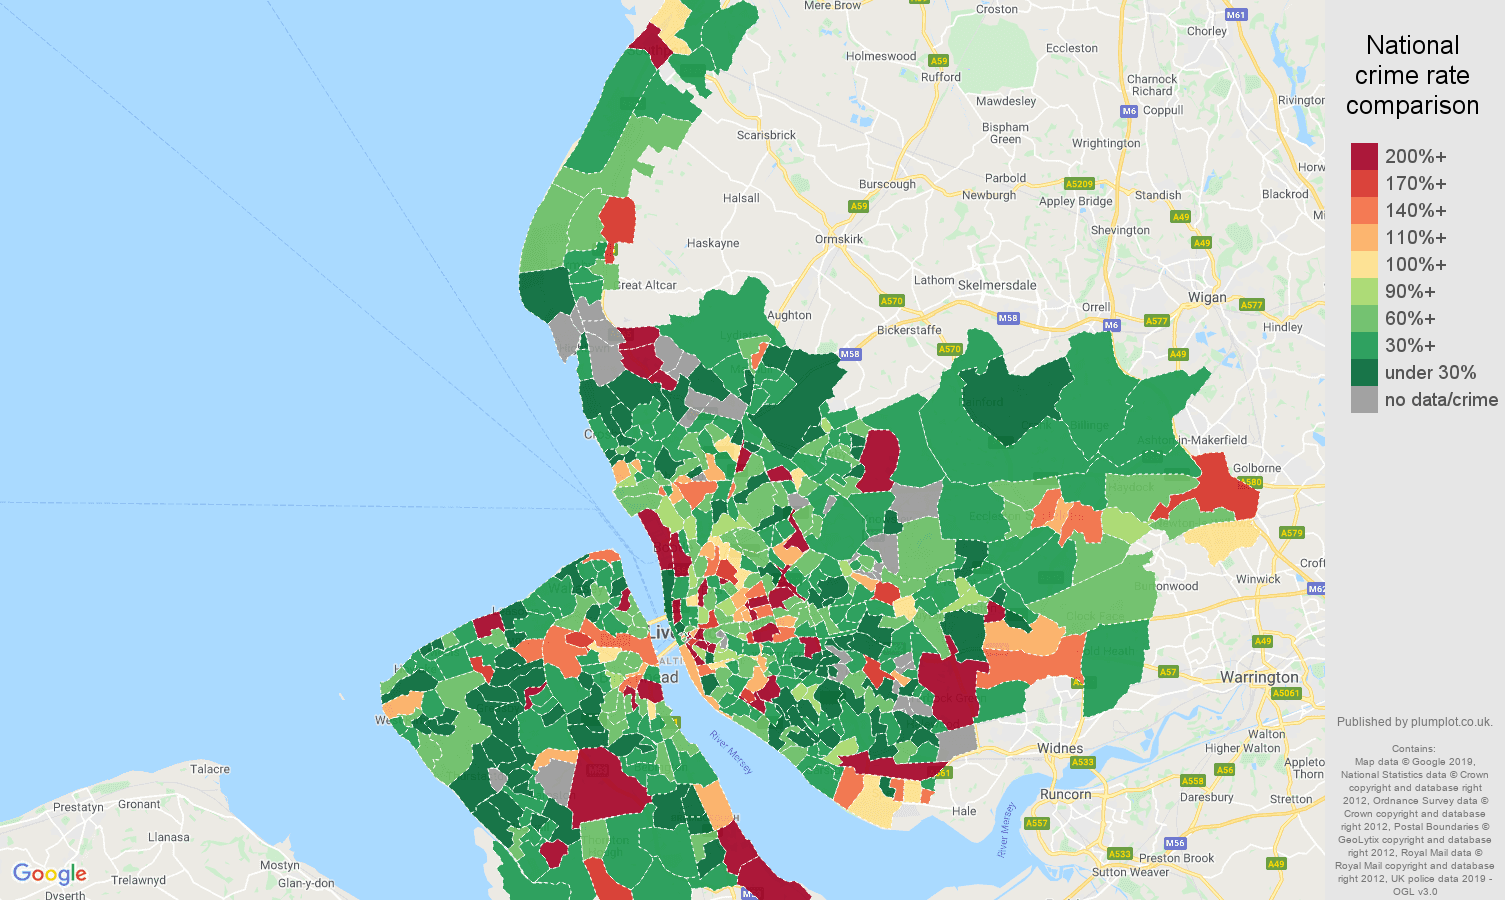
As of June 2026, the annual crime rate in Merseyside county stands at 5.8 crimes per 1000 people. Merseyside's current crime levels are at 88% of the national crime rate. Other theft crime makes up 5.2% of all crimes reported in the county. Other theft crime totalled 8.0k representing a decrease 5.2% year-over-year.
| Merseyside county | crime statistic | England & Wales |
|---|---|---|
| 5.8 | annual crime rate per 1k workday people | 6.6 |
| 88% | ratio of national crime rate | 100% |
| 5.2% | share of all crimes | 6.6% |
| 8.0k | crimes reported | 371k |
| -5.2% | annual change | -5.8% |
| Postcode sector | Crime rate vs. ENG & WLS rate | Crime rate per 1000 workday people | Total number of crimes | |
|---|---|---|---|---|
| CH41 0 | 81% | 5 | 15 | |
| CH41 1 | 195% | 13 | 21 | |
| CH41 2 | 216% | 14 | 57 | |
| CH41 3 | 158% | 10 | 22 | |
| CH41 4 | 89% | 6 | 29 | |
| CH41 5 | 30% | 2 | 9 | |
| CH41 6 | 177% | 12 | 52 | |
| CH41 7 | 77% | 5 | 16 | |
| CH41 8 | 88% | 6 | 20 | |
| CH41 9 | 84% | 6 | 20 | |
| CH42 0 | 149% | 10 | 23 | |
| CH42 1 | 99% | 7 | 20 | |
| CH42 2 | 167% | 11 | 22 | |
| CH42 3 | 69% | 5 | 9 | |
| CH42 4 | 101% | 7 | 22 | |
| CH42 5 | 96% | 6 | 15 | |
| CH42 6 | 112% | 7 | 20 | |
| CH42 7 | 103% | 7 | 12 | |
| CH42 8 | 48% | 3 | 6 | |
| CH42 9 | 63% | 4 | 14 | |
| CH43 0 | 38% | 3 | 8 | |
| CH43 1 | 85% | 6 | 14 | |
| CH43 2 | 11% | 1 | 2 | |
| CH43 3 | 42% | 3 | 9 | |
| CH43 4 | 114% | 8 | 19 | |
| CH43 5 | 110% | 7 | 17 | |
| CH43 6 | 23% | 2 | 2 | |
| CH43 7 | 59% | 4 | 20 | |
| CH43 8 | 25% | 2 | 2 | |
| CH43 9 | 57% | 4 | 21 | |
| CH44 0 | 79% | 5 | 12 | |
| CH44 1 | 42% | 3 | 6 | |
| CH44 2 | 119% | 8 | 17 | |
| CH44 3 | 32% | 2 | 4 | |
| CH44 4 | 35% | 2 | 9 | |
| CH44 5 | 97% | 6 | 23 | |
| CH44 6 | 91% | 6 | 17 | |
| CH44 7 | 103% | 7 | 20 | |
| CH44 8 | 93% | 6 | 14 | |
| CH44 9 | 93% | 6 | 16 | |
| CH45 0 | 12% | 1 | 1 | |
| CH45 1 | 63% | 4 | 9 | |
| CH45 2 | 103% | 7 | 13 | |
| CH45 3 | 30% | 2 | 5 | |
| CH45 4 | 54% | 4 | 13 | |
| CH45 5 | 62% | 4 | 14 | |
| CH45 6 | 39% | 3 | 4 | |
| CH45 7 | 39% | 3 | 8 | |
| CH45 8 | 49% | 3 | 10 | |
| CH45 9 | 45% | 3 | 4 | |
| CH46 0 | 34% | 2 | 7 | |
| CH46 1 | 17% | 1 | 3 | |
| CH46 2 | 67% | 4 | 9 | |
| CH46 3 | 63% | 4 | 5 | |
| CH46 5 | 148% | 10 | 4 | |
| CH46 6 | 33% | 2 | 8 | |
| CH46 7 | 88% | 6 | 14 | |
| CH46 8 | 52% | 3 | 11 | |
| CH46 9 | 61% | 4 | 9 | |
| CH47 0 | 17% | 1 | 1 | |
| CH47 2 | 23% | 2 | 3 | |
| CH47 3 | 113% | 8 | 14 | |
| CH47 4 | 14% | 1 | 1 | |
| CH47 5 | 18% | 1 | 1 | |
| CH47 6 | 68% | 5 | 3 | |
| CH47 8 | 59% | 4 | 1 | |
| CH47 9 | 21% | 1 | 1 | |
| CH48 0 | 54% | 4 | 5 | |
| CH48 1 | 24% | 2 | 2 | |
| CH48 2 | 17% | 1 | 1 | |
| CH48 3 | 46% | 3 | 4 | |
| CH48 4 | 70% | 5 | 8 | |
| CH48 5 | 21% | 1 | 3 | |
| CH48 6 | 18% | 1 | 2 | |
| CH48 7 | 21% | 1 | 1 | |
| CH48 8 | 31% | 2 | 2 | |
| CH48 9 | 12% | 1 | 1 | |
| CH49 0 | 37% | 2 | 5 | |
| CH49 1 | 60% | 4 | 6 | |
| CH49 2 | 56% | 4 | 9 | |
| CH49 3 | 12% | 1 | 2 | |
| CH49 4 | 33% | 2 | 8 | |
| CH49 5 | 87% | 6 | 34 | |
| CH49 6 | 54% | 4 | 9 | |
| CH49 7 | 24% | 2 | 4 | |
| CH49 8 | 73% | 5 | 10 | |
| CH49 9 | 75% | 5 | 9 | |
| CH60 0 | 68% | 4 | 6 | |
| CH60 2 | 15% | 1 | 1 | |
| CH60 3 | 17% | 1 | 1 | |
| CH60 4 | 29% | 2 | 2 | |
| CH60 5 | 26% | 2 | 3 | |
| CH60 7 | 28% | 2 | 3 | |
| CH61 0 | 65% | 4 | 2 | |
| CH61 1 | 65% | 4 | 5 | |
| CH61 2 | 91% | 6 | 3 | |
| CH61 3 | 49% | 3 | 4 | |
| CH61 4 | 81% | 5 | 9 | |
| CH61 5 | 30% | 2 | 3 | |
| CH61 6 | 59% | 4 | 7 | |
| CH61 7 | 100% | 7 | 8 | |
| CH61 8 | 19% | 1 | 2 | |
| CH61 9 | 60% | 4 | 6 | |
| CH62 0 | 49% | 3 | 5 | |
| CH62 1 | 66% | 4 | 10 | |
| CH62 2 | 44% | 3 | 7 | |
| CH62 3 | 184% | 12 | 29 | |
| CH62 4 | 81% | 5 | 21 | |
| CH62 5 | 101% | 7 | 18 | |
| CH62 6 | 43% | 3 | 7 | |
| CH62 7 | 21% | 1 | 10 | |
| CH62 8 | 34% | 2 | 8 | |
| CH62 9 | 67% | 4 | 11 | |
| CH63 0 | 26% | 2 | 5 | |
| CH63 1 | 27% | 2 | 1 | |
| CH63 2 | 23% | 2 | 5 | |
| CH63 3 | 17% | 1 | 5 | |
| CH63 4 | 19% | 1 | 2 | |
| CH63 5 | 15% | 1 | 3 | |
| CH63 6 | 87% | 6 | 2 | |
| CH63 7 | 44% | 3 | 10 | |
| CH63 8 | 73% | 5 | 11 | |
| CH63 9 | 21% | 1 | 6 | |
| CH64 1 | 27% | 2 | 2 | |
| CH64 3 | 59% | 4 | 8 | |
| CH64 6 | 49% | 3 | 7 | |
| CH64 7 | 19% | 1 | 1 | |
| L1 0 | 12064% | 800 | 20 | |
| L1 1 | 770% | 51 | 218 | |
| L1 2 | 195% | 13 | 21 | |
| L1 3 | 143% | 9 | 41 | |
| L1 4 | 823% | 55 | 295 | |
| L1 5 | 135% | 9 | 35 | |
| L1 6 | 337% | 22 | 102 | |
| L1 7 | 94% | 6 | 6 | |
| L1 8 | 205% | 14 | 27 | |
| L1 9 | 227% | 15 | 34 | |
| L10 0 | 168% | 11 | 6 | |
| L10 1 | 41% | 3 | 8 | |
| L10 2 | 22% | 1 | 2 | |
| L10 3 | 64% | 4 | 4 | |
| L10 4 | 25% | 2 | 4 | |
| L10 6 | 69% | 5 | 4 | |
| L10 7 | 81% | 5 | 8 | |
| L10 8 | 16% | 1 | 2 | |
| L10 9 | 36% | 2 | 3 | |
| L11 0 | 61% | 4 | 8 | |
| L11 1 | 174% | 12 | 31 | |
| L11 2 | 224% | 15 | 47 | |
| L11 3 | 90% | 6 | 18 | |
| L11 4 | 84% | 6 | 12 | |
| L11 5 | 34% | 2 | 3 | |
| L11 6 | 37% | 2 | 2 | |
| L11 7 | 36% | 2 | 6 | |
| L11 8 | 52% | 3 | 5 | |
| L11 9 | 90% | 6 | 12 | |
| L12 0 | 34% | 2 | 13 | |
| L12 1 | 15% | 1 | 1 | |
| L12 2 | 65% | 4 | 7 | |
| L12 3 | 10% | 1 | 1 | |
| L12 4 | 96% | 6 | 13 | |
| L12 5 | 62% | 4 | 10 | |
| L12 6 | 125% | 8 | 11 | |
| L12 7 | 124% | 8 | 16 | |
| L12 8 | 20% | 1 | 3 | |
| L12 9 | 77% | 5 | 17 | |
| L13 0 | 54% | 4 | 6 | |
| L13 1 | 217% | 14 | 33 | |
| L13 2 | 145% | 10 | 26 | |
| L13 3 | 56% | 4 | 14 | |
| L13 4 | 79% | 5 | 16 | |
| L13 5 | 82% | 5 | 23 | |
| L13 6 | 86% | 6 | 15 | |
| L13 7 | 96% | 6 | 22 | |
| L13 8 | 73% | 5 | 13 | |
| L13 9 | 57% | 4 | 8 | |
| L14 0 | 77% | 5 | 19 | |
| L14 1 | 19% | 1 | 2 | |
| L14 2 | 53% | 4 | 8 | |
| L14 3 | 75% | 5 | 13 | |
| L14 4 | 94% | 6 | 9 | |
| L14 5 | 45% | 3 | 10 | |
| L14 6 | 26% | 2 | 3 | |
| L14 7 | 120% | 8 | 18 | |
| L14 8 | 138% | 9 | 17 | |
| L14 9 | 104% | 7 | 21 | |
| L15 0 | 176% | 12 | 28 | |
| L15 1 | 156% | 10 | 21 | |
| L15 2 | 67% | 4 | 8 | |
| L15 3 | 61% | 4 | 15 | |
| L15 4 | 84% | 6 | 25 | |
| L15 5 | 100% | 7 | 12 | |
| L15 6 | 41% | 3 | 7 | |
| L15 7 | 46% | 3 | 6 | |
| L15 8 | 120% | 8 | 23 | |
| L15 9 | 41% | 3 | 3 | |
| L16 1 | 60% | 4 | 3 | |
| L16 2 | 42% | 3 | 4 | |
| L16 3 | 33% | 2 | 3 | |
| L16 4 | 46% | 3 | 2 | |
| L16 5 | 50% | 3 | 3 | |
| L16 6 | 71% | 5 | 3 | |
| L16 8 | 57% | 4 | 3 | |
| L16 9 | 16% | 1 | 3 | |
| L17 0 | 39% | 3 | 7 | |
| L17 1 | 131% | 9 | 10 | |
| L17 2 | 61% | 4 | 6 | |
| L17 3 | 183% | 12 | 21 | |
| L17 4 | 351% | 23 | 27 | |
| L17 5 | 62% | 4 | 4 | |
| L17 6 | 26% | 2 | 4 | |
| L17 7 | 68% | 5 | 14 | |
| L17 8 | 271% | 18 | 36 | |
| L17 9 | 87% | 6 | 9 | |
| L18 0 | 17% | 1 | 1 | |
| L18 1 | 53% | 4 | 16 | |
| L18 2 | 32% | 2 | 3 | |
| L18 3 | 37% | 2 | 6 | |
| L18 4 | 41% | 3 | 4 | |
| L18 5 | 48% | 3 | 7 | |
| L18 6 | 57% | 4 | 8 | |
| L18 7 | 32% | 2 | 4 | |
| L18 8 | 68% | 5 | 14 | |
| L18 9 | 88% | 6 | 14 | |
| L19 0 | 82% | 5 | 11 | |
| L19 1 | 42% | 3 | 4 | |
| L19 2 | 62% | 4 | 28 | |
| L19 3 | 30% | 2 | 3 | |
| L19 4 | 68% | 5 | 10 | |
| L19 5 | 77% | 5 | 7 | |
| L19 6 | 172% | 11 | 11 | |
| L19 7 | 21% | 1 | 1 | |
| L19 8 | 57% | 4 | 10 | |
| L19 9 | 62% | 4 | 10 | |
| L2 0 | 66% | 4 | 11 | |
| L2 2 | 124% | 8 | 27 | |
| L2 3 | 114% | 8 | 8 | |
| L2 4 | 46% | 3 | 10 | |
| L2 5 | 182% | 12 | 18 | |
| L2 6 | 511% | 34 | 81 | |
| L2 7 | 81% | 5 | 13 | |
| L2 8 | 22% | 1 | 1 | |
| L2 9 | 209% | 14 | 8 | |
| L20 0 | 62% | 4 | 10 | |
| L20 1 | 1832% | 121 | 13 | |
| L20 2 | 128% | 8 | 22 | |
| L20 3 | 119% | 8 | 35 | |
| L20 4 | 149% | 10 | 79 | |
| L20 5 | 91% | 6 | 15 | |
| L20 6 | 48% | 3 | 18 | |
| L20 7 | 77% | 5 | 27 | |
| L20 8 | 247% | 16 | 22 | |
| L20 9 | 58% | 4 | 20 | |
| L21 0 | 65% | 4 | 14 | |
| L21 1 | 137% | 9 | 28 | |
| L21 2 | 132% | 9 | 8 | |
| L21 3 | 188% | 12 | 6 | |
| L21 4 | 155% | 10 | 13 | |
| L21 5 | 54% | 4 | 4 | |
| L21 6 | 100% | 7 | 5 | |
| L21 7 | 84% | 6 | 15 | |
| L21 8 | 80% | 5 | 16 | |
| L21 9 | 62% | 4 | 14 | |
| L22 0 | 56% | 4 | 6 | |
| L22 1 | 63% | 4 | 4 | |
| L22 2 | 58% | 4 | 4 | |
| L22 3 | 34% | 2 | 4 | |
| L22 4 | 22% | 1 | 2 | |
| L22 5 | 120% | 8 | 15 | |
| L22 6 | 56% | 4 | 3 | |
| L22 7 | 20% | 1 | 1 | |
| L22 8 | 39% | 3 | 2 | |
| L22 9 | 41% | 3 | 3 | |
| L23 0 | 45% | 3 | 12 | |
| L23 1 | 174% | 12 | 18 | |
| L23 2 | 38% | 3 | 9 | |
| L23 3 | 59% | 4 | 7 | |
| L23 4 | 73% | 5 | 5 | |
| L23 5 | 28% | 2 | 4 | |
| L23 6 | 55% | 4 | 9 | |
| L23 7 | 54% | 4 | 8 | |
| L23 8 | 25% | 2 | 3 | |
| L23 9 | 51% | 3 | 13 | |
| L24 0 | 141% | 9 | 16 | |
| L24 1 | 122% | 8 | 58 | |
| L24 2 | 79% | 5 | 20 | |
| L24 3 | 18% | 1 | 7 | |
| L24 6 | 32% | 2 | 2 | |
| L24 7 | 181% | 12 | 12 | |
| L24 9 | 84% | 6 | 9 | |
| L25 0 | 45% | 3 | 14 | |
| L25 1 | 36% | 2 | 4 | |
| L25 2 | 141% | 9 | 35 | |
| L25 3 | 70% | 5 | 10 | |
| L25 4 | 63% | 4 | 7 | |
| L25 5 | 111% | 7 | 22 | |
| L25 6 | 21% | 1 | 3 | |
| L25 7 | 68% | 5 | 17 | |
| L25 8 | 50% | 3 | 8 | |
| L25 9 | 54% | 4 | 12 | |
| L26 0 | 79% | 5 | 9 | |
| L26 1 | 84% | 6 | 13 | |
| L26 2 | 227% | 15 | 3 | |
| L26 3 | 244% | 16 | 4 | |
| L26 6 | 36% | 2 | 2 | |
| L26 7 | 25% | 2 | 4 | |
| L26 9 | 42% | 3 | 15 | |
| L27 0 | 302% | 20 | 1 | |
| L27 1 | 81% | 5 | 7 | |
| L27 4 | 48% | 3 | 1 | |
| L27 5 | 21% | 1 | 1 | |
| L27 6 | 38% | 3 | 2 | |
| L27 7 | 58% | 4 | 5 | |
| L27 8 | 109% | 7 | 5 | |
| L28 0 | 68% | 5 | 3 | |
| L28 1 | 99% | 7 | 10 | |
| L28 3 | 103% | 7 | 1 | |
| L28 4 | 74% | 5 | 4 | |
| L28 5 | 292% | 19 | 13 | |
| L28 6 | 241% | 16 | 5 | |
| L28 7 | 31% | 2 | 1 | |
| L29 7 | 34% | 2 | 1 | |
| L29 9 | 90% | 6 | 1 | |
| L3 0 | 169% | 11 | 6 | |
| L3 1 | 48% | 3 | 13 | |
| L3 2 | 52% | 3 | 17 | |
| L3 3 | 428% | 28 | 39 | |
| L3 4 | 62% | 4 | 35 | |
| L3 5 | 112% | 7 | 52 | |
| L3 6 | 122% | 8 | 34 | |
| L3 7 | 440% | 29 | 19 | |
| L3 8 | 201% | 13 | 48 | |
| L3 9 | 28% | 2 | 19 | |
| L30 0 | 143% | 9 | 15 | |
| L30 1 | 58% | 4 | 21 | |
| L30 2 | 102% | 7 | 17 | |
| L30 3 | 63% | 4 | 7 | |
| L30 4 | 562% | 37 | 6 | |
| L30 5 | 63% | 4 | 10 | |
| L30 6 | 664% | 44 | 29 | |
| L30 7 | 65% | 4 | 10 | |
| L30 8 | 11% | 1 | 1 | |
| L30 9 | 28% | 2 | 3 | |
| L31 0 | 25% | 2 | 3 | |
| L31 1 | 98% | 7 | 28 | |
| L31 2 | 29% | 2 | 5 | |
| L31 3 | 28% | 2 | 3 | |
| L31 4 | 8% | 1 | 1 | |
| L31 5 | 26% | 2 | 4 | |
| L31 6 | 82% | 5 | 13 | |
| L31 7 | 22% | 1 | 4 | |
| L31 8 | 23% | 2 | 4 | |
| L31 9 | 36% | 2 | 7 | |
| L32 0 | 71% | 5 | 12 | |
| L32 1 | 100% | 7 | 7 | |
| L32 2 | 139% | 9 | 14 | |
| L32 3 | 65% | 4 | 4 | |
| L32 4 | 100% | 7 | 9 | |
| L32 5 | 68% | 5 | 3 | |
| L32 6 | 29% | 2 | 7 | |
| L32 7 | 94% | 6 | 15 | |
| L32 8 | 398% | 26 | 82 | |
| L32 9 | 73% | 5 | 12 | |
| L33 0 | 82% | 5 | 7 | |
| L33 1 | 107% | 7 | 24 | |
| L33 2 | 94% | 6 | 5 | |
| L33 3 | 87% | 6 | 4 | |
| L33 5 | 52% | 3 | 10 | |
| L33 6 | 67% | 4 | 11 | |
| L33 7 | 120% | 8 | 12 | |
| L33 8 | 87% | 6 | 5 | |
| L33 9 | 83% | 5 | 12 | |
| L34 0 | 19% | 1 | 4 | |
| L34 1 | 57% | 4 | 12 | |
| L34 2 | 41% | 3 | 7 | |
| L34 3 | 106% | 7 | 6 | |
| L34 5 | 183% | 12 | 31 | |
| L34 6 | 66% | 4 | 7 | |
| L34 9 | 12% | 1 | 1 | |
| L35 0 | 19% | 1 | 3 | |
| L35 1 | 62% | 4 | 8 | |
| L35 2 | 25% | 2 | 7 | |
| L35 3 | 43% | 3 | 18 | |
| L35 4 | 20% | 1 | 3 | |
| L35 5 | 99% | 7 | 23 | |
| L35 6 | 85% | 6 | 8 | |
| L35 7 | 16% | 1 | 2 | |
| L35 8 | 19% | 1 | 6 | |
| L35 9 | 27% | 2 | 2 | |
| L36 0 | 48% | 3 | 13 | |
| L36 1 | 29% | 2 | 4 | |
| L36 2 | 66% | 4 | 17 | |
| L36 3 | 92% | 6 | 23 | |
| L36 4 | 54% | 4 | 15 | |
| L36 5 | 46% | 3 | 13 | |
| L36 6 | 62% | 4 | 13 | |
| L36 7 | 52% | 3 | 13 | |
| L36 8 | 266% | 18 | 66 | |
| L36 9 | 76% | 5 | 16 | |
| L37 0 | 170% | 11 | 4 | |
| L37 1 | 50% | 3 | 7 | |
| L37 2 | 37% | 2 | 9 | |
| L37 3 | 45% | 3 | 12 | |
| L37 4 | 44% | 3 | 9 | |
| L37 6 | 48% | 3 | 8 | |
| L37 7 | 37% | 2 | 7 | |
| L37 8 | 62% | 4 | 6 | |
| L38 0 | 116% | 8 | 3 | |
| L38 1 | 172% | 11 | 2 | |
| L4 0 | 411% | 27 | 76 | |
| L4 1 | 107% | 7 | 16 | |
| L4 2 | 118% | 8 | 34 | |
| L4 3 | 109% | 7 | 24 | |
| L4 4 | 230% | 15 | 61 | |
| L4 5 | 130% | 9 | 40 | |
| L4 6 | 81% | 5 | 13 | |
| L4 7 | 108% | 7 | 18 | |
| L4 8 | 60% | 4 | 9 | |
| L4 9 | 87% | 6 | 26 | |
| L5 0 | 59% | 4 | 6 | |
| L5 1 | 211% | 14 | 8 | |
| L5 2 | 74% | 5 | 6 | |
| L5 3 | 149% | 10 | 16 | |
| L5 4 | 33% | 2 | 3 | |
| L5 5 | 437% | 29 | 47 | |
| L5 6 | 150% | 10 | 21 | |
| L5 7 | 174% | 12 | 18 | |
| L5 8 | 156% | 10 | 17 | |
| L5 9 | 102% | 7 | 20 | |
| L6 0 | 104% | 7 | 14 | |
| L6 1 | 145% | 10 | 24 | |
| L6 2 | 78% | 5 | 11 | |
| L6 3 | 260% | 17 | 28 | |
| L6 4 | 159% | 11 | 38 | |
| L6 5 | 83% | 5 | 15 | |
| L6 6 | 149% | 10 | 24 | |
| L6 7 | 384% | 25 | 20 | |
| L6 8 | 170% | 11 | 14 | |
| L6 9 | 89% | 6 | 8 | |
| L7 0 | 181% | 12 | 57 | |
| L7 1 | 151% | 10 | 8 | |
| L7 2 | 186% | 12 | 21 | |
| L7 3 | 85% | 6 | 19 | |
| L7 4 | 242% | 16 | 7 | |
| L7 5 | 268% | 18 | 13 | |
| L7 6 | 135% | 9 | 16 | |
| L7 7 | 121% | 8 | 32 | |
| L7 8 | 95% | 6 | 57 | |
| L7 9 | 100% | 7 | 11 | |
| L8 0 | 144% | 10 | 55 | |
| L8 1 | 43% | 3 | 4 | |
| L8 2 | 146% | 10 | 19 | |
| L8 3 | 180% | 12 | 31 | |
| L8 4 | 67% | 4 | 14 | |
| L8 5 | 230% | 15 | 25 | |
| L8 6 | 205% | 14 | 44 | |
| L8 7 | 89% | 6 | 30 | |
| L8 8 | 93% | 6 | 23 | |
| L8 9 | 48% | 3 | 7 | |
| L9 0 | 83% | 6 | 20 | |
| L9 1 | 115% | 8 | 50 | |
| L9 2 | 73% | 5 | 11 | |
| L9 3 | 32% | 2 | 7 | |
| L9 4 | 146% | 10 | 12 | |
| L9 5 | 290% | 19 | 13 | |
| L9 6 | 113% | 7 | 28 | |
| L9 7 | 75% | 5 | 21 | |
| L9 8 | 61% | 4 | 15 | |
| L9 9 | 32% | 2 | 14 | |
| PR8 1 | 153% | 10 | 74 | |
| PR8 2 | 26% | 2 | 14 | |
| PR8 3 | 54% | 4 | 33 | |
| PR8 4 | 56% | 4 | 32 | |
| PR8 6 | 64% | 4 | 54 | |
| PR9 0 | 106% | 7 | 75 | |
| PR9 7 | 58% | 4 | 36 | |
| PR9 9 | 63% | 4 | 49 | |
| WA10 1 | 144% | 10 | 75 | |
| WA10 2 | 109% | 7 | 51 | |
| WA10 3 | 82% | 5 | 55 | |
| WA10 4 | 65% | 4 | 25 | |
| WA10 5 | 62% | 4 | 18 | |
| WA10 6 | 68% | 5 | 26 | |
| WA11 0 | 84% | 6 | 74 | |
| WA11 7 | 113% | 7 | 44 | |
| WA11 8 | 31% | 2 | 11 | |
| WA11 9 | 67% | 4 | 51 | |
| WA12 0 | 46% | 3 | 14 | |
| WA12 8 | 128% | 8 | 46 | |
| WA12 9 | 83% | 5 | 50 | |
| WA8 3 | 83% | 6 | 27 | |
| WA8 4 | 76% | 5 | 23 | |
| WA8 5 | 56% | 4 | 7 | |
| WA9 1 | 158% | 10 | 78 | |
| WA9 2 | 118% | 8 | 42 | |
| WA9 3 | 107% | 7 | 79 | |
| WA9 4 | 40% | 3 | 29 | |
| WA9 5 | 102% | 7 | 80 | |
| WN4 0 | 8% | 1 | 4 | |
| WN5 7 | 37% | 2 | 19 | |
Crime rate ranking : Merseyside county has the 27. lowest crime rate out of 54 counties
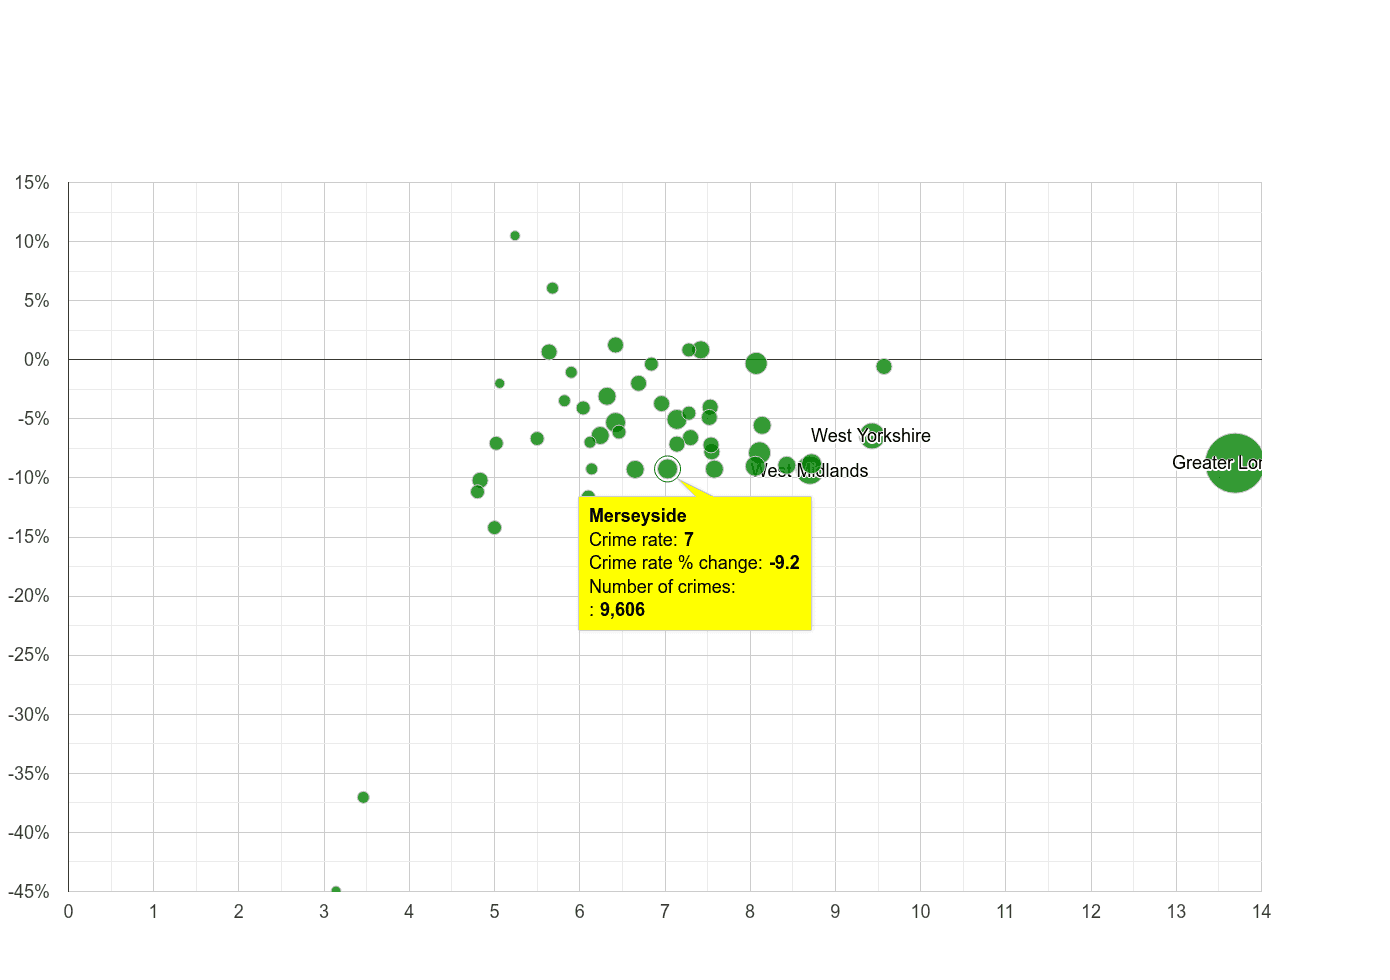
Other theft crime totalled 8.0k representing a decrease 5.2% year-over-year. In the graph below, county are compared by crime rate and crime rate percentage change. Crime rate percentage change compares the county crime rate between June 2025 - May 2026 to the county crime rate in the previous 12 months. The size of the circle reflects the number of total crimes reported. The bigger the circle, the higher the number of crimes reported in the county.
-5.2% annual change, crime is declining
8.0k crimes reported
 Crime rate percentage change
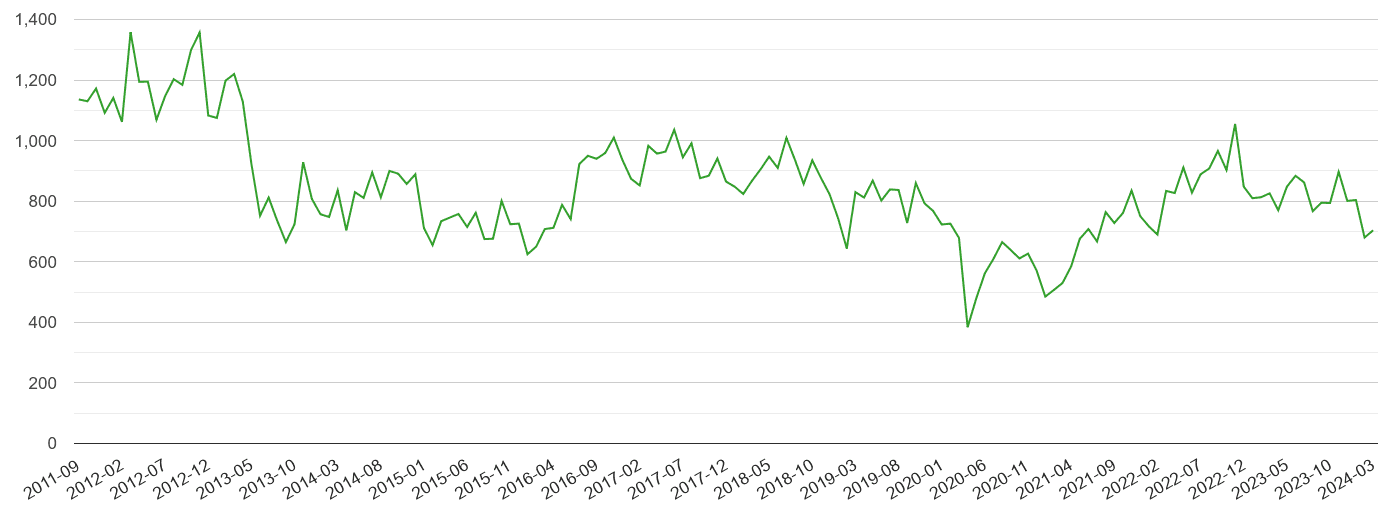
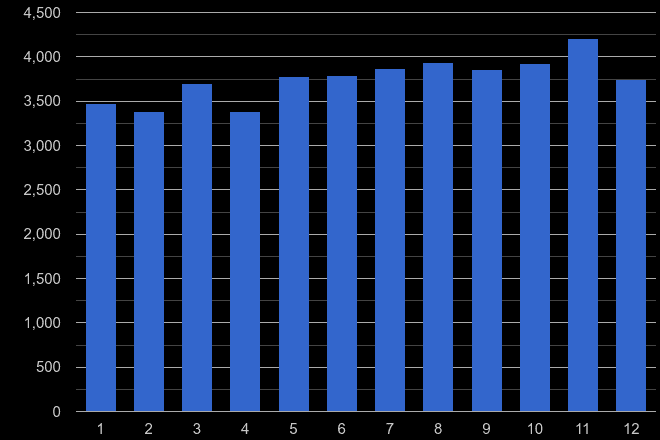
Number of crime incidents by month from January 2014 to May 2026.
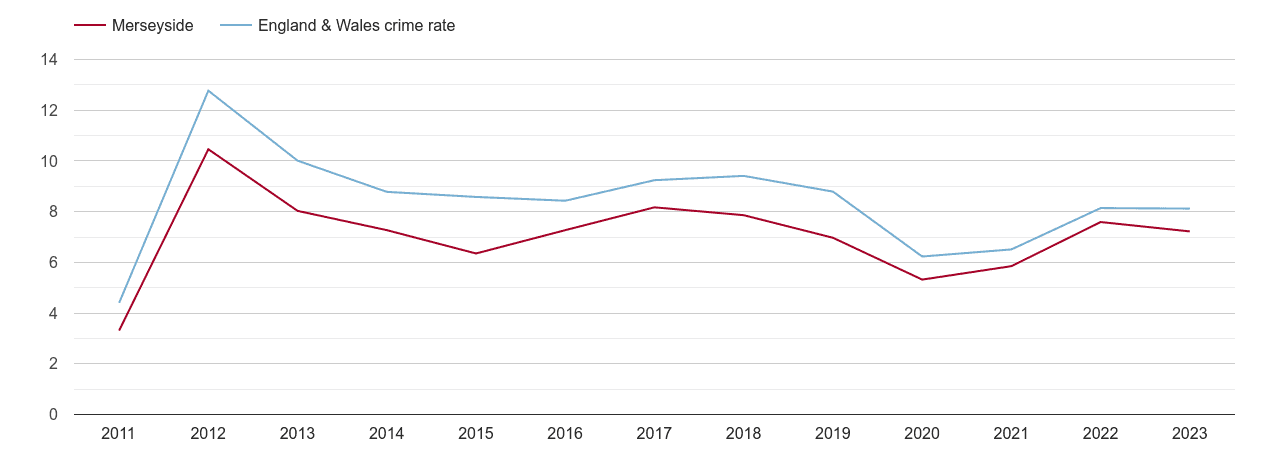
Crime rate per 1000 workday people compared to the national crime rate by year.
Total number of crimes reported in a given calendar month (1 = January … 12 = December) in the previous five years, i.e. from 2020 till 2024.
For details, click on the crime name with '→'
 login →


