As of April 2026, the annual crime rate in Merseyside county stands at 10.1 crimes per 1000 people. Merseyside's current crime levels are at 283% of the national crime rate. Drugs crime makes up 9.0% of all crimes reported in the county. Drugs crime totalled 13.8k representing an increase 10.6% year-over-year.
| Merseyside county | crime statistic | England & Wales |
|---|---|---|
| 10.1 | annual crime rate per 1k workday people | 3.6 |
| 283% | ratio of national crime rate | 100% |
| 9.0% | share of all crimes | 3.5% |
| 13.8k | crimes reported | 199k |
| 10.6% | annual change | 13.3% |
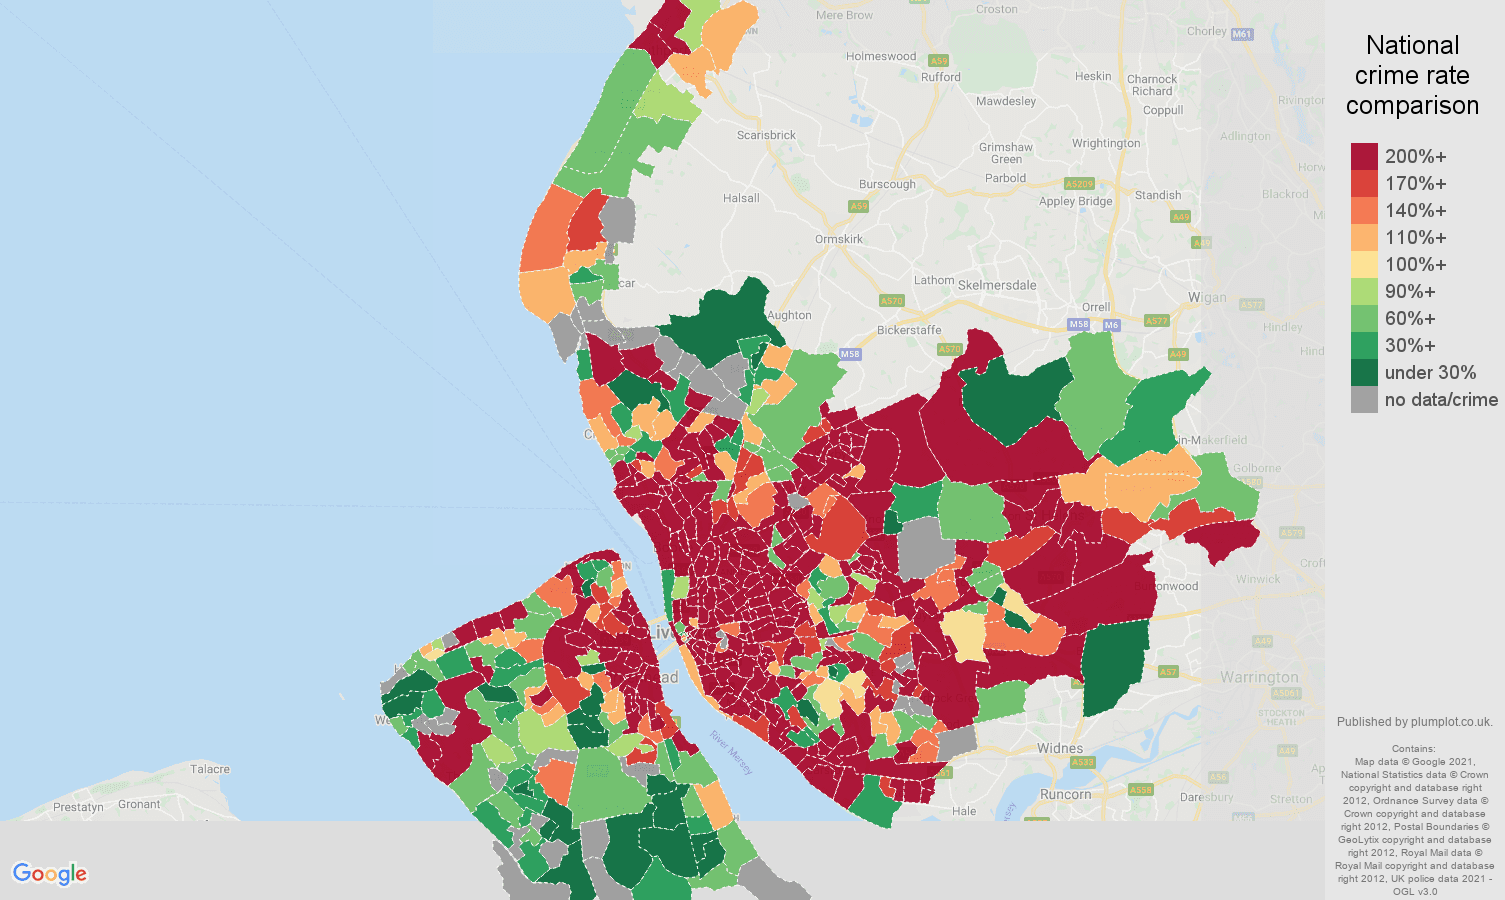
| Postcode sector | Crime rate vs. ENG & WLS rate | Crime rate per 1000 workday people | Total number of crimes | |
|---|---|---|---|---|
| CH41 0 | 101% | 4 | 10 | |
| CH41 1 | 1192% | 42 | 69 | |
| CH41 2 | 734% | 26 | 104 | |
| CH41 3 | 562% | 20 | 42 | |
| CH41 4 | 305% | 11 | 53 | |
| CH41 5 | 298% | 11 | 48 | |
| CH41 6 | 678% | 24 | 107 | |
| CH41 7 | 180% | 6 | 20 | |
| CH41 8 | 670% | 24 | 82 | |
| CH41 9 | 328% | 12 | 42 | |
| CH42 0 | 374% | 13 | 31 | |
| CH42 1 | 351% | 12 | 38 | |
| CH42 2 | 382% | 14 | 27 | |
| CH42 3 | 302% | 11 | 21 | |
| CH42 4 | 205% | 7 | 24 | |
| CH42 5 | 311% | 11 | 26 | |
| CH42 6 | 126% | 4 | 12 | |
| CH42 7 | 192% | 7 | 12 | |
| CH42 8 | 30% | 1 | 2 | |
| CH42 9 | 142% | 5 | 17 | |
| CH43 0 | 35% | 1 | 4 | |
| CH43 1 | 239% | 8 | 21 | |
| CH43 2 | 60% | 2 | 6 | |
| CH43 3 | 79% | 3 | 9 | |
| CH43 4 | 404% | 14 | 36 | |
| CH43 5 | 144% | 5 | 12 | |
| CH43 6 | 127% | 5 | 6 | |
| CH43 7 | 192% | 7 | 35 | |
| CH43 8 | 95% | 3 | 4 | |
| CH43 9 | 66% | 2 | 13 | |
| CH44 0 | 196% | 7 | 16 | |
| CH44 1 | 234% | 8 | 18 | |
| CH44 2 | 195% | 7 | 15 | |
| CH44 3 | 59% | 2 | 4 | |
| CH44 4 | 86% | 3 | 12 | |
| CH44 5 | 141% | 5 | 18 | |
| CH44 6 | 399% | 14 | 40 | |
| CH44 7 | 317% | 11 | 33 | |
| CH44 8 | 173% | 6 | 14 | |
| CH44 9 | 282% | 10 | 26 | |
| CH45 0 | 68% | 2 | 3 | |
| CH45 1 | 157% | 6 | 12 | |
| CH45 2 | 250% | 9 | 17 | |
| CH45 3 | 67% | 2 | 6 | |
| CH45 4 | 139% | 5 | 18 | |
| CH45 5 | 66% | 2 | 8 | |
| CH45 7 | 92% | 3 | 10 | |
| CH45 8 | 128% | 5 | 14 | |
| CH45 9 | 42% | 2 | 2 | |
| CH46 0 | 91% | 3 | 10 | |
| CH46 1 | 129% | 5 | 12 | |
| CH46 2 | 138% | 5 | 10 | |
| CH46 3 | 47% | 2 | 2 | |
| CH46 4 | 106% | 4 | 1 | |
| CH46 5 | 345% | 12 | 5 | |
| CH46 6 | 121% | 4 | 16 | |
| CH46 7 | 117% | 4 | 10 | |
| CH46 8 | 123% | 4 | 14 | |
| CH46 9 | 76% | 3 | 6 | |
| CH47 2 | 131% | 5 | 9 | |
| CH47 3 | 45% | 2 | 3 | |
| CH47 4 | 26% | 1 | 1 | |
| CH47 6 | 43% | 2 | 1 | |
| CH47 8 | 220% | 8 | 2 | |
| CH47 9 | 79% | 3 | 2 | |
| CH48 0 | 120% | 4 | 6 | |
| CH48 1 | 45% | 2 | 2 | |
| CH48 2 | 62% | 2 | 2 | |
| CH48 3 | 43% | 2 | 2 | |
| CH48 5 | 40% | 1 | 3 | |
| CH48 6 | 34% | 1 | 2 | |
| CH48 7 | 78% | 3 | 2 | |
| CH48 9 | 23% | 1 | 1 | |
| CH49 0 | 97% | 3 | 7 | |
| CH49 1 | 56% | 2 | 3 | |
| CH49 3 | 33% | 1 | 3 | |
| CH49 4 | 69% | 2 | 9 | |
| CH49 5 | 119% | 4 | 25 | |
| CH49 6 | 33% | 1 | 3 | |
| CH49 7 | 113% | 4 | 10 | |
| CH49 8 | 108% | 4 | 8 | |
| CH49 9 | 232% | 8 | 15 | |
| CH60 0 | 21% | 1 | 1 | |
| CH60 5 | 16% | 1 | 1 | |
| CH60 6 | 110% | 4 | 4 | |
| CH60 7 | 52% | 2 | 3 | |
| CH60 8 | 26% | 1 | 1 | |
| CH61 0 | 121% | 4 | 2 | |
| CH61 3 | 69% | 2 | 3 | |
| CH61 6 | 16% | 1 | 1 | |
| CH61 7 | 47% | 2 | 2 | |
| CH61 8 | 88% | 3 | 5 | |
| CH61 9 | 130% | 5 | 7 | |
| CH62 0 | 128% | 5 | 7 | |
| CH62 1 | 446% | 16 | 36 | |
| CH62 2 | 71% | 3 | 6 | |
| CH62 3 | 83% | 3 | 7 | |
| CH62 4 | 29% | 1 | 4 | |
| CH62 5 | 189% | 7 | 18 | |
| CH62 6 | 57% | 2 | 5 | |
| CH62 7 | 72% | 3 | 18 | |
| CH62 8 | 32% | 1 | 4 | |
| CH62 9 | 91% | 3 | 8 | |
| CH63 2 | 35% | 1 | 4 | |
| CH63 3 | 13% | 0 | 2 | |
| CH63 5 | 85% | 3 | 9 | |
| CH63 7 | 58% | 2 | 7 | |
| CH63 8 | 74% | 3 | 6 | |
| CH63 9 | 26% | 1 | 4 | |
| CH64 3 | 28% | 1 | 2 | |
| CH64 7 | 105% | 4 | 3 | |
| CH65 1 | 485% | 17 | 2 | |
| L1 0 | 48360% | 1720 | 43 | |
| L1 1 | 2779% | 99 | 422 | |
| L1 2 | 640% | 23 | 37 | |
| L1 3 | 924% | 33 | 142 | |
| L1 4 | 3861% | 137 | 742 | |
| L1 5 | 1760% | 63 | 245 | |
| L1 6 | 1778% | 63 | 289 | |
| L1 7 | 1401% | 50 | 48 | |
| L1 8 | 1911% | 68 | 135 | |
| L1 9 | 985% | 35 | 79 | |
| L10 0 | 733% | 26 | 14 | |
| L10 1 | 104% | 4 | 11 | |
| L10 2 | 63% | 2 | 3 | |
| L10 3 | 239% | 9 | 8 | |
| L10 4 | 35% | 1 | 3 | |
| L10 7 | 263% | 9 | 14 | |
| L10 8 | 46% | 2 | 3 | |
| L10 9 | 179% | 6 | 8 | |
| L11 0 | 184% | 7 | 13 | |
| L11 1 | 660% | 23 | 63 | |
| L11 2 | 320% | 11 | 36 | |
| L11 3 | 347% | 12 | 37 | |
| L11 4 | 391% | 14 | 30 | |
| L11 5 | 148% | 5 | 7 | |
| L11 6 | 206% | 7 | 6 | |
| L11 7 | 191% | 7 | 17 | |
| L11 8 | 213% | 8 | 11 | |
| L11 9 | 167% | 6 | 12 | |
| L12 0 | 63% | 2 | 13 | |
| L12 1 | 167% | 6 | 6 | |
| L12 2 | 103% | 4 | 6 | |
| L12 3 | 19% | 1 | 1 | |
| L12 4 | 233% | 8 | 17 | |
| L12 5 | 139% | 5 | 12 | |
| L12 6 | 360% | 13 | 17 | |
| L12 7 | 130% | 5 | 9 | |
| L12 8 | 99% | 4 | 8 | |
| L12 9 | 101% | 4 | 12 | |
| L13 0 | 266% | 9 | 16 | |
| L13 1 | 196% | 7 | 16 | |
| L13 2 | 530% | 19 | 51 | |
| L13 3 | 127% | 5 | 17 | |
| L13 4 | 129% | 5 | 14 | |
| L13 5 | 140% | 5 | 21 | |
| L13 6 | 128% | 5 | 12 | |
| L13 7 | 235% | 8 | 29 | |
| L13 8 | 365% | 13 | 35 | |
| L13 9 | 347% | 12 | 26 | |
| L14 0 | 204% | 7 | 27 | |
| L14 1 | 281% | 10 | 16 | |
| L14 2 | 160% | 6 | 13 | |
| L14 3 | 129% | 5 | 12 | |
| L14 4 | 233% | 8 | 12 | |
| L14 5 | 75% | 3 | 9 | |
| L14 6 | 32% | 1 | 2 | |
| L14 7 | 112% | 4 | 9 | |
| L14 8 | 317% | 11 | 21 | |
| L14 9 | 250% | 9 | 27 | |
| L15 0 | 433% | 15 | 37 | |
| L15 1 | 222% | 8 | 16 | |
| L15 2 | 282% | 10 | 18 | |
| L15 3 | 76% | 3 | 10 | |
| L15 4 | 131% | 5 | 21 | |
| L15 5 | 140% | 5 | 9 | |
| L15 6 | 76% | 3 | 7 | |
| L15 7 | 72% | 3 | 5 | |
| L15 8 | 204% | 7 | 21 | |
| L15 9 | 252% | 9 | 10 | |
| L16 0 | 71% | 3 | 2 | |
| L16 1 | 37% | 1 | 1 | |
| L16 2 | 97% | 3 | 5 | |
| L16 3 | 82% | 3 | 4 | |
| L16 5 | 31% | 1 | 1 | |
| L16 6 | 44% | 2 | 1 | |
| L16 7 | 20% | 1 | 1 | |
| L16 9 | 10% | 0 | 1 | |
| L17 0 | 73% | 3 | 7 | |
| L17 1 | 439% | 16 | 18 | |
| L17 2 | 169% | 6 | 9 | |
| L17 3 | 212% | 8 | 13 | |
| L17 4 | 558% | 20 | 23 | |
| L17 5 | 551% | 20 | 19 | |
| L17 6 | 96% | 3 | 8 | |
| L17 7 | 128% | 5 | 14 | |
| L17 8 | 408% | 15 | 29 | |
| L17 9 | 54% | 2 | 3 | |
| L18 0 | 32% | 1 | 1 | |
| L18 1 | 62% | 2 | 10 | |
| L18 2 | 59% | 2 | 3 | |
| L18 3 | 58% | 2 | 5 | |
| L18 4 | 39% | 1 | 2 | |
| L18 5 | 39% | 1 | 3 | |
| L18 6 | 80% | 3 | 6 | |
| L18 7 | 60% | 2 | 4 | |
| L18 8 | 27% | 1 | 3 | |
| L18 9 | 59% | 2 | 5 | |
| L19 0 | 154% | 5 | 11 | |
| L19 1 | 79% | 3 | 4 | |
| L19 2 | 96% | 3 | 23 | |
| L19 3 | 56% | 2 | 3 | |
| L19 4 | 166% | 6 | 13 | |
| L19 5 | 82% | 3 | 4 | |
| L19 6 | 204% | 7 | 7 | |
| L19 7 | 40% | 1 | 1 | |
| L19 8 | 455% | 16 | 43 | |
| L19 9 | 34% | 1 | 3 | |
| L2 0 | 405% | 14 | 36 | |
| L2 2 | 1063% | 38 | 124 | |
| L2 3 | 665% | 24 | 25 | |
| L2 4 | 164% | 6 | 19 | |
| L2 5 | 1731% | 62 | 92 | |
| L2 6 | 1189% | 42 | 101 | |
| L2 7 | 630% | 22 | 54 | |
| L2 8 | 84% | 3 | 2 | |
| L2 9 | 389% | 14 | 8 | |
| L20 0 | 232% | 8 | 20 | |
| L20 1 | 1839% | 65 | 7 | |
| L20 2 | 347% | 12 | 32 | |
| L20 3 | 335% | 12 | 53 | |
| L20 4 | 292% | 10 | 83 | |
| L20 5 | 487% | 17 | 43 | |
| L20 6 | 180% | 6 | 36 | |
| L20 7 | 677% | 24 | 127 | |
| L20 8 | 481% | 17 | 23 | |
| L20 9 | 228% | 8 | 42 | |
| L21 0 | 319% | 11 | 37 | |
| L21 1 | 119% | 4 | 13 | |
| L21 2 | 92% | 3 | 3 | |
| L21 3 | 467% | 17 | 8 | |
| L21 4 | 245% | 9 | 11 | |
| L21 5 | 253% | 9 | 10 | |
| L21 6 | 785% | 28 | 21 | |
| L21 7 | 146% | 5 | 14 | |
| L21 8 | 494% | 18 | 53 | |
| L21 9 | 157% | 6 | 19 | |
| L22 0 | 139% | 5 | 8 | |
| L22 1 | 235% | 8 | 8 | |
| L22 2 | 81% | 3 | 3 | |
| L22 3 | 125% | 4 | 8 | |
| L22 4 | 81% | 3 | 4 | |
| L22 5 | 194% | 7 | 13 | |
| L22 6 | 35% | 1 | 1 | |
| L22 7 | 75% | 3 | 2 | |
| L22 8 | 324% | 12 | 9 | |
| L22 9 | 101% | 4 | 4 | |
| L23 0 | 42% | 1 | 6 | |
| L23 1 | 180% | 6 | 10 | |
| L23 2 | 71% | 3 | 9 | |
| L23 3 | 63% | 2 | 4 | |
| L23 4 | 109% | 4 | 4 | |
| L23 5 | 104% | 4 | 8 | |
| L23 6 | 149% | 5 | 13 | |
| L23 7 | 38% | 1 | 3 | |
| L23 8 | 170% | 6 | 11 | |
| L23 9 | 73% | 3 | 10 | |
| L24 0 | 229% | 8 | 14 | |
| L24 1 | 118% | 4 | 30 | |
| L24 2 | 198% | 7 | 27 | |
| L24 3 | 106% | 4 | 22 | |
| L24 6 | 330% | 12 | 11 | |
| L24 7 | 421% | 15 | 15 | |
| L24 9 | 87% | 3 | 5 | |
| L25 0 | 107% | 4 | 18 | |
| L25 1 | 84% | 3 | 5 | |
| L25 2 | 399% | 14 | 53 | |
| L25 3 | 131% | 5 | 10 | |
| L25 4 | 67% | 2 | 4 | |
| L25 5 | 151% | 5 | 16 | |
| L25 6 | 40% | 1 | 3 | |
| L25 7 | 90% | 3 | 12 | |
| L25 8 | 70% | 3 | 6 | |
| L25 9 | 67% | 2 | 8 | |
| L26 0 | 278% | 10 | 17 | |
| L26 1 | 361% | 13 | 30 | |
| L26 2 | 706% | 25 | 5 | |
| L26 3 | 341% | 12 | 3 | |
| L26 6 | 101% | 4 | 3 | |
| L26 7 | 47% | 2 | 4 | |
| L26 9 | 125% | 4 | 24 | |
| L27 1 | 172% | 6 | 8 | |
| L27 4 | 181% | 6 | 2 | |
| L27 5 | 156% | 6 | 4 | |
| L27 6 | 142% | 5 | 4 | |
| L27 7 | 195% | 7 | 9 | |
| L27 8 | 81% | 3 | 2 | |
| L28 0 | 507% | 18 | 12 | |
| L28 1 | 441% | 16 | 24 | |
| L28 3 | 574% | 20 | 3 | |
| L28 4 | 380% | 14 | 11 | |
| L28 5 | 670% | 24 | 16 | |
| L28 6 | 539% | 19 | 6 | |
| L28 7 | 704% | 25 | 12 | |
| L28 8 | 242% | 9 | 3 | |
| L29 1 | 4217% | 150 | 6 | |
| L3 0 | 105% | 4 | 2 | |
| L3 1 | 298% | 11 | 43 | |
| L3 2 | 238% | 8 | 42 | |
| L3 3 | 2681% | 95 | 131 | |
| L3 4 | 246% | 9 | 75 | |
| L3 5 | 352% | 13 | 88 | |
| L3 6 | 1320% | 47 | 198 | |
| L3 7 | 1080% | 38 | 25 | |
| L3 8 | 2385% | 85 | 305 | |
| L3 9 | 120% | 4 | 44 | |
| L30 0 | 266% | 9 | 15 | |
| L30 1 | 118% | 4 | 23 | |
| L30 2 | 393% | 14 | 35 | |
| L30 3 | 420% | 15 | 25 | |
| L30 5 | 447% | 16 | 38 | |
| L30 6 | 213% | 8 | 5 | |
| L30 7 | 634% | 23 | 52 | |
| L30 8 | 85% | 3 | 4 | |
| L30 9 | 69% | 2 | 4 | |
| L31 0 | 63% | 2 | 4 | |
| L31 1 | 164% | 6 | 25 | |
| L31 2 | 76% | 3 | 7 | |
| L31 3 | 157% | 6 | 9 | |
| L31 5 | 24% | 1 | 2 | |
| L31 6 | 94% | 3 | 8 | |
| L31 7 | 10% | 0 | 1 | |
| L31 8 | 32% | 1 | 3 | |
| L31 9 | 38% | 1 | 4 | |
| L32 0 | 477% | 17 | 43 | |
| L32 1 | 133% | 5 | 5 | |
| L32 2 | 148% | 5 | 8 | |
| L32 3 | 361% | 13 | 12 | |
| L32 4 | 332% | 12 | 16 | |
| L32 5 | 1353% | 48 | 32 | |
| L32 6 | 102% | 4 | 13 | |
| L32 7 | 221% | 8 | 19 | |
| L32 8 | 443% | 16 | 49 | |
| L32 9 | 249% | 9 | 22 | |
| L33 0 | 674% | 24 | 31 | |
| L33 1 | 217% | 8 | 26 | |
| L33 2 | 245% | 9 | 7 | |
| L33 5 | 186% | 7 | 19 | |
| L33 6 | 274% | 10 | 24 | |
| L33 7 | 280% | 10 | 15 | |
| L33 8 | 555% | 20 | 17 | |
| L33 9 | 219% | 8 | 17 | |
| L34 0 | 60% | 2 | 7 | |
| L34 1 | 185% | 7 | 21 | |
| L34 2 | 44% | 2 | 4 | |
| L34 3 | 394% | 14 | 12 | |
| L34 4 | 259% | 9 | 5 | |
| L34 5 | 869% | 31 | 79 | |
| L34 6 | 547% | 19 | 31 | |
| L34 7 | 84% | 3 | 1 | |
| L34 8 | 164% | 6 | 6 | |
| L35 0 | 36% | 1 | 3 | |
| L35 1 | 72% | 3 | 5 | |
| L35 2 | 234% | 8 | 35 | |
| L35 3 | 268% | 10 | 60 | |
| L35 4 | 100% | 4 | 8 | |
| L35 5 | 403% | 14 | 50 | |
| L35 6 | 217% | 8 | 11 | |
| L35 7 | 91% | 3 | 6 | |
| L35 8 | 29% | 1 | 5 | |
| L35 9 | 76% | 3 | 3 | |
| L36 0 | 242% | 9 | 35 | |
| L36 1 | 288% | 10 | 21 | |
| L36 2 | 327% | 12 | 45 | |
| L36 3 | 470% | 17 | 63 | |
| L36 4 | 114% | 4 | 17 | |
| L36 5 | 119% | 4 | 18 | |
| L36 6 | 420% | 15 | 47 | |
| L36 7 | 429% | 15 | 58 | |
| L36 8 | 398% | 14 | 53 | |
| L36 9 | 213% | 8 | 24 | |
| L37 1 | 106% | 4 | 8 | |
| L37 2 | 62% | 2 | 8 | |
| L37 3 | 63% | 2 | 9 | |
| L37 4 | 82% | 3 | 9 | |
| L37 6 | 56% | 2 | 5 | |
| L37 7 | 29% | 1 | 3 | |
| L37 8 | 38% | 1 | 2 | |
| L38 1 | 321% | 11 | 2 | |
| L38 6 | 256% | 9 | 2 | |
| L38 9 | 124% | 4 | 3 | |
| L4 0 | 686% | 24 | 68 | |
| L4 1 | 712% | 25 | 57 | |
| L4 2 | 670% | 24 | 104 | |
| L4 3 | 585% | 21 | 69 | |
| L4 4 | 1042% | 37 | 148 | |
| L4 5 | 647% | 23 | 107 | |
| L4 6 | 291% | 10 | 25 | |
| L4 7 | 247% | 9 | 22 | |
| L4 8 | 401% | 14 | 32 | |
| L4 9 | 236% | 8 | 38 | |
| L5 0 | 439% | 16 | 24 | |
| L5 1 | 295% | 10 | 6 | |
| L5 2 | 923% | 33 | 40 | |
| L5 3 | 641% | 23 | 37 | |
| L5 4 | 371% | 13 | 18 | |
| L5 5 | 762% | 27 | 44 | |
| L5 6 | 705% | 25 | 53 | |
| L5 7 | 523% | 19 | 29 | |
| L5 8 | 514% | 18 | 30 | |
| L5 9 | 294% | 10 | 31 | |
| L6 0 | 1071% | 38 | 77 | |
| L6 1 | 778% | 28 | 69 | |
| L6 2 | 597% | 21 | 45 | |
| L6 3 | 1127% | 40 | 65 | |
| L6 4 | 607% | 22 | 78 | |
| L6 5 | 381% | 14 | 37 | |
| L6 6 | 602% | 21 | 52 | |
| L6 7 | 2650% | 94 | 74 | |
| L6 8 | 949% | 34 | 42 | |
| L6 9 | 891% | 32 | 43 | |
| L7 0 | 733% | 26 | 124 | |
| L7 1 | 176% | 6 | 5 | |
| L7 2 | 841% | 30 | 51 | |
| L7 3 | 259% | 9 | 31 | |
| L7 4 | 322% | 11 | 5 | |
| L7 5 | 1192% | 42 | 31 | |
| L7 6 | 393% | 14 | 25 | |
| L7 7 | 162% | 6 | 23 | |
| L7 8 | 133% | 5 | 43 | |
| L7 9 | 524% | 19 | 31 | |
| L8 0 | 465% | 17 | 95 | |
| L8 1 | 1130% | 40 | 56 | |
| L8 2 | 244% | 9 | 17 | |
| L8 3 | 499% | 18 | 46 | |
| L8 4 | 420% | 15 | 47 | |
| L8 5 | 687% | 24 | 40 | |
| L8 6 | 277% | 10 | 32 | |
| L8 7 | 554% | 20 | 100 | |
| L8 8 | 465% | 17 | 62 | |
| L8 9 | 154% | 5 | 12 | |
| L9 0 | 163% | 6 | 21 | |
| L9 1 | 325% | 12 | 76 | |
| L9 2 | 197% | 7 | 16 | |
| L9 3 | 102% | 4 | 12 | |
| L9 4 | 385% | 14 | 17 | |
| L9 5 | 457% | 16 | 11 | |
| L9 6 | 345% | 12 | 46 | |
| L9 7 | 93% | 3 | 14 | |
| L9 8 | 60% | 2 | 8 | |
| L9 9 | 81% | 3 | 19 | |
| PR8 1 | 479% | 17 | 124 | |
| PR8 2 | 65% | 2 | 19 | |
| PR8 3 | 70% | 2 | 23 | |
| PR8 4 | 49% | 2 | 15 | |
| PR8 6 | 89% | 3 | 40 | |
| PR9 0 | 486% | 17 | 184 | |
| PR9 7 | 115% | 4 | 38 | |
| PR9 9 | 91% | 3 | 38 | |
| WA10 1 | 522% | 19 | 146 | |
| WA10 2 | 553% | 20 | 139 | |
| WA10 3 | 230% | 8 | 83 | |
| WA10 4 | 268% | 10 | 55 | |
| WA10 5 | 52% | 2 | 8 | |
| WA10 6 | 175% | 6 | 36 | |
| WA11 0 | 114% | 4 | 54 | |
| WA11 7 | 359% | 13 | 75 | |
| WA11 8 | 48% | 2 | 9 | |
| WA11 9 | 142% | 5 | 58 | |
| WA12 0 | 91% | 3 | 15 | |
| WA12 8 | 265% | 9 | 51 | |
| WA12 9 | 191% | 7 | 62 | |
| WA8 3 | 81% | 3 | 14 | |
| WA8 4 | 245% | 9 | 40 | |
| WA8 5 | 195% | 7 | 13 | |
| WA9 1 | 611% | 22 | 162 | |
| WA9 2 | 378% | 13 | 72 | |
| WA9 3 | 318% | 11 | 126 | |
| WA9 4 | 201% | 7 | 78 | |
| WA9 5 | 260% | 9 | 109 | |
| WN4 0 | 16% | 1 | 4 | |
| WN5 7 | 47% | 2 | 13 | |
Crime rate ranking : Merseyside county has the 1. highest crime rate out of 54 counties
Drugs crime totalled 13.8k representing an increase 10.6% year-over-year. In the graph below, county are compared by crime rate and crime rate percentage change. Crime rate percentage change compares the county crime rate between May 2025 - April 2026 to the county crime rate in the previous 12 months. The size of the circle reflects the number of total crimes reported. The bigger the circle, the higher the number of crimes reported in the county.
+10.6% annual change, crime is increasing
13.8k crimes reported
 Crime rate percentage change
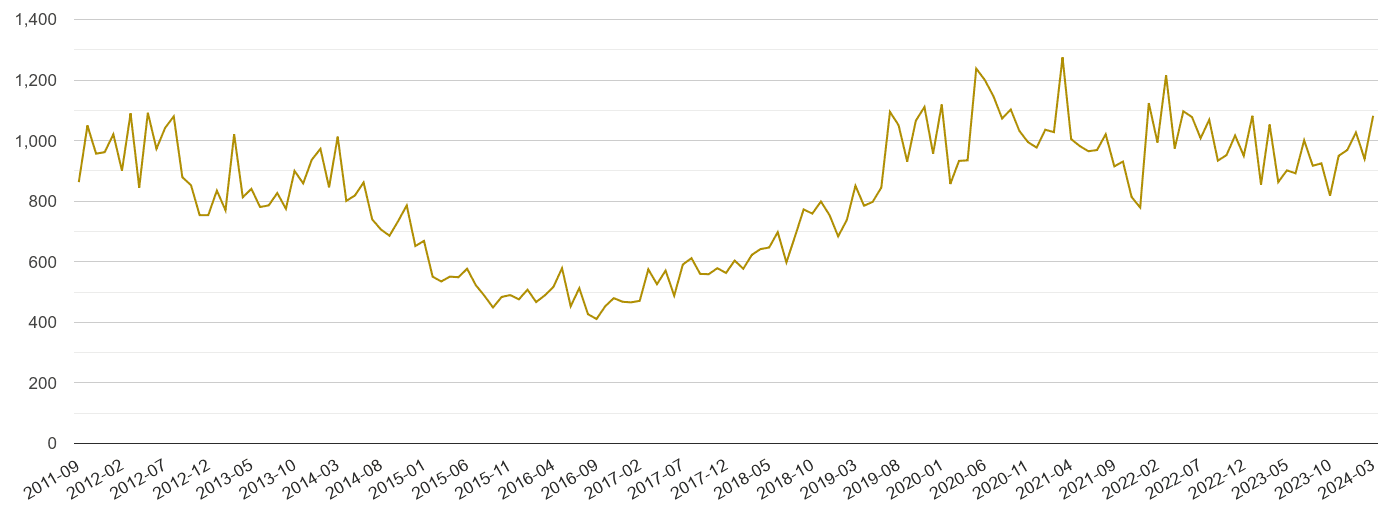
Number of crime incidents by month from January 2014 to April 2026.
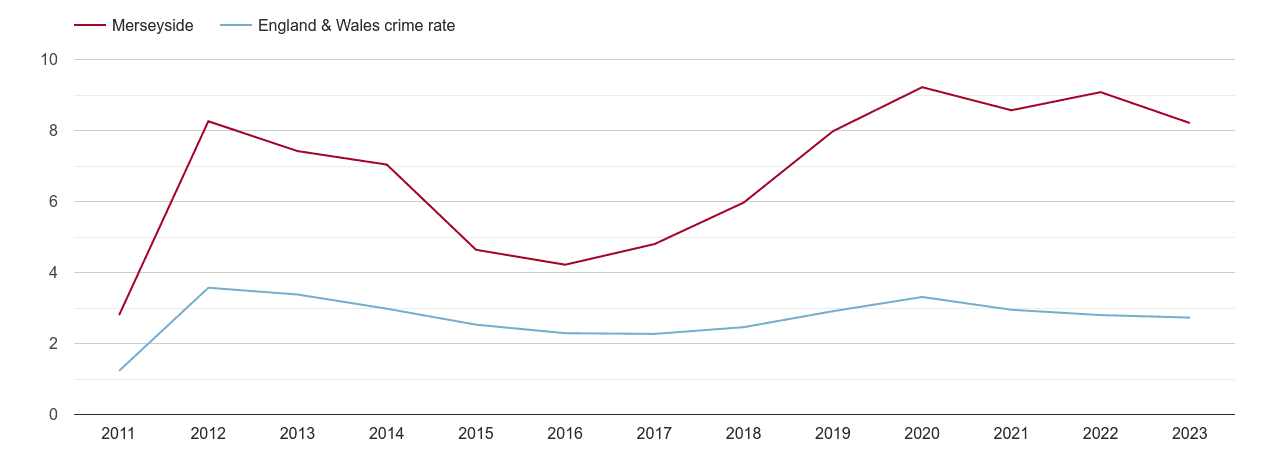
Crime rate per 1000 workday people compared to the national crime rate by year.
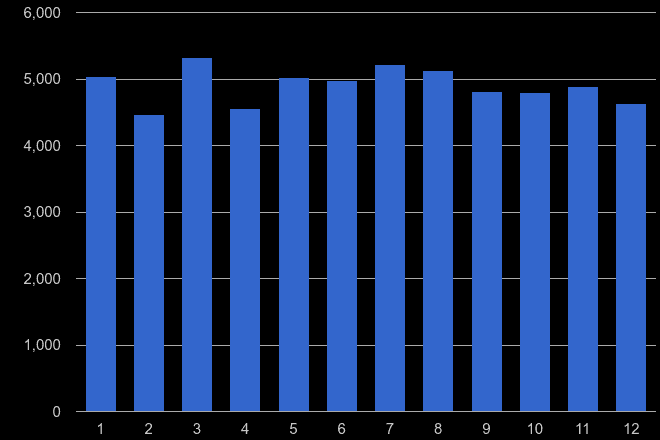
Total number of crimes reported in a given calendar month (1 = January … 12 = December) in the previous five years, i.e. from 2020 till 2024.
For details, click on the crime name with '→'
 login →


