◉ plumplot 

London property sizes

London property sizes

House price to earnings ratio 2002 - 2018

House price to earnings ratio 2002 - 2018

Population changes by county, 2002 vs 2017

Population changes by county, 2002 vs 2017

Fireplaces Today

Fireplaces Today

Current and potential energy ratings of homes

Current and potential energy ratings of homes

Statistically speaking, Manchester's city centre is THE place to be

Statistically speaking, Manchester's city centre is THE place to be

London population changes

London population changes

The oldest and youngest areas of England

The oldest and youngest areas of England

Violent crime seasonality

Violent crime seasonality

Sheffield house prices up by 3% in the first half of 2017

The most pricey neighborhoods in Sheffield are Coal Aston, Dronfield, Dronfield Woodhouse, Holmesfield, Unstone, North East Derbyshire with the average price tag of £489k, more than 300% of the average Sheffield property price.

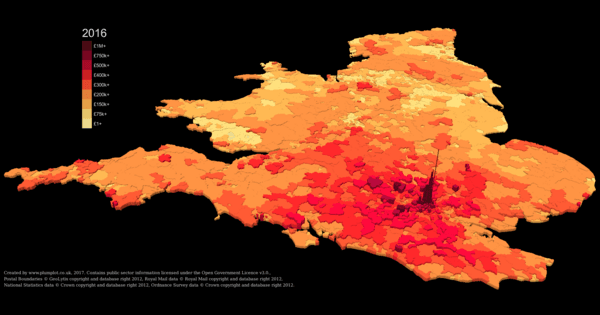
Leeds house prices at £209k in mid-2017

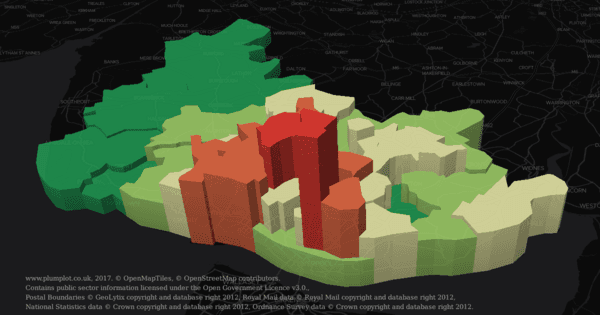
The most affordable parts of Leeds are Beeston, Beeston Hill, Cottingley, and Holbeck, with the average price of £70k in LS11 0, closely followed by with the average price of £71k in LS11 6. On the contrary, the fanciest and, subsequently, most expensive neighborhoods Collingham, Linton, and Wetherby (LS22 4) reach the average price of £715k, which is 343% of the Leeds average.

Brighton property prices up by 9% in mid-2017

From July 2016 till June 2017, the property prices in Brighton rose on average by 9% which translates to £29k. In order to buy an average property in Brighton, you would need to pay around £336k. For comparison, the average prices in the whole England and Wales rose by 2% or £6.5k.

UK supermarkets and co-operatives

UK supermarkets and co-operatives

Wales and England housing market

Wales and England housing market

London property market

London property market

Liverpool crime rates, house prices in 3D map

Liverpool crime rates, house prices in 3D map

England and Wales house price growth

England and Wales house price growth

England population changes during a work day

England population changes during a work day

GB car crashes heat map

GB car crashes heat map

London car crashes heat map

London car crashes heat map
Homeimage/svg+xmlOpencliparteco green house icon2012-05-29T15:40:56https://openclipart.org/detail/170282/eco-green-house-icon-by-cybergedeondominiquechappardecologygreenhomehouseicon