The oldest and youngest areas of England
In 2002, the average age in England and Wales was 38.8. In 2016, it was 39.9. The change can be seen on the maps below. There are 7,201 areas on each map. These areas are called MSOA, or Middle Layer Super Output Area. They were designed to improve the reporting of small area statistics and they were used in Census reports.
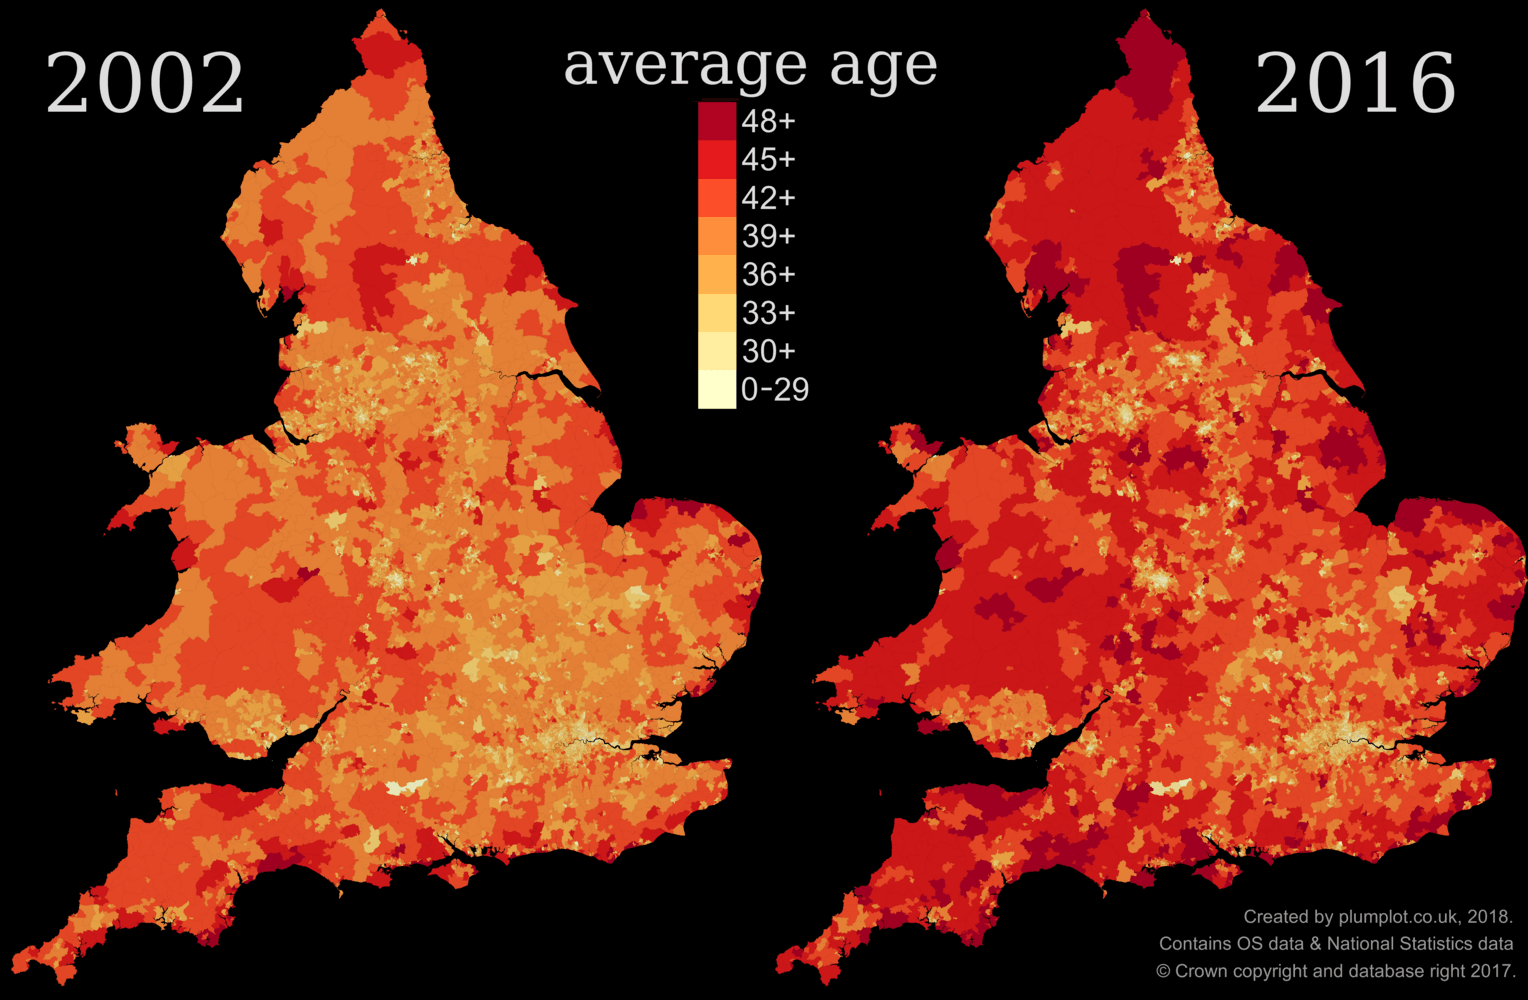
In 2002, 40% of the population was over 44 years old. Fourteen years later it was 43.5%. The share almost equaled to the population below 35, which was 43.7%. Life expectancy also increased. For people aged 65 years or older, the expectancy increased by more than two years. Their share increased by 2.1% between 2002 and 2016. There were 7.1k centenarians in 2002 and 13.7k in 2016.
| 2002 | 2016 | |||
|---|---|---|---|---|
| age group | head-count | share | head-count | share |
| 0 - 34 | 23.6m | 45% | 25.5m | 43.7% |
| 45 and over | 20.9m | 39.9% | 25.4m | 43.5% |
| 65 and over | 8.4m | 15.9% | 10.5m | 18% |
| 100 and over | 7.1k | 0.01% | 13.7k | 0.02% |
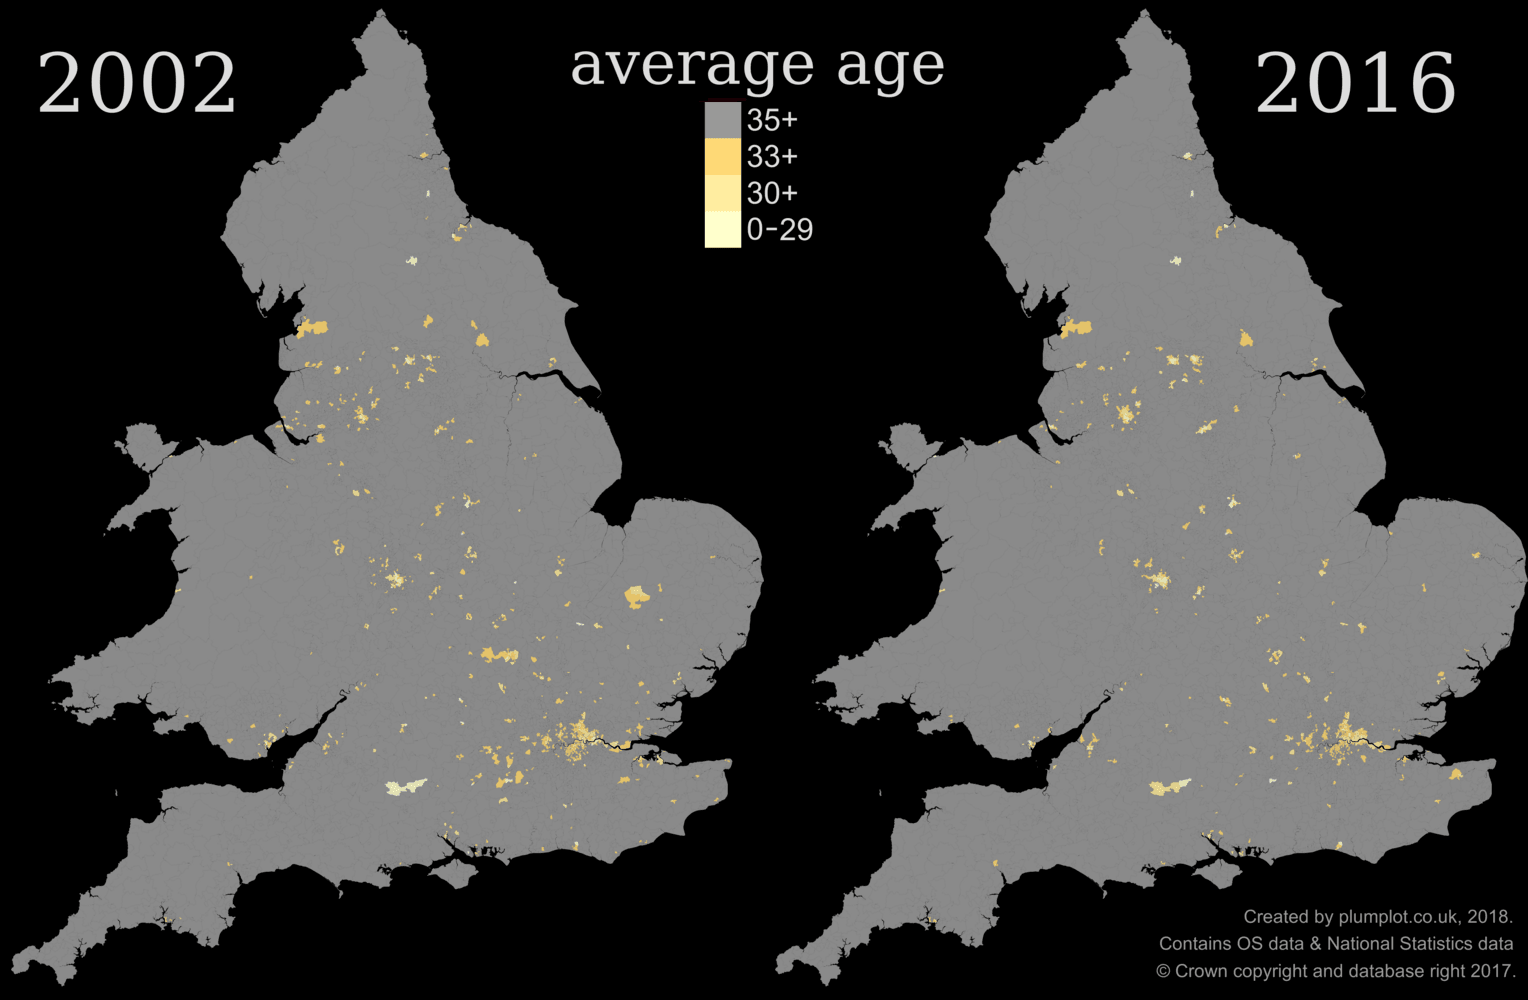
Average age below 35
When we highlight areas with the average age below 35, there is no significant change between 2002 and 2016. Most areas were located mostly in cities - London, Birmingham, Manchester, Leeds, Bradford, Bristol, Leicester, Sheffield, Nottingham, Cardiff and some others.
Top 7 areas with the lowest average age in 2016
| MSOA | nearby postcode districts | average age | head-count | |
|---|---|---|---|---|
| 1. | Birmingham 096 | B15, B29 | 23.8 | 14.8k |
| 2. | Leeds 063 | LS1, LS2, LS3 | 24.4 | 10.6k |
| 3. | Liverpool 060 | L1, L2, L3, L69, L70 | 24.4 | 14.5k |
| 4. | Sheffield 073 | S1, S3, S6 | 24.6 | 14.8k |
| 5. | Manchester 057 | M1, M15, M60 | 24.9 | 8.9k |
| 6. | Leeds 054 | LS6 | 25.0 | 8.4k |
| 7. | Cardiff 032 | CF1, CF2, CF10, CF24 | 25.0 | 13.1k |
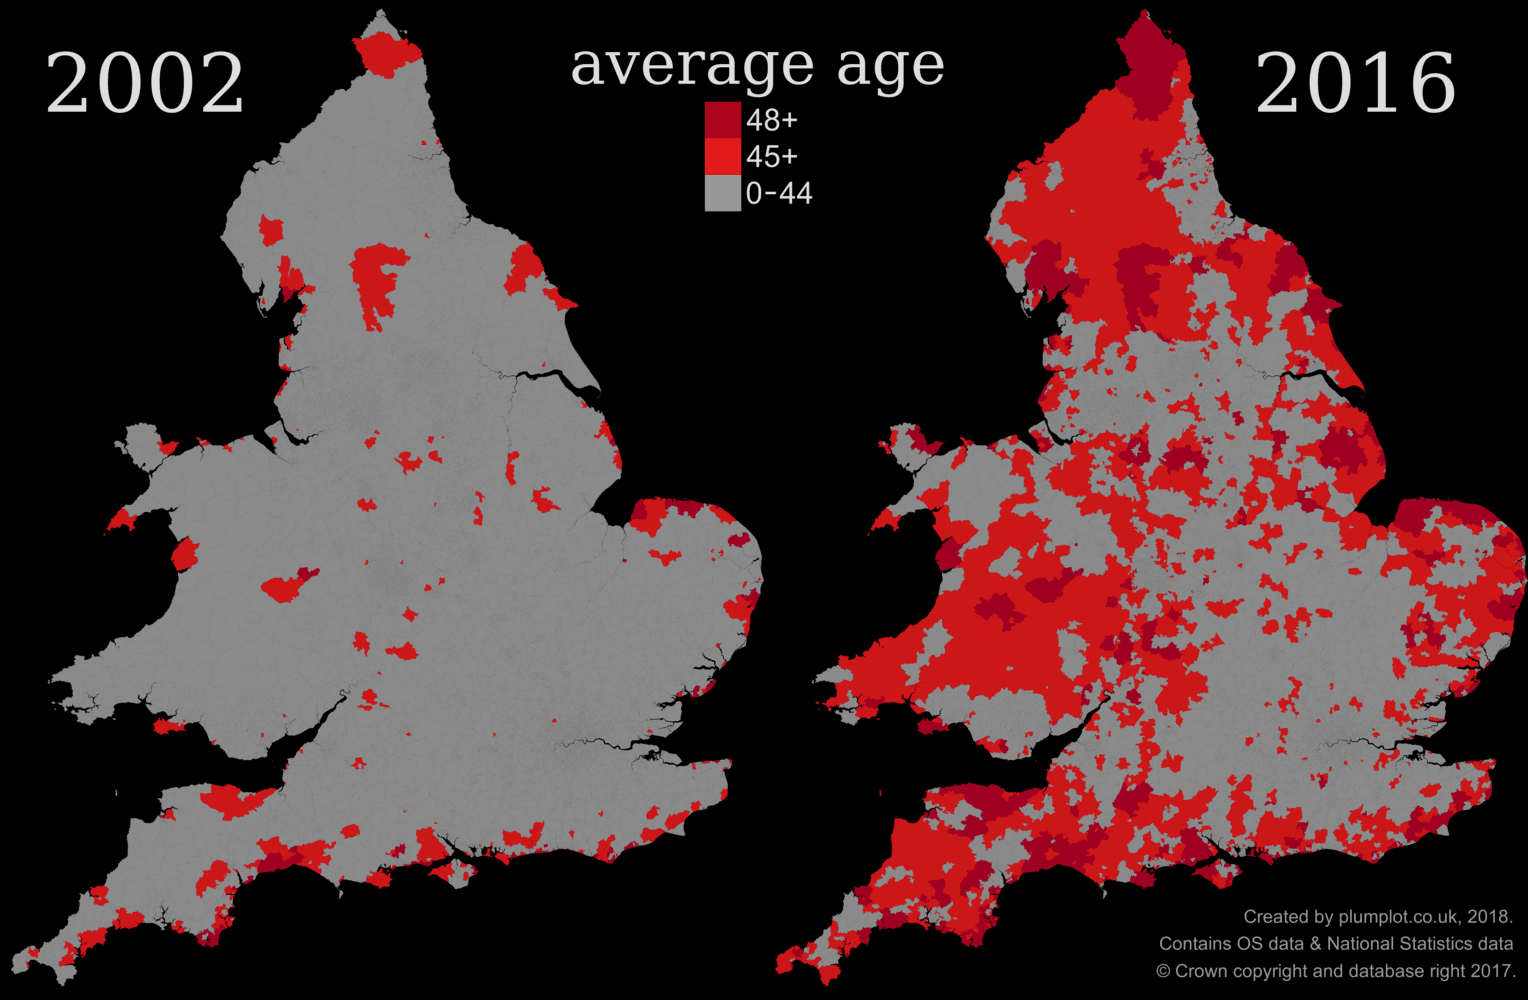
Average age 45 and over
The number of areas with the average age 45 and over has multiplied since 2002. It went from less than 300 in 2002 to 1,100 in 2016. The highest increase of areas was in Wales, North of England and South West England.
In 2016, most areas were in Cornwall, East Yorkshire, Cheshire East, Wiltshire, Shropshire, Northumberland ( Sefton, East Devon, Powys, Durham ). Interestingly, areas with the high average age are quite often coastal areas.
Top 7 areas with the highest average age in 2016
| MSOA | nearby postcode districts | average age | head-count | |
|---|---|---|---|---|
| 1. | Arun 010 | BN11, BN16 | 58.6 | 7.9k |
| 2. | New Forest 022 | BH25 | 58.4 | 7.6k |
| 3. | East Devon 012 | EX10 | 57.5 | 5.3k |
| 4. | East Lindsey 006 | LN12 | 56.3 | 6.3k |
| 5. | Arun 008 | BN12, BN16 | 56.2 | 6k |
| 6. | Rother 009 | BN24, TN39 | 56.1 | 10k |
| 7. | Tendring 012 | CO15 | 55.9 | 6.6k |
Growing and ageing population
Improved healthcare and lifestyles is the main reason for the increase in life expectancy. The growth in population is not only due to migration and natural changes (births has been outnumbering deaths in the UK since 1955, except 1976) but also partly because the population is ageing.
According to the UK Office for National Statistics, the percentage of the UK population that is 65 years or older is projected to continue to grow to nearly a quarter of the population by 2045. One-third of babies born in 2013 in the UK are expected to live to 100.
Contains OS data © Crown copyright and database right 2017, National Statistics data © Crown copyright and database right 2017 . Datasource: Population estimates