London population changes
2018-09
London is the second most populous region in the UK, trailing only the South East. However, it is rapidly approaching the top spot as the region with the fastest-growing population in the entire UK.
Historically, the last 100 years of population growth in London have been turbulent. After centuries of increase, the population peaked at 8.6 million in 1939, then began to decline for the next 50 years until it began to rise again in the early 1990s.
Population Changes by Boroughs
From 2002 to 2016, the population of Greater London increased by 1.41 million, growing from 7.38 million to 8.79 million. By 2015, London’s population had reached the pre-war peak of 8.6 million. The population percentage change in individual boroughs during this period is illustrated in the following map.
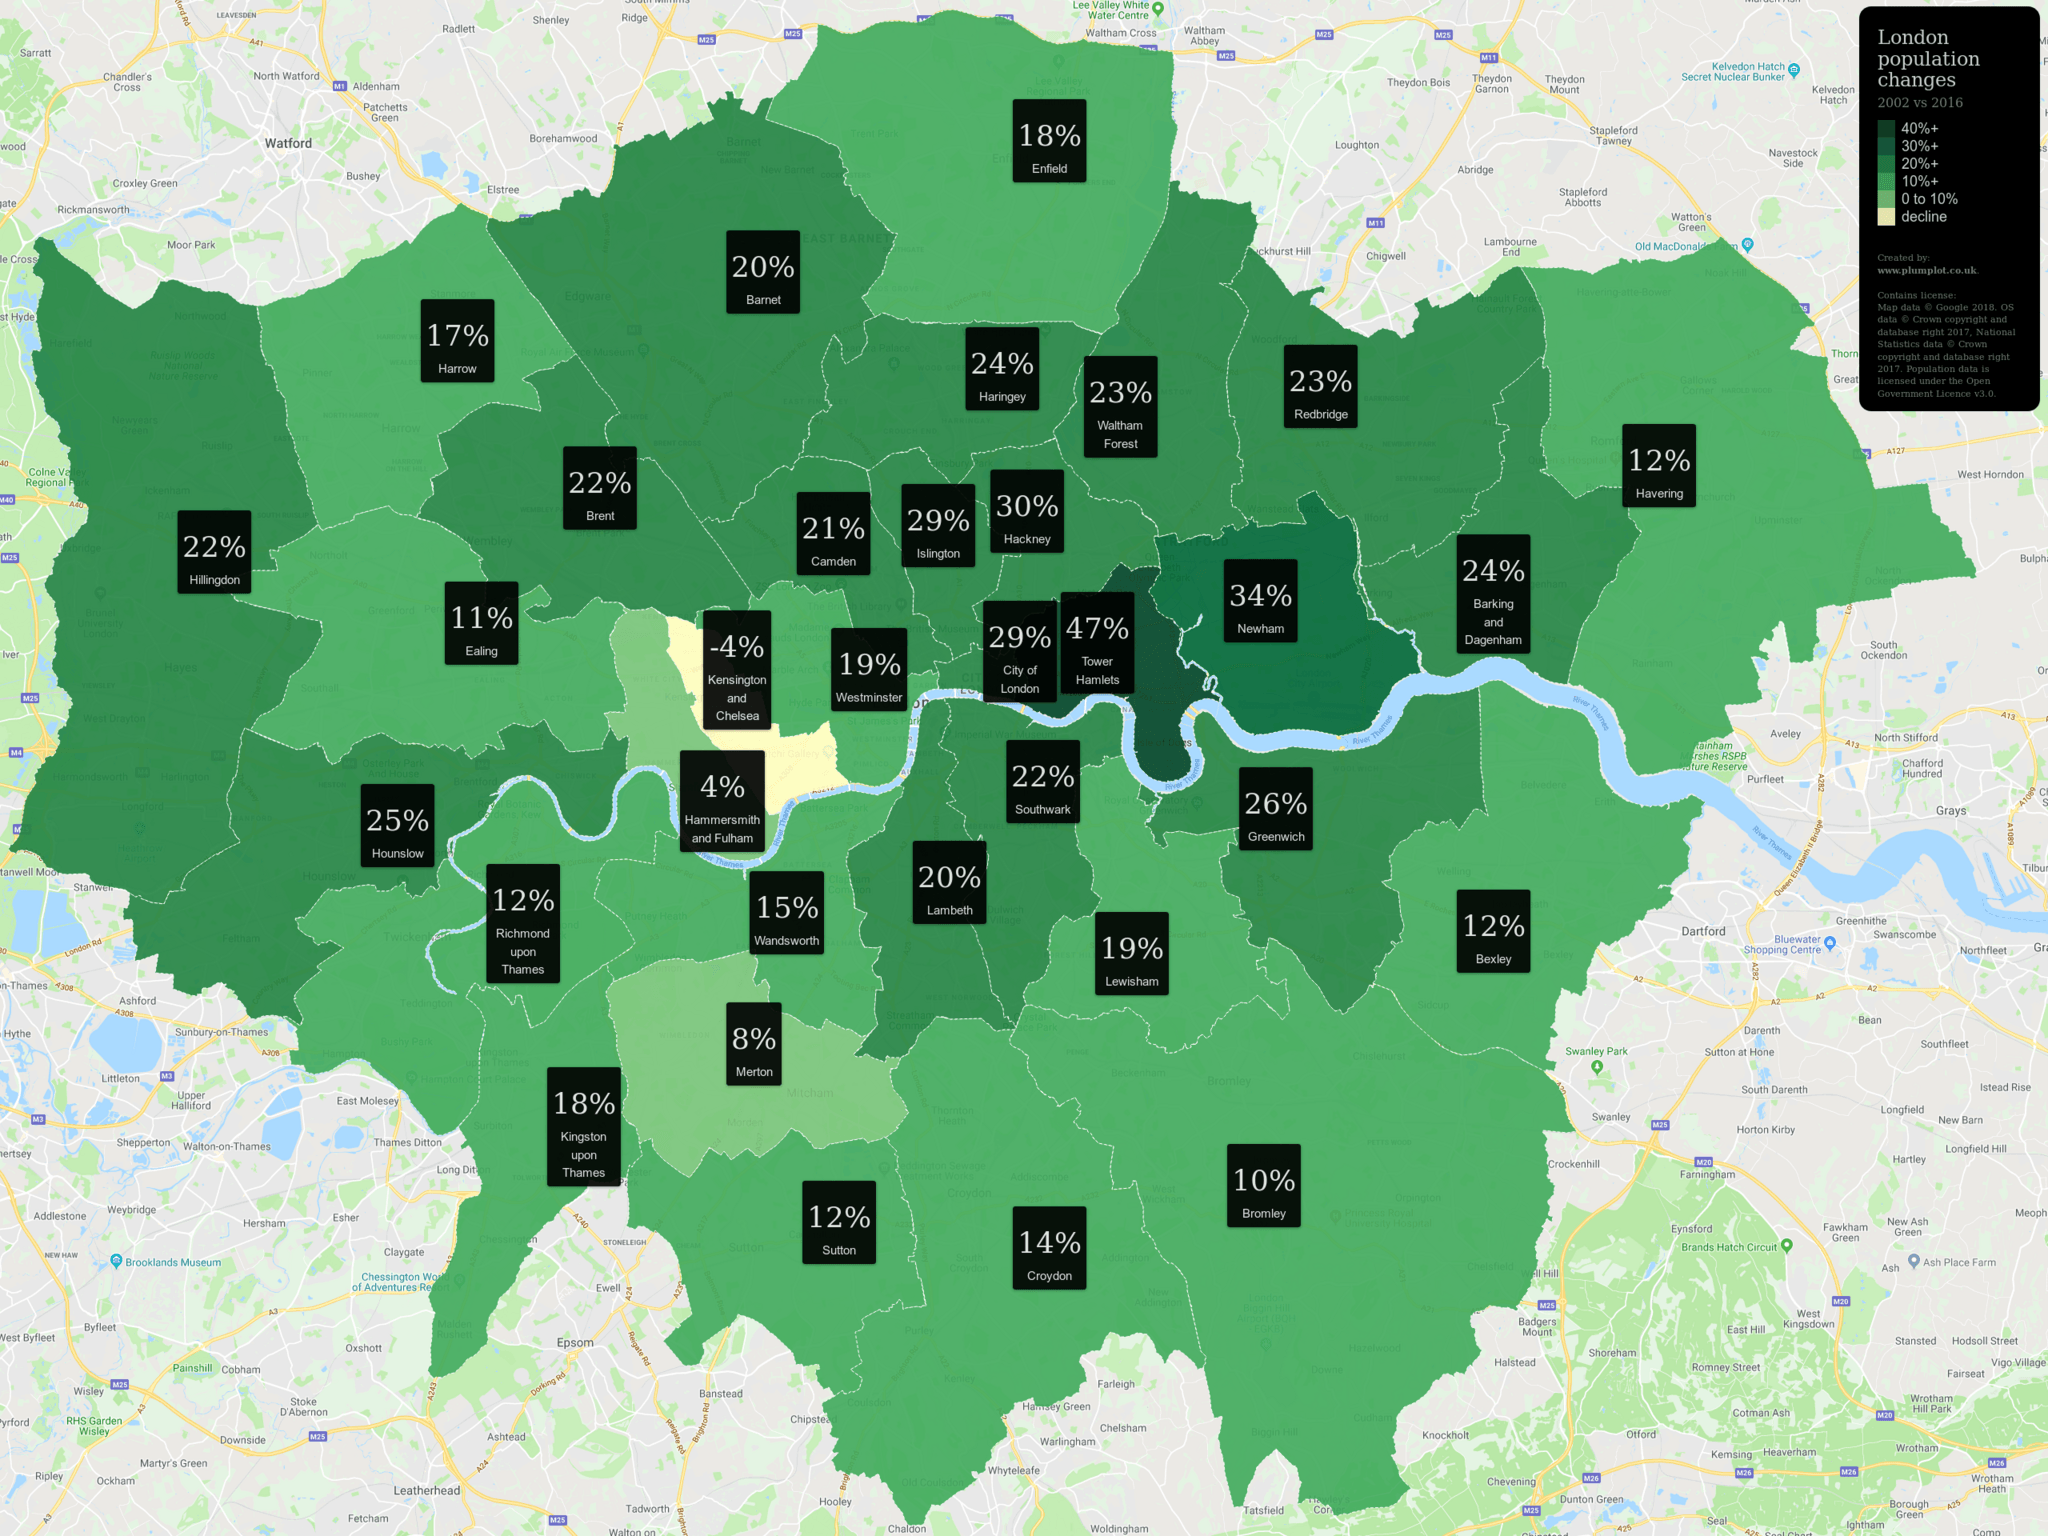
Interestingly, the growth of 19.1% from 2002 to 2016 did not result in an aging population. Compared to the other nine official regions of England and Wales, London is the only region where the average age remained almost unchanged - 35.8 years in 2002 compared to 36 years in 2016. In other regions, the average population age increased by more than one year.
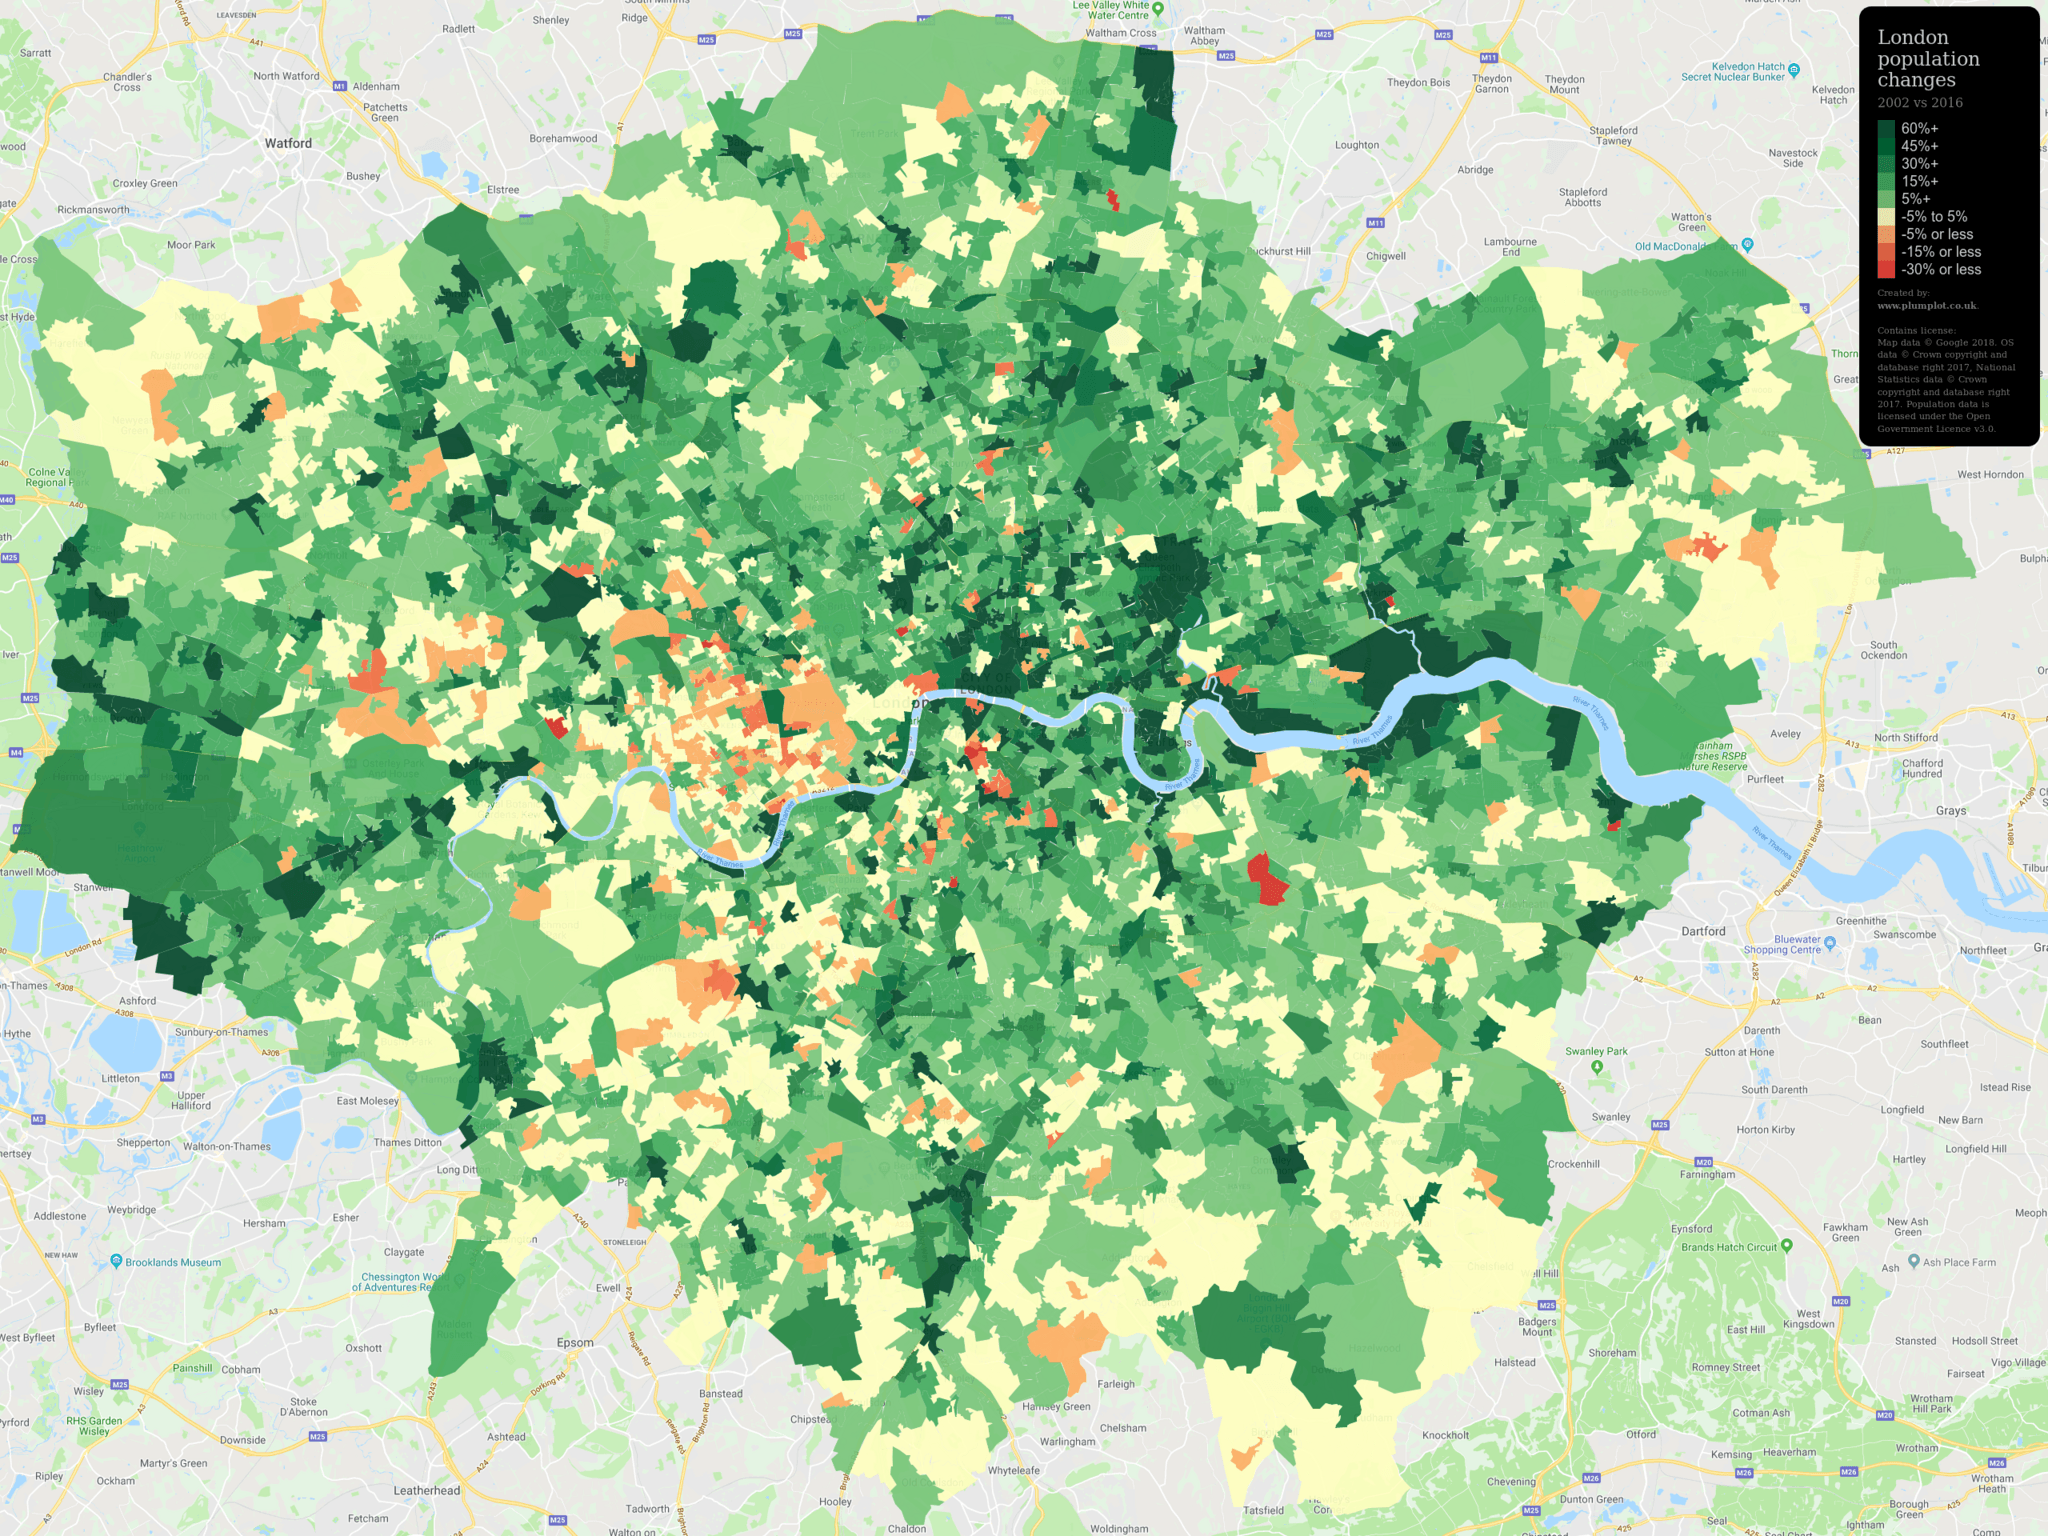
The following map shows the population changes on lower geographical units - showing that the increase is much more variable throughout each individual district, although the majority of the areas still register population growth.
Growth Driving Factors
London attracts people with its vast and thriving job market and its open migration policies. The decline in domestic migration is offset by a rise in international migration. According to statistics published by The Office for National Statistics in mid-2016, net domestic migration was -93,000, while net international immigration reached 126,100 over the previous 12 months.
Nonetheless, over 75% of London’s population growth between 2002 and 2016 resulted from natural change - births exceeding deaths. Estimates from mid-2016 indicated there were 129,800 births and 48,500 deaths over the previous 12 months, contributing a net increase of 81,300 to London’s population.
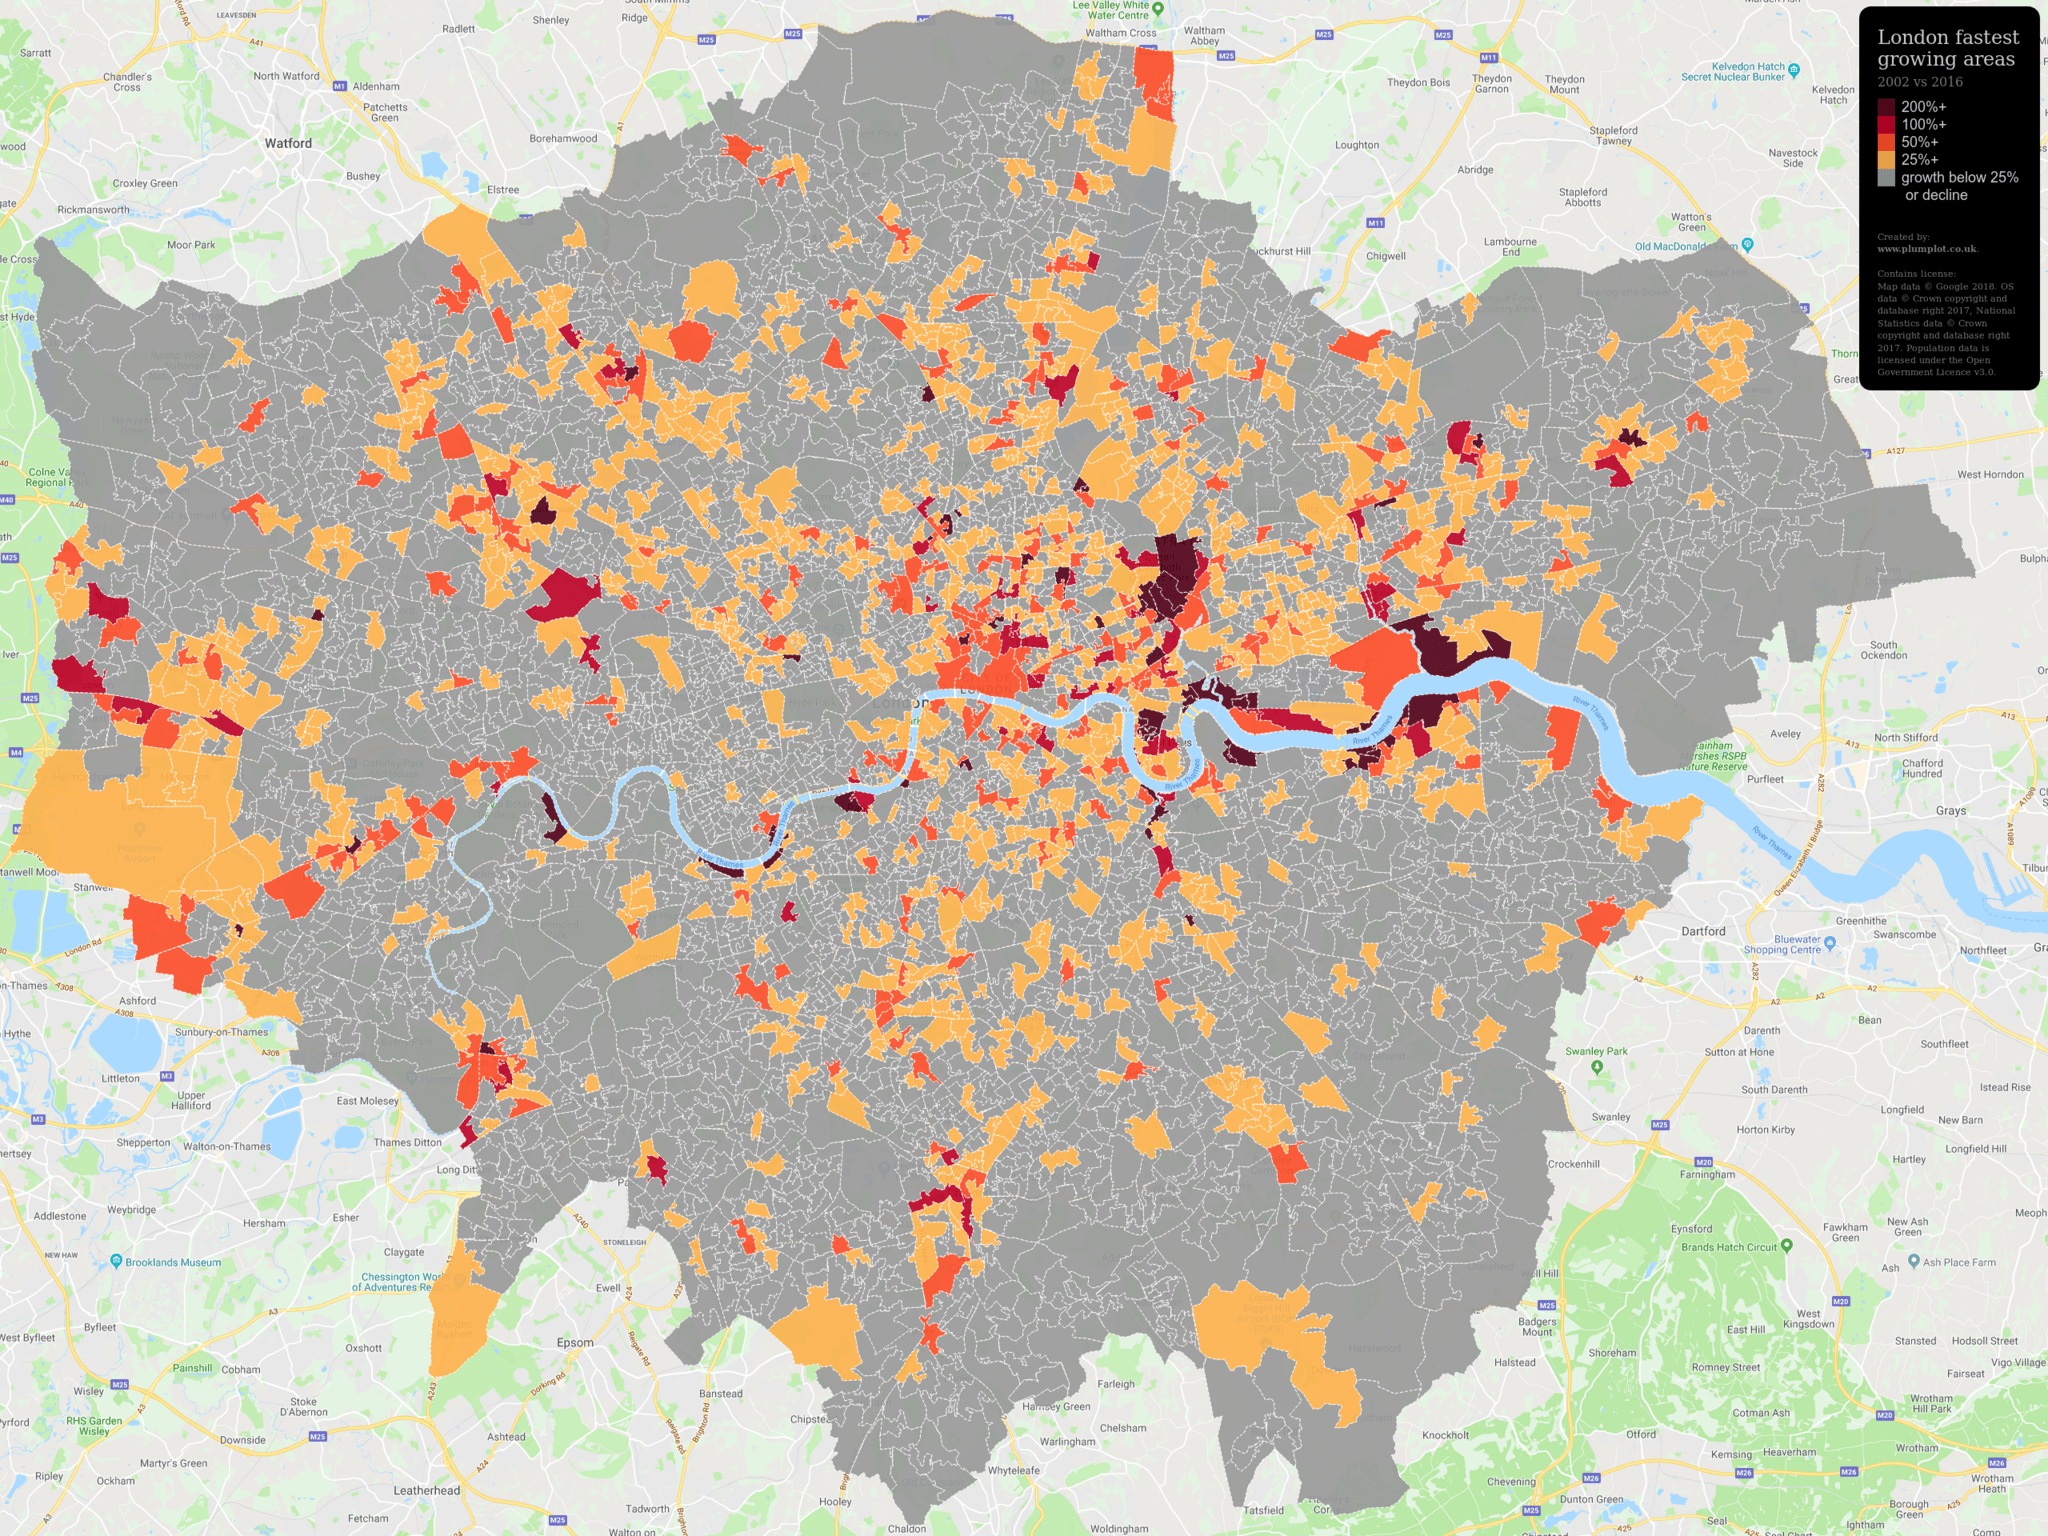
Fastest Growing Areas
The next map highlights areas with the highest population growth. Some areas saw their populations multiply significantly - most notably in Newham around Queen Elizabeth Olympic Park, the Royal Docks, and south of Canary Wharf in Tower Hamlets. The most pronounced growth occurred on and around the Isle of Dogs, as well as along the shores of the River Thames in Tower Hamlets, Newham, Greenwich, and Wandsworth.
Population Decline
Conversely, some areas in London are experiencing population decline despite overall borough increases. These areas are represented in blue on the map:
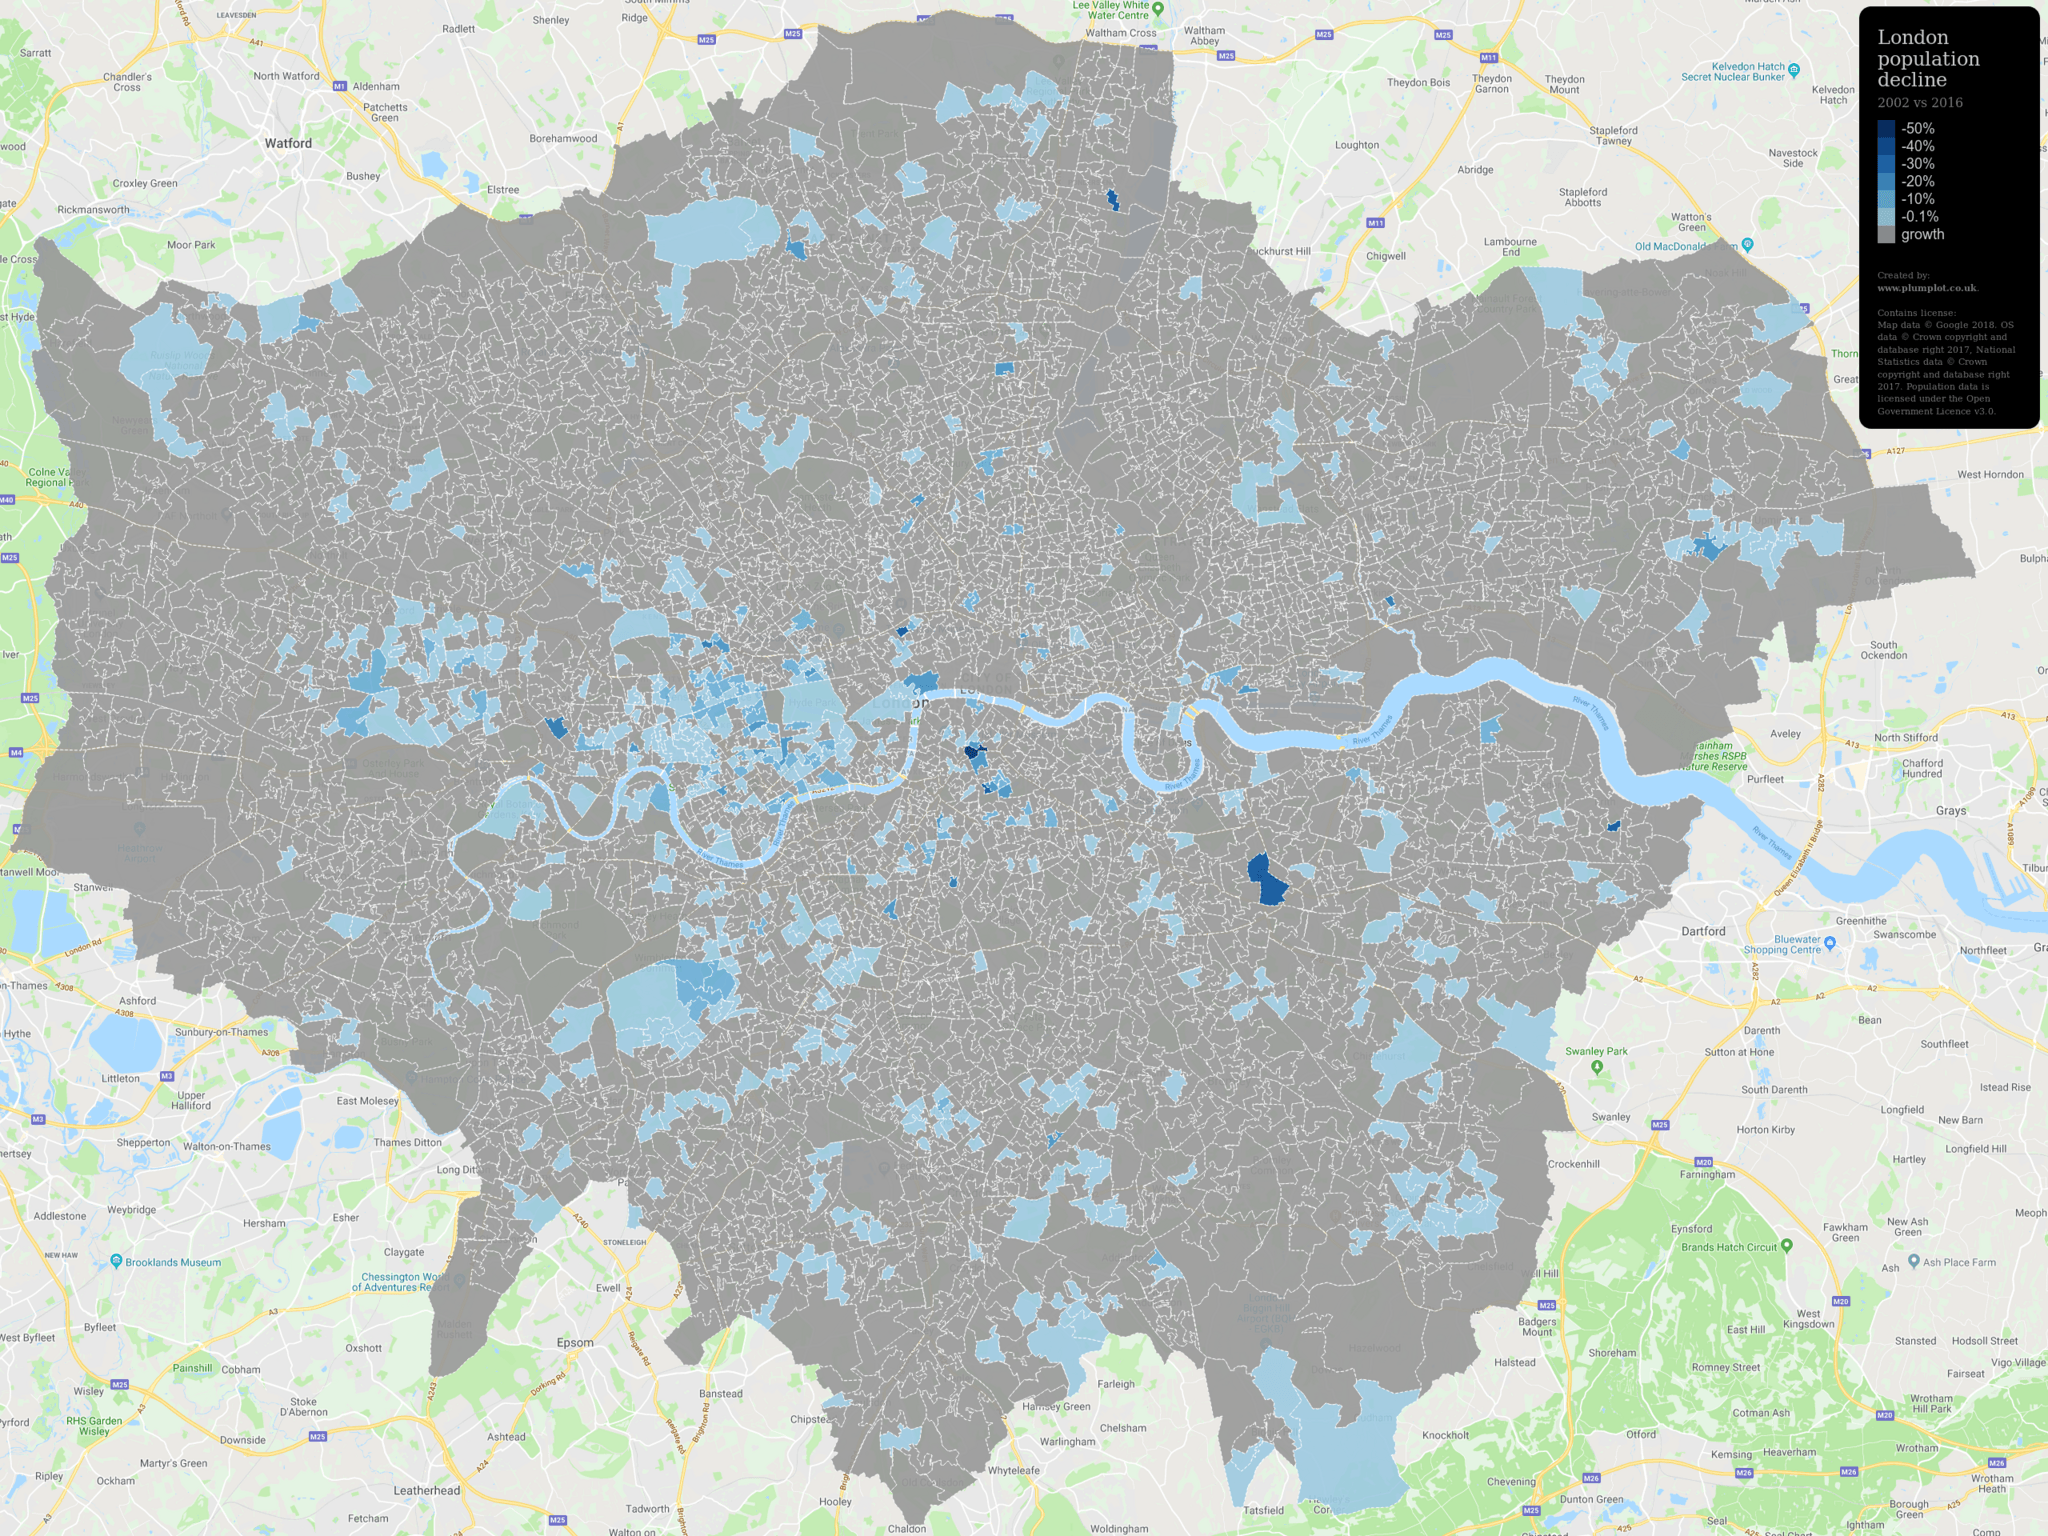
In some parts of Kensington, Westminster, Hammersmith, Ealing and Merton, the population decreased in spite of the overall increase of the populace of the whole borough. In Kensington and Westminster, it can be speculated that the decrease of the population is due to the high cost of living.
Consequences of Population Growth
Population growth significantly alters the city’s landscape. The transformation of the Docklands from an industrial area to a ‘post-industrial’ economy is one of the most visible changes in the UK. The Docklands, once neglected in the 1980s, are now thriving economically and socially, highlighted by the construction of Canary Wharf, which accommodates over 100,000 jobs. Plans for nearly 15,000 new homes along the riverfront have also been proposed, making riverside housing increasingly attractive to young professionals.
Challenges of Population Growth
However, this growth also brings challenges. For example, sections of property alongside the Thames Path - a 213-mile long pedestrian route showcasing iconic British sites - are being privatized by developers, disrupting public access to the riverside walkway. Additionally, the increase in population places pressure on services, the environment, and overall quality of life in London. As the city expands rapidly, access to social facilities and services in surrounding areas can become limited or even absent.
Next for London:
- London Census 2021
- London population

- London crime statistics

- London house prices

- London house prices per square metre

- London salary and unemployment

Contains OS data © Crown copyright and database right 2017, National Statistics data © Crown copyright and database right 2017 . Datasource: Population estimates . Other sources: The oldest and youngest areas of England, Historic population trends, How ‘new London’ developments are killing the river Thames, Privatised London: the Thames Path walk that resembles a prison corridor, After thirty years of Canary Wharf, how has it changed the geography of East London?