London property market
×
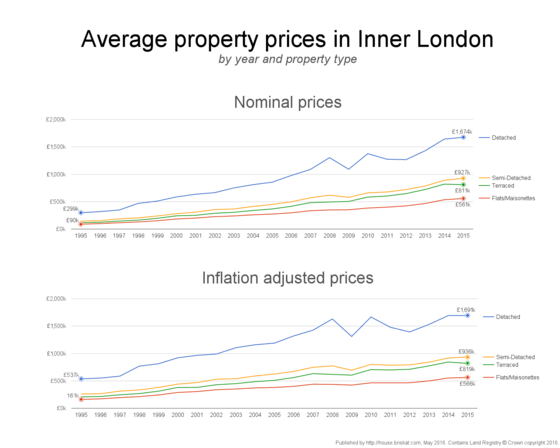
London property prices by property type
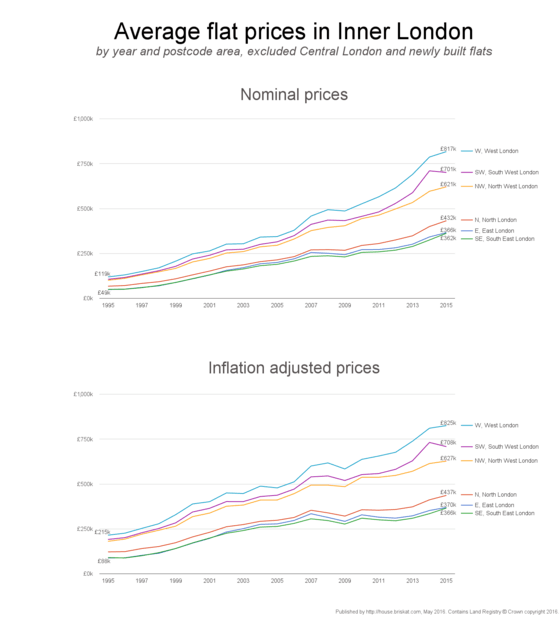
London flat prices
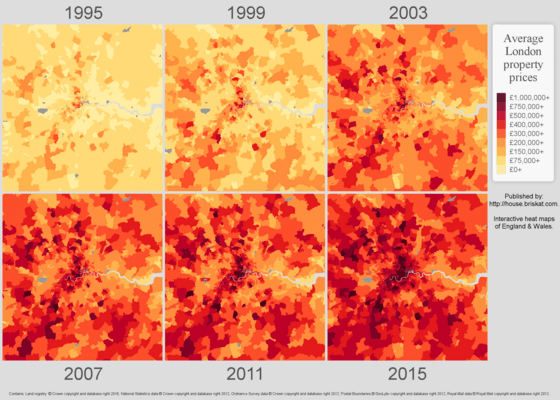
Heatmap of London historical property values
London mapped by newly built properties
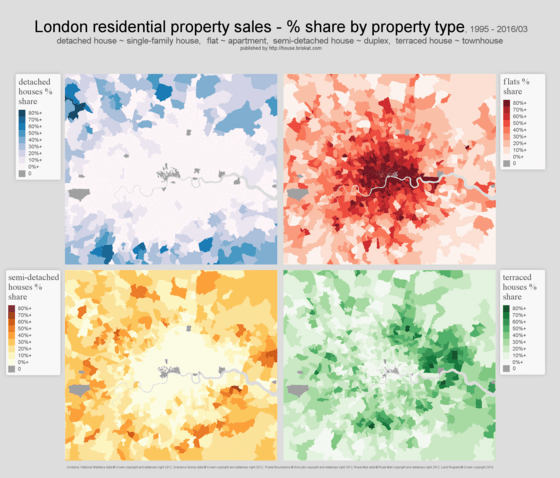
London mapped by residential property type
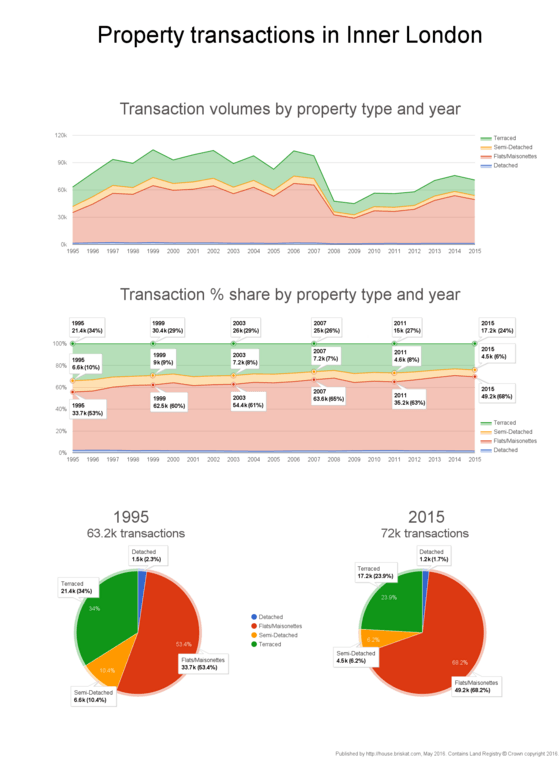
London property transactions by property type
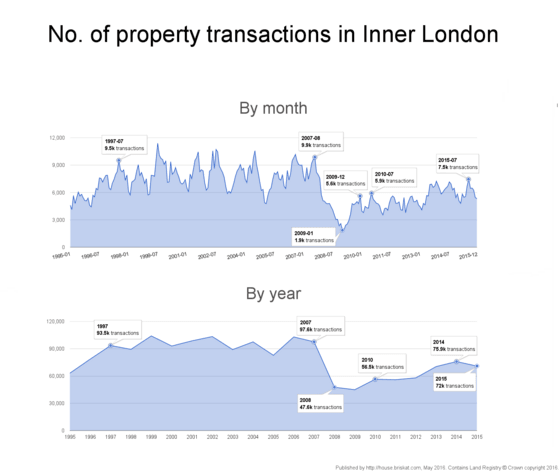
Monthly and annual London property transaction volumes
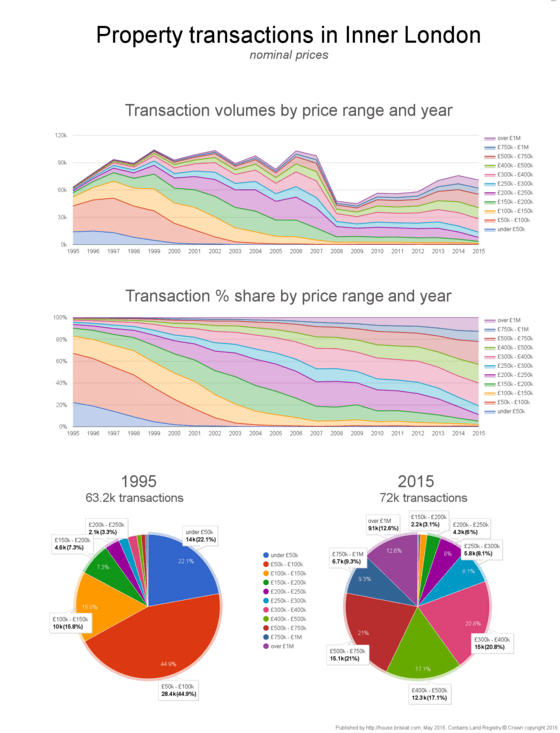
London property transactions by nominal price range
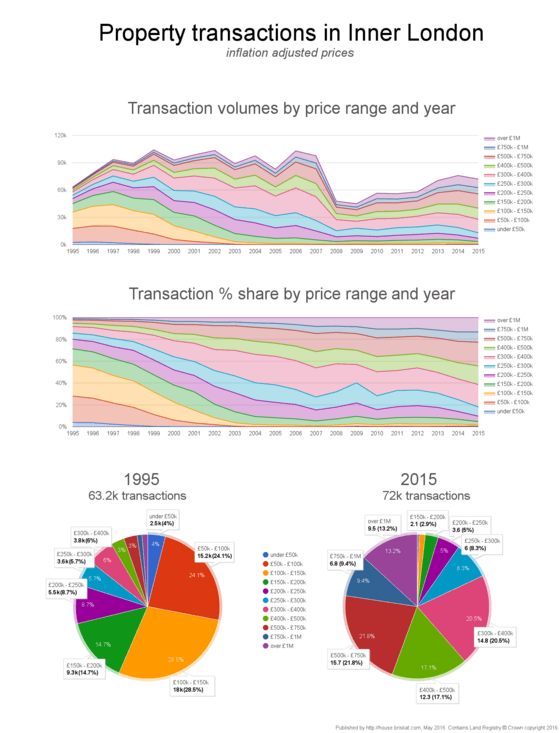
London property transactions by inflation adjusted price range
Contains public sector information licensed under the Open Government Licence v3.0., National Statistics data © Crown copyright and database right 2012, Ordnance Survey data © Crown copyright and database right 2012, Postal Boundaries © GeoLytix copyright and database right 2012, Royal Mail data © Royal Mail copyright and database right 2012 . Data sources: Price Paid Data , UK police data , UK Census 2011 .