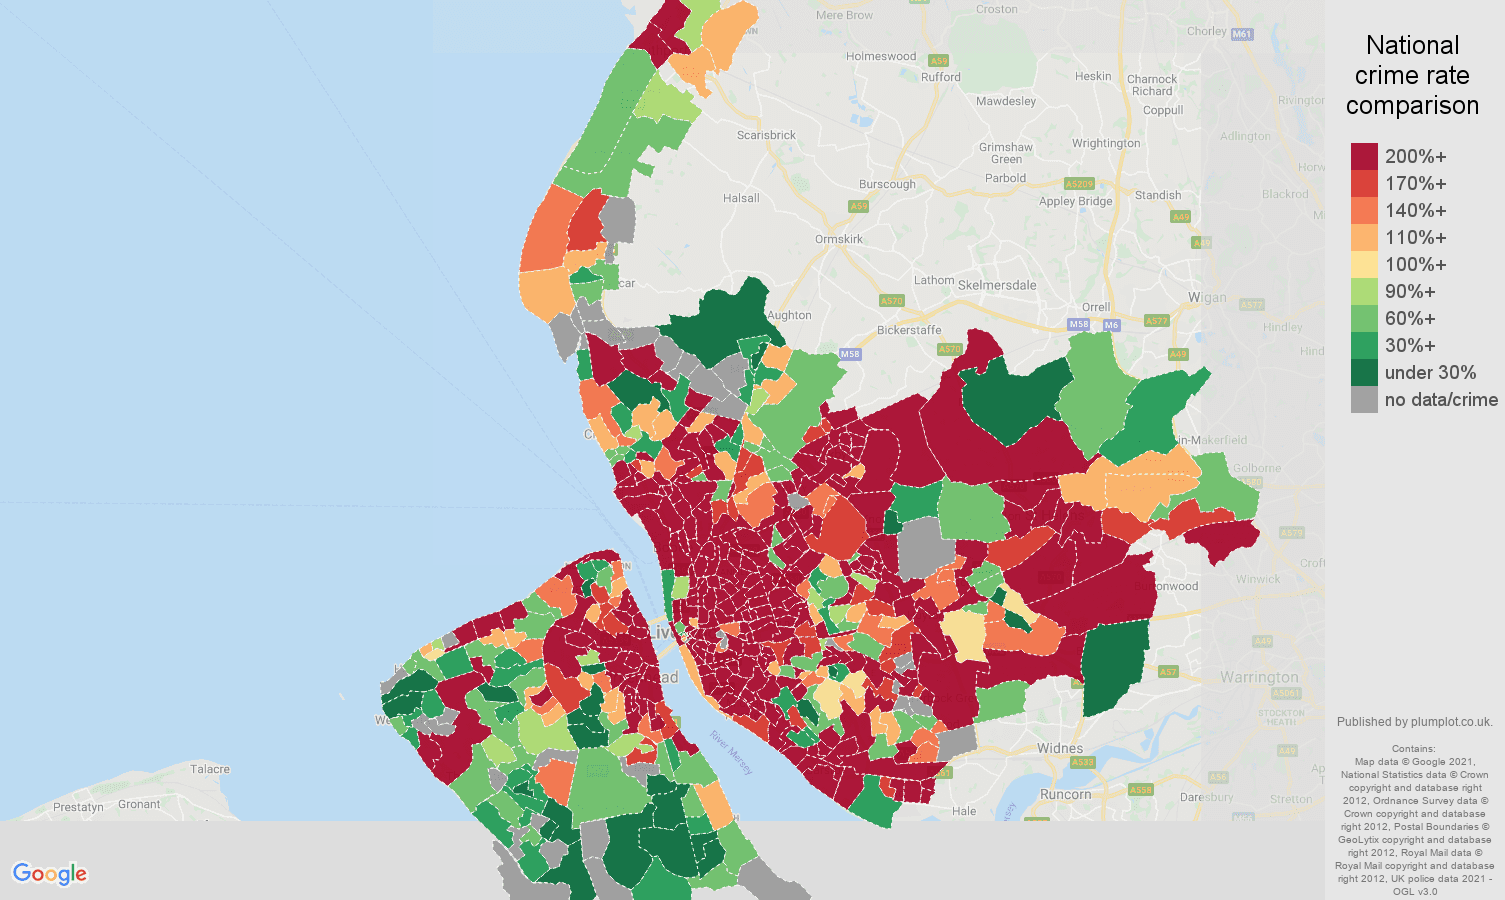
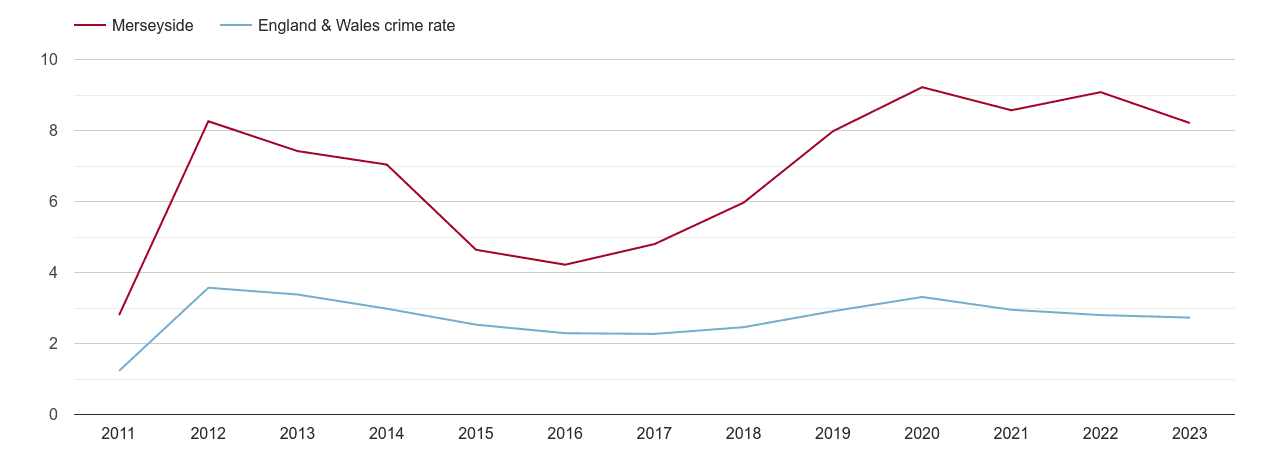
As of May 2026, the annual crime rate in Merseyside county stands at 10 crimes per 1000 people. Merseyside's current crime levels are at 282% of the national crime rate. Drugs crime makes up 8.9% of all crimes reported in the county. Drugs crime totalled 13.6k representing an increase 7.9% year-over-year.
| Merseyside county | crime statistic | England & Wales |
|---|---|---|
| 10 | annual crime rate per 1k workday people | 3.5 |
| 282% | ratio of national crime rate | 100% |
| 8.9% | share of all crimes | 3.5% |
| 13.6k | crimes reported | 197k |
| 7.9% | annual change | 9.8% |
| Postcode sector | Crime rate vs. ENG & WLS rate | Crime rate per 1000 workday people | Total number of crimes | |
|---|---|---|---|---|
| CH41 0 | 61% | 2 | 6 | |
| CH41 1 | 1219% | 43 | 70 | |
| CH41 2 | 804% | 28 | 113 | |
| CH41 3 | 485% | 17 | 36 | |
| CH41 4 | 261% | 9 | 45 | |
| CH41 5 | 282% | 10 | 45 | |
| CH41 6 | 690% | 24 | 108 | |
| CH41 7 | 181% | 6 | 20 | |
| CH41 8 | 651% | 23 | 79 | |
| CH41 9 | 291% | 10 | 37 | |
| CH42 0 | 328% | 12 | 27 | |
| CH42 1 | 280% | 10 | 30 | |
| CH42 2 | 271% | 10 | 19 | |
| CH42 3 | 290% | 10 | 20 | |
| CH42 4 | 181% | 6 | 21 | |
| CH42 5 | 289% | 10 | 24 | |
| CH42 6 | 74% | 3 | 7 | |
| CH42 7 | 210% | 7 | 13 | |
| CH42 8 | 45% | 2 | 3 | |
| CH42 9 | 118% | 4 | 14 | |
| CH43 0 | 18% | 1 | 2 | |
| CH43 1 | 161% | 6 | 14 | |
| CH43 2 | 61% | 2 | 6 | |
| CH43 3 | 71% | 3 | 8 | |
| CH43 4 | 374% | 13 | 33 | |
| CH43 5 | 73% | 3 | 6 | |
| CH43 6 | 128% | 5 | 6 | |
| CH43 7 | 188% | 7 | 34 | |
| CH43 8 | 95% | 3 | 4 | |
| CH43 9 | 62% | 2 | 12 | |
| CH44 0 | 173% | 6 | 14 | |
| CH44 1 | 210% | 7 | 16 | |
| CH44 2 | 171% | 6 | 13 | |
| CH44 3 | 59% | 2 | 4 | |
| CH44 4 | 73% | 3 | 10 | |
| CH44 5 | 134% | 5 | 17 | |
| CH44 6 | 372% | 13 | 37 | |
| CH44 7 | 310% | 11 | 32 | |
| CH44 8 | 187% | 7 | 15 | |
| CH44 9 | 284% | 10 | 26 | |
| CH45 0 | 68% | 2 | 3 | |
| CH45 1 | 145% | 5 | 11 | |
| CH45 2 | 237% | 8 | 16 | |
| CH45 3 | 56% | 2 | 5 | |
| CH45 4 | 109% | 4 | 14 | |
| CH45 5 | 83% | 3 | 10 | |
| CH45 7 | 74% | 3 | 8 | |
| CH45 8 | 147% | 5 | 16 | |
| CH45 9 | 43% | 2 | 2 | |
| CH46 0 | 92% | 3 | 10 | |
| CH46 1 | 141% | 5 | 13 | |
| CH46 2 | 153% | 5 | 11 | |
| CH46 3 | 47% | 2 | 2 | |
| CH46 4 | 107% | 4 | 1 | |
| CH46 5 | 347% | 12 | 5 | |
| CH46 6 | 99% | 4 | 13 | |
| CH46 7 | 118% | 4 | 10 | |
| CH46 8 | 115% | 4 | 13 | |
| CH46 9 | 77% | 3 | 6 | |
| CH47 0 | 32% | 1 | 1 | |
| CH47 2 | 132% | 5 | 9 | |
| CH47 3 | 30% | 1 | 2 | |
| CH47 4 | 26% | 1 | 1 | |
| CH47 8 | 221% | 8 | 2 | |
| CH47 9 | 80% | 3 | 2 | |
| CH48 0 | 121% | 4 | 6 | |
| CH48 1 | 46% | 2 | 2 | |
| CH48 2 | 62% | 2 | 2 | |
| CH48 3 | 65% | 2 | 3 | |
| CH48 5 | 27% | 1 | 2 | |
| CH48 6 | 34% | 1 | 2 | |
| CH48 7 | 39% | 1 | 1 | |
| CH48 9 | 23% | 1 | 1 | |
| CH49 0 | 83% | 3 | 6 | |
| CH49 1 | 19% | 1 | 1 | |
| CH49 3 | 34% | 1 | 3 | |
| CH49 4 | 62% | 2 | 8 | |
| CH49 5 | 101% | 4 | 21 | |
| CH49 6 | 34% | 1 | 3 | |
| CH49 7 | 103% | 4 | 9 | |
| CH49 8 | 96% | 3 | 7 | |
| CH49 9 | 187% | 7 | 12 | |
| CH60 0 | 64% | 2 | 3 | |
| CH60 2 | 28% | 1 | 1 | |
| CH60 5 | 32% | 1 | 2 | |
| CH60 6 | 139% | 5 | 5 | |
| CH60 7 | 52% | 2 | 3 | |
| CH60 8 | 27% | 1 | 1 | |
| CH61 0 | 122% | 4 | 2 | |
| CH61 2 | 57% | 2 | 1 | |
| CH61 3 | 70% | 2 | 3 | |
| CH61 6 | 31% | 1 | 2 | |
| CH61 7 | 47% | 2 | 2 | |
| CH61 8 | 71% | 3 | 4 | |
| CH61 9 | 112% | 4 | 6 | |
| CH62 0 | 129% | 5 | 7 | |
| CH62 1 | 450% | 16 | 36 | |
| CH62 2 | 60% | 2 | 5 | |
| CH62 3 | 83% | 3 | 7 | |
| CH62 4 | 22% | 1 | 3 | |
| CH62 5 | 159% | 6 | 15 | |
| CH62 6 | 69% | 2 | 6 | |
| CH62 7 | 60% | 2 | 15 | |
| CH62 8 | 32% | 1 | 4 | |
| CH62 9 | 92% | 3 | 8 | |
| CH63 2 | 26% | 1 | 3 | |
| CH63 3 | 13% | 0 | 2 | |
| CH63 5 | 85% | 3 | 9 | |
| CH63 7 | 50% | 2 | 6 | |
| CH63 8 | 75% | 3 | 6 | |
| CH63 9 | 26% | 1 | 4 | |
| CH64 3 | 14% | 0 | 1 | |
| CH64 7 | 106% | 4 | 3 | |
| CH65 1 | 489% | 17 | 2 | |
| L1 0 | 52156% | 1840 | 46 | |
| L1 1 | 2855% | 101 | 430 | |
| L1 2 | 593% | 21 | 34 | |
| L1 3 | 892% | 31 | 136 | |
| L1 4 | 3997% | 141 | 762 | |
| L1 5 | 1782% | 63 | 246 | |
| L1 6 | 1699% | 60 | 274 | |
| L1 7 | 1354% | 48 | 46 | |
| L1 8 | 1913% | 67 | 134 | |
| L1 9 | 981% | 35 | 78 | |
| L10 0 | 633% | 22 | 12 | |
| L10 1 | 105% | 4 | 11 | |
| L10 2 | 63% | 2 | 3 | |
| L10 3 | 271% | 10 | 9 | |
| L10 4 | 46% | 2 | 4 | |
| L10 7 | 303% | 11 | 16 | |
| L10 8 | 31% | 1 | 2 | |
| L10 9 | 203% | 7 | 9 | |
| L11 0 | 186% | 7 | 13 | |
| L11 1 | 739% | 26 | 70 | |
| L11 2 | 368% | 13 | 41 | |
| L11 3 | 415% | 15 | 44 | |
| L11 4 | 408% | 14 | 31 | |
| L11 5 | 128% | 5 | 6 | |
| L11 6 | 207% | 7 | 6 | |
| L11 7 | 170% | 6 | 15 | |
| L11 8 | 254% | 9 | 13 | |
| L11 9 | 196% | 7 | 14 | |
| L12 0 | 73% | 3 | 15 | |
| L12 1 | 169% | 6 | 6 | |
| L12 2 | 104% | 4 | 6 | |
| L12 3 | 19% | 1 | 1 | |
| L12 4 | 235% | 8 | 17 | |
| L12 5 | 128% | 5 | 11 | |
| L12 6 | 342% | 12 | 16 | |
| L12 7 | 146% | 5 | 10 | |
| L12 8 | 125% | 4 | 10 | |
| L12 9 | 102% | 4 | 12 | |
| L13 0 | 218% | 8 | 13 | |
| L13 1 | 198% | 7 | 16 | |
| L13 2 | 577% | 20 | 55 | |
| L13 3 | 136% | 5 | 18 | |
| L13 4 | 130% | 5 | 14 | |
| L13 5 | 128% | 5 | 19 | |
| L13 6 | 118% | 4 | 11 | |
| L13 7 | 261% | 9 | 32 | |
| L13 8 | 399% | 14 | 38 | |
| L13 9 | 336% | 12 | 25 | |
| L14 0 | 205% | 7 | 27 | |
| L14 1 | 265% | 9 | 15 | |
| L14 2 | 161% | 6 | 13 | |
| L14 3 | 130% | 5 | 12 | |
| L14 4 | 255% | 9 | 13 | |
| L14 5 | 76% | 3 | 9 | |
| L14 6 | 49% | 2 | 3 | |
| L14 7 | 113% | 4 | 9 | |
| L14 8 | 366% | 13 | 24 | |
| L14 9 | 261% | 9 | 28 | |
| L15 0 | 437% | 15 | 37 | |
| L15 1 | 224% | 8 | 16 | |
| L15 2 | 268% | 9 | 17 | |
| L15 3 | 77% | 3 | 10 | |
| L15 4 | 133% | 5 | 21 | |
| L15 5 | 156% | 6 | 10 | |
| L15 6 | 76% | 3 | 7 | |
| L15 7 | 43% | 2 | 3 | |
| L15 8 | 215% | 8 | 22 | |
| L15 9 | 254% | 9 | 10 | |
| L16 0 | 36% | 1 | 1 | |
| L16 1 | 37% | 1 | 1 | |
| L16 2 | 78% | 3 | 4 | |
| L16 3 | 104% | 4 | 5 | |
| L16 5 | 31% | 1 | 1 | |
| L16 6 | 45% | 2 | 1 | |
| L16 7 | 21% | 1 | 1 | |
| L16 9 | 10% | 0 | 1 | |
| L17 0 | 63% | 2 | 6 | |
| L17 1 | 443% | 16 | 18 | |
| L17 2 | 171% | 6 | 9 | |
| L17 3 | 164% | 6 | 10 | |
| L17 4 | 514% | 18 | 21 | |
| L17 5 | 556% | 20 | 19 | |
| L17 6 | 97% | 3 | 8 | |
| L17 7 | 120% | 4 | 13 | |
| L17 8 | 368% | 13 | 26 | |
| L17 9 | 73% | 3 | 4 | |
| L18 1 | 63% | 2 | 10 | |
| L18 2 | 59% | 2 | 3 | |
| L18 3 | 70% | 2 | 6 | |
| L18 4 | 58% | 2 | 3 | |
| L18 5 | 39% | 1 | 3 | |
| L18 6 | 81% | 3 | 6 | |
| L18 7 | 60% | 2 | 4 | |
| L18 8 | 55% | 2 | 6 | |
| L18 9 | 59% | 2 | 5 | |
| L19 0 | 113% | 4 | 8 | |
| L19 1 | 40% | 1 | 2 | |
| L19 2 | 88% | 3 | 21 | |
| L19 3 | 75% | 3 | 4 | |
| L19 4 | 167% | 6 | 13 | |
| L19 5 | 82% | 3 | 4 | |
| L19 6 | 264% | 9 | 9 | |
| L19 7 | 40% | 1 | 1 | |
| L19 8 | 394% | 14 | 37 | |
| L19 9 | 46% | 2 | 4 | |
| L2 0 | 318% | 11 | 28 | |
| L2 2 | 1080% | 38 | 125 | |
| L2 3 | 590% | 21 | 22 | |
| L2 4 | 174% | 6 | 20 | |
| L2 5 | 1689% | 60 | 89 | |
| L2 6 | 1103% | 39 | 93 | |
| L2 7 | 694% | 24 | 59 | |
| L2 8 | 84% | 3 | 2 | |
| L2 9 | 392% | 14 | 8 | |
| L20 0 | 245% | 9 | 21 | |
| L20 1 | 1854% | 65 | 7 | |
| L20 2 | 317% | 11 | 29 | |
| L20 3 | 319% | 11 | 50 | |
| L20 4 | 298% | 11 | 84 | |
| L20 5 | 514% | 18 | 45 | |
| L20 6 | 176% | 6 | 35 | |
| L20 7 | 683% | 24 | 127 | |
| L20 8 | 527% | 19 | 25 | |
| L20 9 | 230% | 8 | 42 | |
| L21 0 | 347% | 12 | 40 | |
| L21 1 | 138% | 5 | 15 | |
| L21 2 | 124% | 4 | 4 | |
| L21 3 | 470% | 17 | 8 | |
| L21 4 | 247% | 9 | 11 | |
| L21 5 | 179% | 6 | 7 | |
| L21 6 | 829% | 29 | 22 | |
| L21 7 | 158% | 6 | 15 | |
| L21 8 | 489% | 17 | 52 | |
| L21 9 | 158% | 6 | 19 | |
| L22 0 | 140% | 5 | 8 | |
| L22 1 | 236% | 8 | 8 | |
| L22 2 | 54% | 2 | 2 | |
| L22 3 | 126% | 4 | 8 | |
| L22 4 | 81% | 3 | 4 | |
| L22 5 | 181% | 6 | 12 | |
| L22 6 | 35% | 1 | 1 | |
| L22 7 | 76% | 3 | 2 | |
| L22 8 | 363% | 13 | 10 | |
| L22 9 | 51% | 2 | 2 | |
| L23 0 | 42% | 1 | 6 | |
| L23 1 | 200% | 7 | 11 | |
| L23 2 | 79% | 3 | 10 | |
| L23 3 | 63% | 2 | 4 | |
| L23 4 | 110% | 4 | 4 | |
| L23 5 | 91% | 3 | 7 | |
| L23 6 | 138% | 5 | 12 | |
| L23 7 | 38% | 1 | 3 | |
| L23 8 | 171% | 6 | 11 | |
| L23 9 | 66% | 2 | 9 | |
| L24 0 | 248% | 9 | 15 | |
| L24 1 | 131% | 5 | 33 | |
| L24 2 | 155% | 5 | 21 | |
| L24 3 | 107% | 4 | 22 | |
| L24 6 | 302% | 11 | 10 | |
| L24 7 | 424% | 15 | 15 | |
| L24 9 | 106% | 4 | 6 | |
| L25 0 | 84% | 3 | 14 | |
| L25 1 | 51% | 2 | 3 | |
| L25 2 | 372% | 13 | 49 | |
| L25 3 | 132% | 5 | 10 | |
| L25 4 | 67% | 2 | 4 | |
| L25 5 | 162% | 6 | 17 | |
| L25 6 | 27% | 1 | 2 | |
| L25 7 | 91% | 3 | 12 | |
| L25 8 | 83% | 3 | 7 | |
| L25 9 | 59% | 2 | 7 | |
| L26 0 | 280% | 10 | 17 | |
| L26 1 | 327% | 12 | 27 | |
| L26 2 | 855% | 30 | 6 | |
| L26 3 | 344% | 12 | 3 | |
| L26 6 | 102% | 4 | 3 | |
| L26 7 | 48% | 2 | 4 | |
| L26 9 | 131% | 5 | 25 | |
| L27 1 | 195% | 7 | 9 | |
| L27 4 | 182% | 6 | 2 | |
| L27 5 | 157% | 6 | 4 | |
| L27 6 | 179% | 6 | 5 | |
| L27 7 | 197% | 7 | 9 | |
| L27 8 | 82% | 3 | 2 | |
| L28 0 | 512% | 18 | 12 | |
| L28 1 | 519% | 18 | 28 | |
| L28 3 | 578% | 20 | 3 | |
| L28 4 | 384% | 14 | 11 | |
| L28 5 | 803% | 28 | 19 | |
| L28 6 | 543% | 19 | 6 | |
| L28 7 | 769% | 27 | 13 | |
| L28 8 | 81% | 3 | 1 | |
| L29 1 | 3543% | 125 | 5 | |
| L3 0 | 106% | 4 | 2 | |
| L3 1 | 308% | 11 | 44 | |
| L3 2 | 252% | 9 | 44 | |
| L3 3 | 2826% | 100 | 137 | |
| L3 4 | 251% | 9 | 76 | |
| L3 5 | 375% | 13 | 93 | |
| L3 6 | 1331% | 47 | 198 | |
| L3 7 | 1089% | 38 | 25 | |
| L3 8 | 2341% | 83 | 297 | |
| L3 9 | 116% | 4 | 42 | |
| L30 0 | 251% | 9 | 14 | |
| L30 1 | 109% | 4 | 21 | |
| L30 2 | 363% | 13 | 32 | |
| L30 3 | 423% | 15 | 25 | |
| L30 5 | 415% | 15 | 35 | |
| L30 6 | 172% | 6 | 4 | |
| L30 7 | 639% | 23 | 52 | |
| L30 8 | 86% | 3 | 4 | |
| L30 9 | 52% | 2 | 3 | |
| L31 0 | 80% | 3 | 5 | |
| L31 1 | 145% | 5 | 22 | |
| L31 2 | 66% | 2 | 6 | |
| L31 3 | 158% | 6 | 9 | |
| L31 5 | 36% | 1 | 3 | |
| L31 6 | 83% | 3 | 7 | |
| L31 7 | 21% | 1 | 2 | |
| L31 8 | 22% | 1 | 2 | |
| L31 9 | 38% | 1 | 4 | |
| L32 0 | 492% | 17 | 44 | |
| L32 1 | 107% | 4 | 4 | |
| L32 2 | 149% | 5 | 8 | |
| L32 3 | 425% | 15 | 14 | |
| L32 4 | 272% | 10 | 13 | |
| L32 5 | 1449% | 51 | 34 | |
| L32 6 | 102% | 4 | 13 | |
| L32 7 | 211% | 7 | 18 | |
| L32 8 | 465% | 16 | 51 | |
| L32 9 | 263% | 9 | 23 | |
| L33 0 | 592% | 21 | 27 | |
| L33 1 | 210% | 7 | 25 | |
| L33 2 | 283% | 10 | 8 | |
| L33 5 | 177% | 6 | 18 | |
| L33 6 | 253% | 9 | 22 | |
| L33 7 | 263% | 9 | 14 | |
| L33 8 | 427% | 15 | 13 | |
| L33 9 | 234% | 8 | 18 | |
| L34 0 | 52% | 2 | 6 | |
| L34 1 | 205% | 7 | 23 | |
| L34 2 | 66% | 2 | 6 | |
| L34 3 | 331% | 12 | 10 | |
| L34 4 | 209% | 7 | 4 | |
| L34 5 | 909% | 32 | 82 | |
| L34 6 | 587% | 21 | 33 | |
| L34 8 | 166% | 6 | 6 | |
| L35 0 | 36% | 1 | 3 | |
| L35 1 | 58% | 2 | 4 | |
| L35 2 | 222% | 8 | 33 | |
| L35 3 | 265% | 9 | 59 | |
| L35 4 | 101% | 4 | 8 | |
| L35 5 | 398% | 14 | 49 | |
| L35 6 | 239% | 8 | 12 | |
| L35 7 | 107% | 4 | 7 | |
| L35 8 | 23% | 1 | 4 | |
| L35 9 | 76% | 3 | 3 | |
| L36 0 | 244% | 9 | 35 | |
| L36 1 | 276% | 10 | 20 | |
| L36 2 | 315% | 11 | 43 | |
| L36 3 | 489% | 17 | 65 | |
| L36 4 | 115% | 4 | 17 | |
| L36 5 | 133% | 5 | 20 | |
| L36 6 | 441% | 16 | 49 | |
| L36 7 | 477% | 17 | 64 | |
| L36 8 | 364% | 13 | 48 | |
| L36 9 | 214% | 8 | 24 | |
| L37 1 | 80% | 3 | 6 | |
| L37 2 | 54% | 2 | 7 | |
| L37 3 | 64% | 2 | 9 | |
| L37 4 | 101% | 4 | 11 | |
| L37 6 | 57% | 2 | 5 | |
| L37 7 | 59% | 2 | 6 | |
| L37 8 | 58% | 2 | 3 | |
| L38 1 | 324% | 11 | 2 | |
| L38 6 | 258% | 9 | 2 | |
| L38 9 | 125% | 4 | 3 | |
| L4 0 | 692% | 24 | 68 | |
| L4 1 | 692% | 24 | 55 | |
| L4 2 | 663% | 23 | 102 | |
| L4 3 | 564% | 20 | 66 | |
| L4 4 | 980% | 35 | 138 | |
| L4 5 | 671% | 24 | 110 | |
| L4 6 | 305% | 11 | 26 | |
| L4 7 | 226% | 8 | 20 | |
| L4 8 | 416% | 15 | 33 | |
| L4 9 | 232% | 8 | 37 | |
| L5 0 | 388% | 14 | 21 | |
| L5 1 | 297% | 10 | 6 | |
| L5 2 | 1001% | 35 | 43 | |
| L5 3 | 647% | 23 | 37 | |
| L5 4 | 353% | 12 | 17 | |
| L5 5 | 681% | 24 | 39 | |
| L5 6 | 711% | 25 | 53 | |
| L5 7 | 491% | 17 | 27 | |
| L5 8 | 501% | 18 | 29 | |
| L5 9 | 306% | 11 | 32 | |
| L6 0 | 1024% | 36 | 73 | |
| L6 1 | 773% | 27 | 68 | |
| L6 2 | 562% | 20 | 42 | |
| L6 3 | 1067% | 38 | 61 | |
| L6 4 | 573% | 20 | 73 | |
| L6 5 | 384% | 14 | 37 | |
| L6 6 | 618% | 22 | 53 | |
| L6 7 | 2672% | 94 | 74 | |
| L6 8 | 956% | 34 | 42 | |
| L6 9 | 898% | 32 | 43 | |
| L7 0 | 739% | 26 | 124 | |
| L7 1 | 177% | 6 | 5 | |
| L7 2 | 881% | 31 | 53 | |
| L7 3 | 261% | 9 | 31 | |
| L7 4 | 324% | 11 | 5 | |
| L7 5 | 1202% | 42 | 31 | |
| L7 6 | 380% | 13 | 24 | |
| L7 7 | 178% | 6 | 25 | |
| L7 8 | 144% | 5 | 46 | |
| L7 9 | 512% | 18 | 30 | |
| L8 0 | 479% | 17 | 97 | |
| L8 1 | 1058% | 37 | 52 | |
| L8 2 | 232% | 8 | 16 | |
| L8 3 | 492% | 17 | 45 | |
| L8 4 | 388% | 14 | 43 | |
| L8 5 | 728% | 26 | 42 | |
| L8 6 | 288% | 10 | 33 | |
| L8 7 | 531% | 19 | 95 | |
| L8 8 | 469% | 17 | 62 | |
| L8 9 | 155% | 5 | 12 | |
| L9 0 | 203% | 7 | 26 | |
| L9 1 | 332% | 12 | 77 | |
| L9 2 | 261% | 9 | 21 | |
| L9 3 | 85% | 3 | 10 | |
| L9 4 | 434% | 15 | 19 | |
| L9 5 | 209% | 7 | 5 | |
| L9 6 | 371% | 13 | 49 | |
| L9 7 | 100% | 4 | 15 | |
| L9 8 | 84% | 3 | 11 | |
| L9 9 | 81% | 3 | 19 | |
| PR8 1 | 503% | 18 | 129 | |
| PR8 2 | 83% | 3 | 24 | |
| PR8 3 | 70% | 2 | 23 | |
| PR8 4 | 46% | 2 | 14 | |
| PR8 6 | 90% | 3 | 40 | |
| PR9 0 | 512% | 18 | 192 | |
| PR9 7 | 107% | 4 | 35 | |
| PR9 9 | 84% | 3 | 35 | |
| WA10 1 | 515% | 18 | 143 | |
| WA10 2 | 533% | 19 | 133 | |
| WA10 3 | 224% | 8 | 80 | |
| WA10 4 | 265% | 9 | 54 | |
| WA10 5 | 59% | 2 | 9 | |
| WA10 6 | 177% | 6 | 36 | |
| WA11 0 | 115% | 4 | 54 | |
| WA11 7 | 338% | 12 | 70 | |
| WA11 8 | 37% | 1 | 7 | |
| WA11 9 | 113% | 4 | 46 | |
| WA12 0 | 80% | 3 | 13 | |
| WA12 8 | 251% | 9 | 48 | |
| WA12 9 | 183% | 6 | 59 | |
| WA8 3 | 81% | 3 | 14 | |
| WA8 4 | 259% | 9 | 42 | |
| WA8 5 | 196% | 7 | 13 | |
| WA9 1 | 646% | 23 | 170 | |
| WA9 2 | 434% | 15 | 82 | |
| WA9 3 | 330% | 12 | 130 | |
| WA9 4 | 203% | 7 | 78 | |
| WA9 5 | 281% | 10 | 117 | |
| WN4 0 | 24% | 1 | 6 | |
| WN5 7 | 44% | 2 | 12 | |
Crime rate ranking : Merseyside county has the 1. highest crime rate out of 54 counties
Drugs crime totalled 13.6k representing an increase 7.9% year-over-year. In the graph below, county are compared by crime rate and crime rate percentage change. Crime rate percentage change compares the county crime rate between May 2025 - April 2026 to the county crime rate in the previous 12 months. The size of the circle reflects the number of total crimes reported. The bigger the circle, the higher the number of crimes reported in the county.
+7.9% annual change, crime is increasing
13.6k crimes reported
 Crime rate percentage change
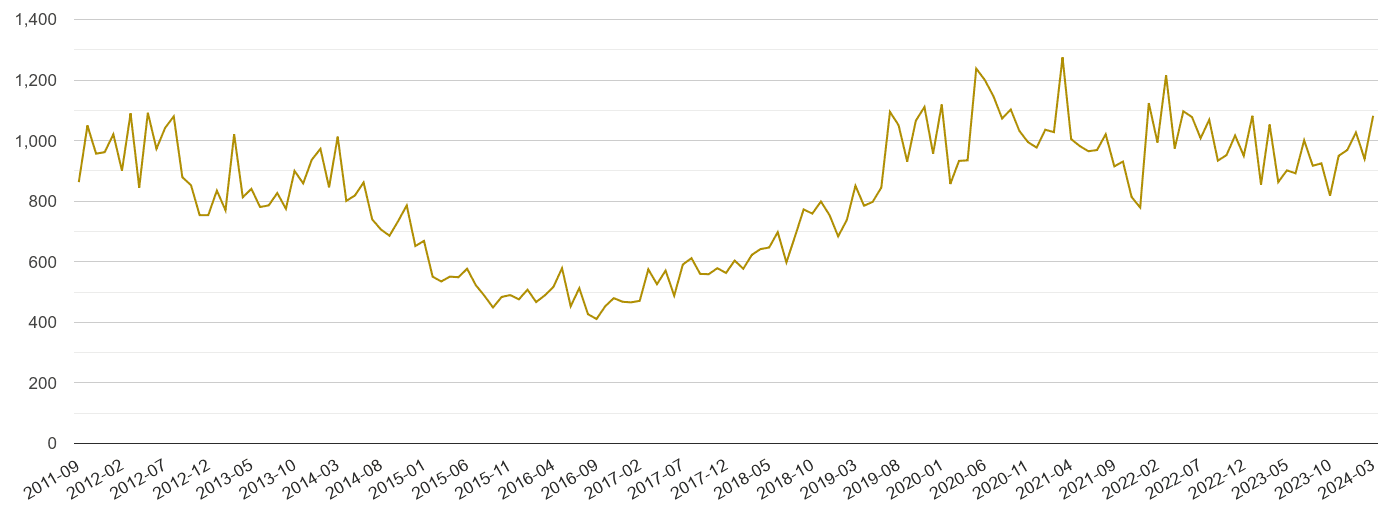
Number of crime incidents by month from January 2014 to April 2026.
Crime rate per 1000 workday people compared to the national crime rate by year.
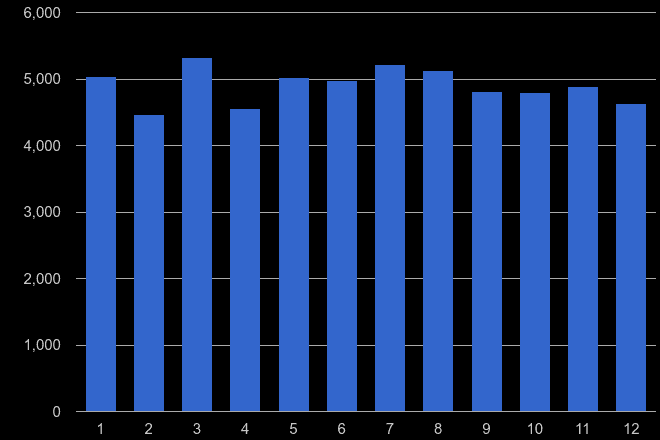
Total number of crimes reported in a given calendar month (1 = January … 12 = December) in the previous five years, i.e. from 2020 till 2024.
For details, click on the crime name with '→'
 login →


