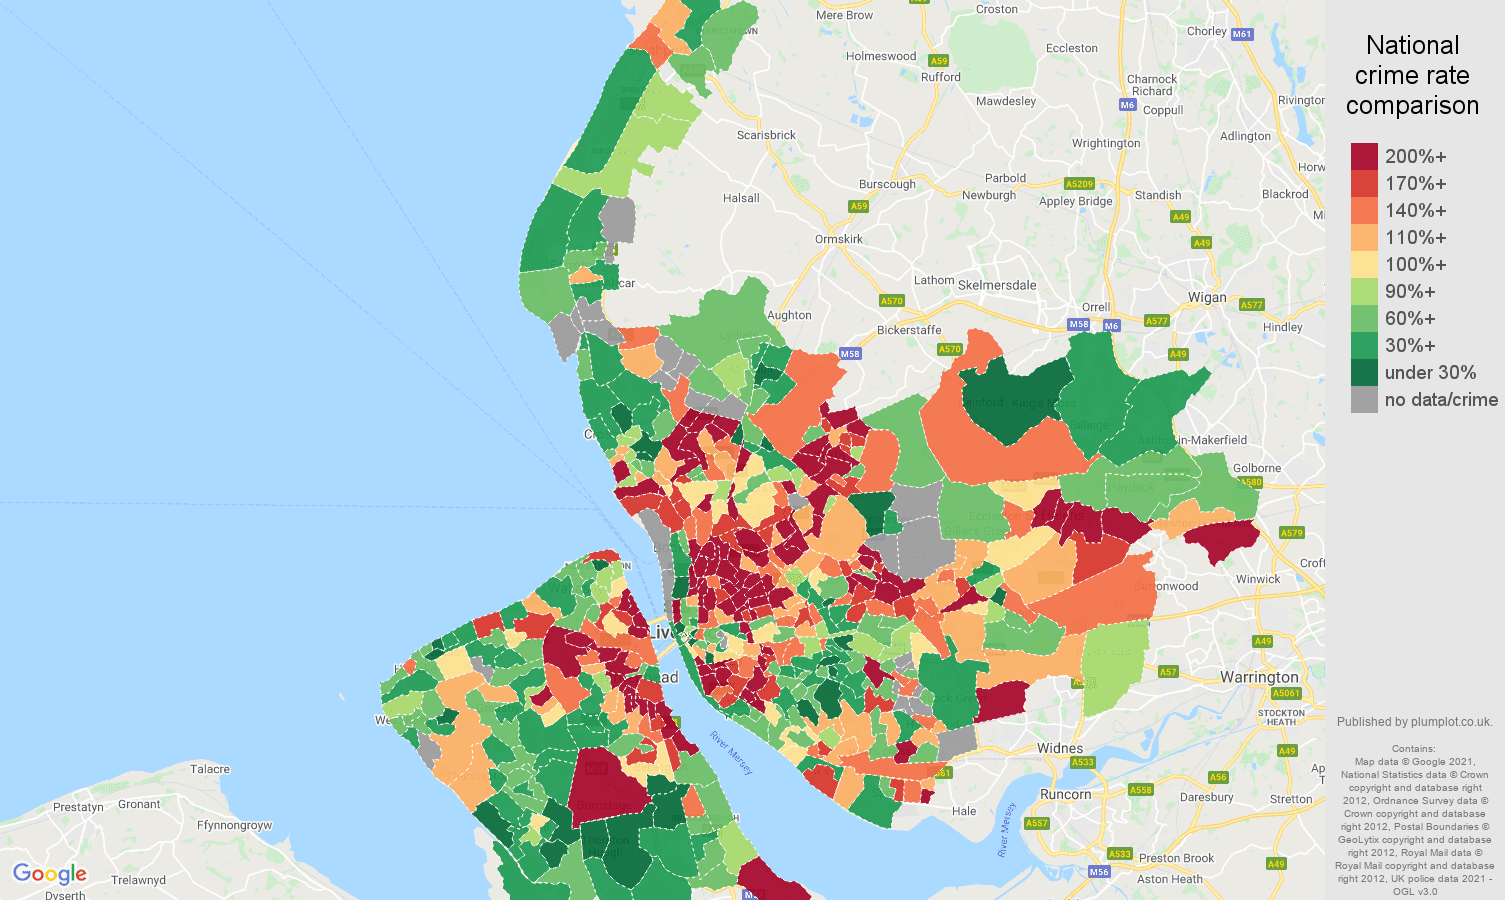
As of May 2026, the annual crime rate in Merseyside county stands at 9.2 crimes per 1000 people. Merseyside's current crime levels are at 127% of the national crime rate. Criminal damage and arson crime makes up 8.2% of all crimes reported in the county. Criminal damage and arson crime totalled 12.6k representing an increase 0.8% year-over-year.
| Merseyside county | crime statistic | England & Wales |
|---|---|---|
| 9.2 | annual crime rate per 1k workday people | 7.2 |
| 127% | ratio of national crime rate | 100% |
| 8.2% | share of all crimes | 7.2% |
| 12.6k | crimes reported | 405k |
| 0.8% | annual change | -4.1% |
| Postcode sector | Crime rate vs. ENG & WLS rate | Crime rate per 1000 workday people | Total number of crimes | |
|---|---|---|---|---|
| CH41 0 | 144% | 10 | 29 | |
| CH41 1 | 221% | 16 | 26 | |
| CH41 2 | 281% | 20 | 81 | |
| CH41 3 | 184% | 13 | 28 | |
| CH41 4 | 223% | 16 | 79 | |
| CH41 5 | 82% | 6 | 27 | |
| CH41 6 | 286% | 21 | 92 | |
| CH41 7 | 181% | 13 | 41 | |
| CH41 8 | 249% | 18 | 62 | |
| CH41 9 | 130% | 9 | 34 | |
| CH42 0 | 213% | 15 | 36 | |
| CH42 1 | 304% | 22 | 67 | |
| CH42 2 | 209% | 15 | 30 | |
| CH42 3 | 155% | 11 | 22 | |
| CH42 4 | 138% | 10 | 33 | |
| CH42 5 | 135% | 10 | 23 | |
| CH42 6 | 129% | 9 | 25 | |
| CH42 7 | 134% | 10 | 17 | |
| CH42 8 | 66% | 5 | 9 | |
| CH42 9 | 143% | 10 | 35 | |
| CH43 0 | 30% | 2 | 7 | |
| CH43 1 | 112% | 8 | 20 | |
| CH43 2 | 64% | 5 | 13 | |
| CH43 3 | 73% | 5 | 17 | |
| CH43 4 | 204% | 15 | 37 | |
| CH43 5 | 154% | 11 | 26 | |
| CH43 6 | 73% | 5 | 7 | |
| CH43 7 | 194% | 14 | 72 | |
| CH43 8 | 23% | 2 | 2 | |
| CH43 9 | 150% | 11 | 60 | |
| CH44 0 | 301% | 22 | 50 | |
| CH44 1 | 109% | 8 | 17 | |
| CH44 2 | 185% | 13 | 29 | |
| CH44 3 | 101% | 7 | 14 | |
| CH44 4 | 180% | 13 | 51 | |
| CH44 5 | 162% | 12 | 42 | |
| CH44 6 | 245% | 18 | 50 | |
| CH44 7 | 245% | 18 | 52 | |
| CH44 8 | 195% | 14 | 32 | |
| CH44 9 | 202% | 15 | 38 | |
| CH45 0 | 66% | 5 | 6 | |
| CH45 1 | 122% | 9 | 19 | |
| CH45 2 | 210% | 15 | 29 | |
| CH45 3 | 60% | 4 | 11 | |
| CH45 4 | 125% | 9 | 33 | |
| CH45 5 | 97% | 7 | 24 | |
| CH45 6 | 27% | 2 | 3 | |
| CH45 7 | 72% | 5 | 16 | |
| CH45 8 | 90% | 6 | 20 | |
| CH45 9 | 52% | 4 | 5 | |
| CH46 0 | 45% | 3 | 10 | |
| CH46 1 | 159% | 11 | 30 | |
| CH46 2 | 122% | 9 | 18 | |
| CH46 3 | 46% | 3 | 4 | |
| CH46 4 | 104% | 8 | 2 | |
| CH46 5 | 102% | 7 | 3 | |
| CH46 6 | 56% | 4 | 15 | |
| CH46 7 | 133% | 10 | 23 | |
| CH46 8 | 112% | 8 | 26 | |
| CH46 9 | 150% | 11 | 24 | |
| CH47 0 | 16% | 1 | 1 | |
| CH47 1 | 19% | 1 | 1 | |
| CH47 2 | 79% | 6 | 11 | |
| CH47 3 | 59% | 4 | 8 | |
| CH47 4 | 13% | 1 | 1 | |
| CH47 7 | 38% | 3 | 2 | |
| CH47 9 | 19% | 1 | 1 | |
| CH48 0 | 39% | 3 | 4 | |
| CH48 1 | 11% | 1 | 1 | |
| CH48 2 | 15% | 1 | 1 | |
| CH48 3 | 21% | 2 | 2 | |
| CH48 4 | 96% | 7 | 12 | |
| CH48 5 | 84% | 6 | 13 | |
| CH48 6 | 67% | 5 | 8 | |
| CH48 7 | 95% | 7 | 5 | |
| CH48 8 | 29% | 2 | 2 | |
| CH48 9 | 34% | 2 | 3 | |
| CH49 0 | 88% | 6 | 13 | |
| CH49 1 | 27% | 2 | 3 | |
| CH49 2 | 51% | 4 | 9 | |
| CH49 3 | 82% | 6 | 15 | |
| CH49 4 | 53% | 4 | 14 | |
| CH49 5 | 96% | 7 | 41 | |
| CH49 6 | 71% | 5 | 13 | |
| CH49 7 | 156% | 11 | 28 | |
| CH49 8 | 166% | 12 | 25 | |
| CH49 9 | 182% | 13 | 24 | |
| CH60 0 | 21% | 1 | 2 | |
| CH60 2 | 13% | 1 | 1 | |
| CH60 3 | 80% | 6 | 5 | |
| CH60 4 | 13% | 1 | 1 | |
| CH60 5 | 95% | 7 | 12 | |
| CH60 6 | 54% | 4 | 4 | |
| CH60 7 | 110% | 8 | 13 | |
| CH60 8 | 78% | 6 | 6 | |
| CH60 9 | 30% | 2 | 2 | |
| CH61 0 | 119% | 9 | 4 | |
| CH61 1 | 12% | 1 | 1 | |
| CH61 3 | 45% | 3 | 4 | |
| CH61 4 | 108% | 8 | 13 | |
| CH61 5 | 90% | 7 | 10 | |
| CH61 6 | 46% | 3 | 6 | |
| CH61 7 | 23% | 2 | 2 | |
| CH61 8 | 78% | 6 | 9 | |
| CH61 9 | 27% | 2 | 3 | |
| CH62 0 | 45% | 3 | 5 | |
| CH62 1 | 268% | 19 | 44 | |
| CH62 2 | 64% | 5 | 11 | |
| CH62 3 | 93% | 7 | 16 | |
| CH62 4 | 91% | 7 | 26 | |
| CH62 5 | 216% | 16 | 42 | |
| CH62 6 | 33% | 2 | 6 | |
| CH62 7 | 57% | 4 | 29 | |
| CH62 8 | 51% | 4 | 13 | |
| CH62 9 | 112% | 8 | 20 | |
| CH63 0 | 24% | 2 | 5 | |
| CH63 1 | 49% | 4 | 2 | |
| CH63 2 | 26% | 2 | 6 | |
| CH63 3 | 43% | 3 | 14 | |
| CH63 4 | 103% | 7 | 12 | |
| CH63 5 | 65% | 5 | 14 | |
| CH63 6 | 80% | 6 | 2 | |
| CH63 7 | 69% | 5 | 17 | |
| CH63 8 | 140% | 10 | 23 | |
| CH63 9 | 6% | 0 | 2 | |
| CH64 1 | 25% | 2 | 2 | |
| CH64 3 | 88% | 6 | 13 | |
| CH64 6 | 39% | 3 | 6 | |
| CH64 7 | 155% | 11 | 9 | |
| CH65 1 | 714% | 52 | 6 | |
| L1 0 | 7732% | 560 | 14 | |
| L1 1 | 330% | 24 | 102 | |
| L1 2 | 119% | 9 | 14 | |
| L1 3 | 42% | 3 | 13 | |
| L1 4 | 176% | 13 | 69 | |
| L1 5 | 145% | 10 | 41 | |
| L1 6 | 181% | 13 | 60 | |
| L1 7 | 57% | 4 | 4 | |
| L1 8 | 188% | 14 | 27 | |
| L1 9 | 178% | 13 | 29 | |
| L10 0 | 77% | 6 | 3 | |
| L10 1 | 70% | 5 | 15 | |
| L10 2 | 21% | 1 | 2 | |
| L10 3 | 88% | 6 | 6 | |
| L10 4 | 68% | 5 | 12 | |
| L10 6 | 126% | 9 | 8 | |
| L10 7 | 157% | 11 | 17 | |
| L10 8 | 15% | 1 | 2 | |
| L10 9 | 209% | 15 | 19 | |
| L11 0 | 83% | 6 | 12 | |
| L11 1 | 401% | 29 | 78 | |
| L11 2 | 214% | 16 | 49 | |
| L11 3 | 225% | 16 | 49 | |
| L11 4 | 186% | 13 | 29 | |
| L11 5 | 52% | 4 | 5 | |
| L11 6 | 67% | 5 | 4 | |
| L11 7 | 100% | 7 | 18 | |
| L11 8 | 57% | 4 | 6 | |
| L11 9 | 130% | 9 | 19 | |
| L12 0 | 95% | 7 | 40 | |
| L12 1 | 137% | 10 | 10 | |
| L12 2 | 51% | 4 | 6 | |
| L12 3 | 83% | 6 | 9 | |
| L12 4 | 175% | 13 | 26 | |
| L12 5 | 142% | 10 | 25 | |
| L12 6 | 104% | 8 | 10 | |
| L12 7 | 113% | 8 | 16 | |
| L12 8 | 140% | 10 | 23 | |
| L12 9 | 66% | 5 | 16 | |
| L13 0 | 90% | 7 | 11 | |
| L13 1 | 144% | 10 | 24 | |
| L13 2 | 158% | 11 | 31 | |
| L13 3 | 70% | 5 | 19 | |
| L13 4 | 123% | 9 | 27 | |
| L13 5 | 105% | 8 | 32 | |
| L13 6 | 94% | 7 | 18 | |
| L13 7 | 111% | 8 | 28 | |
| L13 8 | 123% | 9 | 24 | |
| L13 9 | 85% | 6 | 13 | |
| L14 0 | 104% | 8 | 28 | |
| L14 1 | 86% | 6 | 10 | |
| L14 2 | 91% | 7 | 15 | |
| L14 3 | 169% | 12 | 32 | |
| L14 4 | 191% | 14 | 20 | |
| L14 5 | 66% | 5 | 16 | |
| L14 6 | 55% | 4 | 7 | |
| L14 7 | 189% | 14 | 31 | |
| L14 8 | 193% | 14 | 26 | |
| L14 9 | 82% | 6 | 18 | |
| L15 0 | 173% | 12 | 30 | |
| L15 1 | 211% | 15 | 31 | |
| L15 2 | 131% | 9 | 17 | |
| L15 3 | 49% | 4 | 13 | |
| L15 4 | 89% | 6 | 29 | |
| L15 5 | 15% | 1 | 2 | |
| L15 6 | 37% | 3 | 7 | |
| L15 7 | 70% | 5 | 10 | |
| L15 8 | 181% | 13 | 38 | |
| L15 9 | 74% | 5 | 6 | |
| L16 0 | 17% | 1 | 1 | |
| L16 1 | 73% | 5 | 4 | |
| L16 2 | 86% | 6 | 9 | |
| L16 3 | 111% | 8 | 11 | |
| L16 5 | 122% | 9 | 8 | |
| L16 6 | 65% | 5 | 3 | |
| L16 7 | 20% | 1 | 2 | |
| L16 8 | 122% | 9 | 7 | |
| L16 9 | 25% | 2 | 5 | |
| L17 0 | 92% | 7 | 18 | |
| L17 1 | 144% | 10 | 12 | |
| L17 2 | 148% | 11 | 16 | |
| L17 3 | 216% | 16 | 27 | |
| L17 4 | 298% | 22 | 25 | |
| L17 5 | 128% | 9 | 9 | |
| L17 6 | 100% | 7 | 17 | |
| L17 7 | 45% | 3 | 10 | |
| L17 8 | 559% | 41 | 81 | |
| L17 9 | 53% | 4 | 6 | |
| L18 0 | 47% | 3 | 3 | |
| L18 1 | 110% | 8 | 36 | |
| L18 2 | 48% | 3 | 5 | |
| L18 3 | 46% | 3 | 8 | |
| L18 4 | 28% | 2 | 3 | |
| L18 5 | 177% | 13 | 28 | |
| L18 6 | 92% | 7 | 14 | |
| L18 7 | 66% | 5 | 9 | |
| L18 8 | 98% | 7 | 22 | |
| L18 9 | 93% | 7 | 16 | |
| L19 0 | 124% | 9 | 18 | |
| L19 1 | 49% | 4 | 5 | |
| L19 2 | 129% | 9 | 63 | |
| L19 3 | 46% | 3 | 5 | |
| L19 4 | 182% | 13 | 29 | |
| L19 5 | 191% | 14 | 19 | |
| L19 6 | 258% | 19 | 18 | |
| L19 7 | 39% | 3 | 2 | |
| L19 8 | 327% | 24 | 63 | |
| L19 9 | 45% | 3 | 8 | |
| L2 0 | 33% | 2 | 6 | |
| L2 2 | 101% | 7 | 24 | |
| L2 3 | 105% | 8 | 8 | |
| L2 4 | 21% | 2 | 5 | |
| L2 5 | 65% | 5 | 7 | |
| L2 6 | 121% | 9 | 21 | |
| L2 7 | 86% | 6 | 15 | |
| L2 8 | 62% | 4 | 3 | |
| L2 9 | 72% | 5 | 3 | |
| L20 0 | 102% | 7 | 18 | |
| L20 1 | 387% | 28 | 3 | |
| L20 2 | 218% | 16 | 41 | |
| L20 3 | 146% | 11 | 47 | |
| L20 4 | 240% | 17 | 139 | |
| L20 5 | 211% | 15 | 38 | |
| L20 6 | 120% | 9 | 49 | |
| L20 7 | 76% | 6 | 29 | |
| L20 8 | 216% | 16 | 21 | |
| L20 9 | 72% | 5 | 27 | |
| L21 0 | 220% | 16 | 52 | |
| L21 1 | 207% | 15 | 46 | |
| L21 2 | 227% | 16 | 15 | |
| L21 3 | 258% | 19 | 9 | |
| L21 4 | 131% | 10 | 12 | |
| L21 5 | 162% | 12 | 13 | |
| L21 6 | 514% | 37 | 28 | |
| L21 7 | 200% | 14 | 39 | |
| L21 8 | 211% | 15 | 46 | |
| L21 9 | 97% | 7 | 24 | |
| L22 0 | 68% | 5 | 8 | |
| L22 1 | 72% | 5 | 5 | |
| L22 2 | 93% | 7 | 7 | |
| L22 3 | 62% | 4 | 8 | |
| L22 4 | 79% | 6 | 8 | |
| L22 5 | 103% | 7 | 14 | |
| L22 6 | 138% | 10 | 8 | |
| L22 7 | 37% | 3 | 2 | |
| L22 8 | 53% | 4 | 3 | |
| L22 9 | 112% | 8 | 9 | |
| L23 0 | 86% | 6 | 25 | |
| L23 1 | 124% | 9 | 14 | |
| L23 2 | 96% | 7 | 25 | |
| L23 3 | 108% | 8 | 14 | |
| L23 4 | 53% | 4 | 4 | |
| L23 5 | 51% | 4 | 8 | |
| L23 6 | 51% | 4 | 9 | |
| L23 7 | 12% | 1 | 2 | |
| L23 8 | 61% | 4 | 8 | |
| L23 9 | 139% | 10 | 39 | |
| L24 0 | 354% | 26 | 44 | |
| L24 1 | 131% | 9 | 68 | |
| L24 2 | 234% | 17 | 65 | |
| L24 3 | 118% | 9 | 50 | |
| L24 6 | 368% | 27 | 25 | |
| L24 7 | 234% | 17 | 17 | |
| L24 9 | 120% | 9 | 14 | |
| L25 0 | 79% | 6 | 27 | |
| L25 1 | 107% | 8 | 13 | |
| L25 2 | 248% | 18 | 67 | |
| L25 3 | 77% | 6 | 12 | |
| L25 4 | 16% | 1 | 2 | |
| L25 5 | 199% | 14 | 43 | |
| L25 6 | 84% | 6 | 13 | |
| L25 7 | 103% | 7 | 28 | |
| L25 8 | 104% | 8 | 18 | |
| L25 9 | 74% | 5 | 18 | |
| L26 0 | 265% | 19 | 33 | |
| L26 1 | 171% | 12 | 29 | |
| L26 2 | 763% | 55 | 11 | |
| L26 3 | 168% | 12 | 3 | |
| L26 6 | 133% | 10 | 8 | |
| L26 7 | 64% | 5 | 11 | |
| L26 9 | 133% | 10 | 52 | |
| L27 1 | 116% | 8 | 11 | |
| L27 4 | 44% | 3 | 1 | |
| L27 5 | 77% | 6 | 4 | |
| L27 6 | 192% | 14 | 11 | |
| L27 7 | 170% | 12 | 16 | |
| L27 8 | 120% | 9 | 6 | |
| L28 0 | 62% | 5 | 3 | |
| L28 1 | 208% | 15 | 23 | |
| L28 3 | 188% | 14 | 2 | |
| L28 4 | 85% | 6 | 5 | |
| L28 5 | 247% | 18 | 12 | |
| L28 6 | 132% | 10 | 3 | |
| L28 7 | 375% | 27 | 13 | |
| L28 8 | 119% | 9 | 3 | |
| L29 1 | 345% | 25 | 1 | |
| L29 7 | 185% | 13 | 6 | |
| L29 8 | 276% | 20 | 1 | |
| L29 9 | 247% | 18 | 3 | |
| L3 0 | 52% | 4 | 2 | |
| L3 1 | 41% | 3 | 12 | |
| L3 2 | 98% | 7 | 35 | |
| L3 3 | 492% | 36 | 49 | |
| L3 4 | 50% | 4 | 31 | |
| L3 5 | 67% | 5 | 34 | |
| L3 6 | 196% | 14 | 60 | |
| L3 7 | 827% | 60 | 39 | |
| L3 8 | 131% | 9 | 34 | |
| L3 9 | 52% | 4 | 39 | |
| L30 0 | 323% | 23 | 37 | |
| L30 1 | 93% | 7 | 37 | |
| L30 2 | 105% | 8 | 19 | |
| L30 3 | 124% | 9 | 15 | |
| L30 4 | 172% | 12 | 2 | |
| L30 5 | 225% | 16 | 39 | |
| L30 6 | 84% | 6 | 4 | |
| L30 7 | 150% | 11 | 25 | |
| L30 8 | 31% | 2 | 3 | |
| L30 9 | 85% | 6 | 10 | |
| L31 0 | 109% | 8 | 14 | |
| L31 1 | 174% | 13 | 54 | |
| L31 2 | 75% | 5 | 14 | |
| L31 3 | 86% | 6 | 10 | |
| L31 4 | 22% | 2 | 3 | |
| L31 5 | 88% | 6 | 15 | |
| L31 6 | 52% | 4 | 9 | |
| L31 7 | 35% | 3 | 7 | |
| L31 8 | 32% | 2 | 6 | |
| L31 9 | 46% | 3 | 10 | |
| L32 0 | 294% | 21 | 54 | |
| L32 1 | 117% | 8 | 9 | |
| L32 2 | 127% | 9 | 14 | |
| L32 3 | 59% | 4 | 4 | |
| L32 4 | 183% | 13 | 18 | |
| L32 5 | 249% | 18 | 12 | |
| L32 6 | 54% | 4 | 14 | |
| L32 7 | 166% | 12 | 29 | |
| L32 8 | 422% | 31 | 95 | |
| L32 9 | 117% | 8 | 21 | |
| L33 0 | 278% | 20 | 26 | |
| L33 1 | 270% | 20 | 66 | |
| L33 2 | 69% | 5 | 4 | |
| L33 3 | 79% | 6 | 4 | |
| L33 5 | 43% | 3 | 9 | |
| L33 6 | 95% | 7 | 17 | |
| L33 7 | 119% | 9 | 13 | |
| L33 8 | 256% | 19 | 16 | |
| L33 9 | 297% | 22 | 47 | |
| L34 0 | 89% | 6 | 21 | |
| L34 1 | 156% | 11 | 36 | |
| L34 2 | 54% | 4 | 10 | |
| L34 3 | 161% | 12 | 10 | |
| L34 4 | 76% | 6 | 3 | |
| L34 5 | 178% | 13 | 33 | |
| L34 6 | 191% | 14 | 22 | |
| L34 7 | 41% | 3 | 1 | |
| L34 9 | 21% | 2 | 2 | |
| L35 0 | 65% | 5 | 11 | |
| L35 1 | 71% | 5 | 10 | |
| L35 2 | 62% | 5 | 19 | |
| L35 3 | 145% | 10 | 66 | |
| L35 4 | 129% | 9 | 21 | |
| L35 5 | 233% | 17 | 59 | |
| L35 6 | 39% | 3 | 4 | |
| L35 7 | 45% | 3 | 6 | |
| L35 8 | 40% | 3 | 14 | |
| L35 9 | 112% | 8 | 9 | |
| L36 0 | 119% | 9 | 35 | |
| L36 1 | 141% | 10 | 21 | |
| L36 2 | 232% | 17 | 65 | |
| L36 3 | 268% | 19 | 73 | |
| L36 4 | 63% | 5 | 19 | |
| L36 5 | 87% | 6 | 27 | |
| L36 6 | 215% | 16 | 49 | |
| L36 7 | 142% | 10 | 39 | |
| L36 8 | 166% | 12 | 45 | |
| L36 9 | 122% | 9 | 28 | |
| L37 0 | 78% | 6 | 2 | |
| L37 1 | 59% | 4 | 9 | |
| L37 2 | 80% | 6 | 21 | |
| L37 3 | 34% | 2 | 10 | |
| L37 4 | 81% | 6 | 18 | |
| L37 6 | 61% | 4 | 11 | |
| L37 7 | 38% | 3 | 8 | |
| L37 8 | 28% | 2 | 3 | |
| L38 0 | 212% | 15 | 6 | |
| L38 3 | 274% | 20 | 6 | |
| L38 9 | 244% | 18 | 12 | |
| L4 0 | 272% | 20 | 55 | |
| L4 1 | 159% | 12 | 26 | |
| L4 2 | 272% | 20 | 86 | |
| L4 3 | 179% | 13 | 43 | |
| L4 4 | 346% | 25 | 100 | |
| L4 5 | 270% | 20 | 91 | |
| L4 6 | 143% | 10 | 25 | |
| L4 7 | 105% | 8 | 19 | |
| L4 8 | 105% | 8 | 17 | |
| L4 9 | 208% | 15 | 68 | |
| L5 0 | 153% | 11 | 17 | |
| L5 1 | 290% | 21 | 12 | |
| L5 2 | 227% | 16 | 20 | |
| L5 3 | 247% | 18 | 29 | |
| L5 4 | 91% | 7 | 9 | |
| L5 5 | 493% | 36 | 58 | |
| L5 6 | 288% | 21 | 44 | |
| L5 7 | 239% | 17 | 27 | |
| L5 8 | 303% | 22 | 36 | |
| L5 9 | 103% | 7 | 22 | |
| L6 0 | 171% | 12 | 25 | |
| L6 1 | 177% | 13 | 32 | |
| L6 2 | 169% | 12 | 26 | |
| L6 3 | 221% | 16 | 26 | |
| L6 4 | 210% | 15 | 55 | |
| L6 5 | 137% | 10 | 27 | |
| L6 6 | 261% | 19 | 46 | |
| L6 7 | 563% | 41 | 32 | |
| L6 8 | 155% | 11 | 14 | |
| L6 9 | 214% | 15 | 21 | |
| L7 0 | 180% | 13 | 62 | |
| L7 1 | 69% | 5 | 4 | |
| L7 2 | 194% | 14 | 24 | |
| L7 3 | 123% | 9 | 30 | |
| L7 4 | 190% | 14 | 6 | |
| L7 5 | 246% | 18 | 13 | |
| L7 6 | 139% | 10 | 18 | |
| L7 7 | 28% | 2 | 8 | |
| L7 8 | 52% | 4 | 34 | |
| L7 9 | 108% | 8 | 13 | |
| L8 0 | 183% | 13 | 76 | |
| L8 1 | 218% | 16 | 22 | |
| L8 2 | 204% | 15 | 29 | |
| L8 3 | 203% | 15 | 38 | |
| L8 4 | 145% | 10 | 33 | |
| L8 5 | 194% | 14 | 23 | |
| L8 6 | 158% | 11 | 37 | |
| L8 7 | 133% | 10 | 49 | |
| L8 8 | 192% | 14 | 52 | |
| L8 9 | 271% | 20 | 43 | |
| L9 0 | 137% | 10 | 36 | |
| L9 1 | 248% | 18 | 118 | |
| L9 2 | 115% | 8 | 19 | |
| L9 3 | 112% | 8 | 27 | |
| L9 4 | 222% | 16 | 20 | |
| L9 5 | 286% | 21 | 14 | |
| L9 6 | 228% | 17 | 62 | |
| L9 7 | 107% | 8 | 33 | |
| L9 8 | 100% | 7 | 27 | |
| L9 9 | 71% | 5 | 34 | |
| PR8 1 | 158% | 11 | 83 | |
| PR8 2 | 32% | 2 | 19 | |
| PR8 3 | 75% | 5 | 50 | |
| PR8 4 | 48% | 3 | 30 | |
| PR8 6 | 76% | 6 | 70 | |
| PR9 0 | 119% | 9 | 92 | |
| PR9 7 | 55% | 4 | 37 | |
| PR9 9 | 83% | 6 | 71 | |
| WA10 1 | 209% | 15 | 119 | |
| WA10 2 | 182% | 13 | 93 | |
| WA10 3 | 110% | 8 | 81 | |
| WA10 4 | 129% | 9 | 54 | |
| WA10 5 | 67% | 5 | 21 | |
| WA10 6 | 136% | 10 | 57 | |
| WA11 0 | 87% | 6 | 84 | |
| WA11 7 | 139% | 10 | 59 | |
| WA11 8 | 29% | 2 | 11 | |
| WA11 9 | 106% | 8 | 88 | |
| WA12 0 | 81% | 6 | 27 | |
| WA12 8 | 153% | 11 | 60 | |
| WA12 9 | 139% | 10 | 92 | |
| WA8 3 | 68% | 5 | 24 | |
| WA8 4 | 102% | 7 | 34 | |
| WA8 5 | 81% | 6 | 11 | |
| WA9 1 | 263% | 19 | 142 | |
| WA9 2 | 307% | 22 | 119 | |
| WA9 3 | 171% | 12 | 138 | |
| WA9 4 | 106% | 8 | 84 | |
| WA9 5 | 131% | 10 | 112 | |
| WN4 0 | 39% | 3 | 20 | |
| WN5 7 | 37% | 3 | 21 | |
Crime rate ranking : Merseyside county has the 9. highest crime rate out of 54 counties
Criminal damage and arson crime totalled 12.6k representing an increase 0.8% year-over-year. In the graph below, county are compared by crime rate and crime rate percentage change. Crime rate percentage change compares the county crime rate between May 2025 - April 2026 to the county crime rate in the previous 12 months. The size of the circle reflects the number of total crimes reported. The bigger the circle, the higher the number of crimes reported in the county.
+0.8% annual change, crime is increasing
12.6k crimes reported
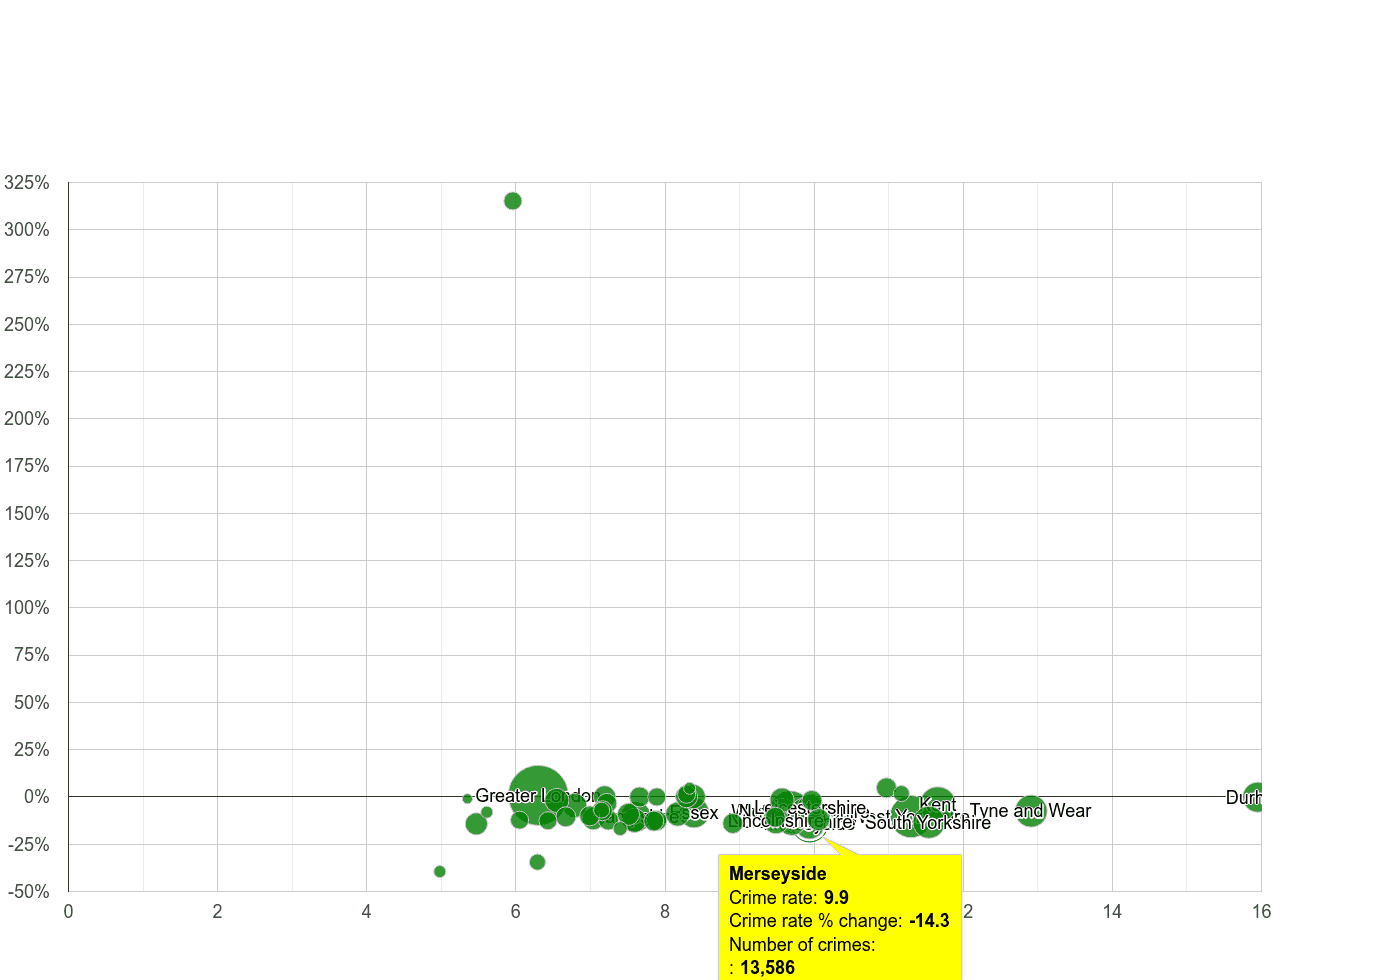 Crime rate percentage change
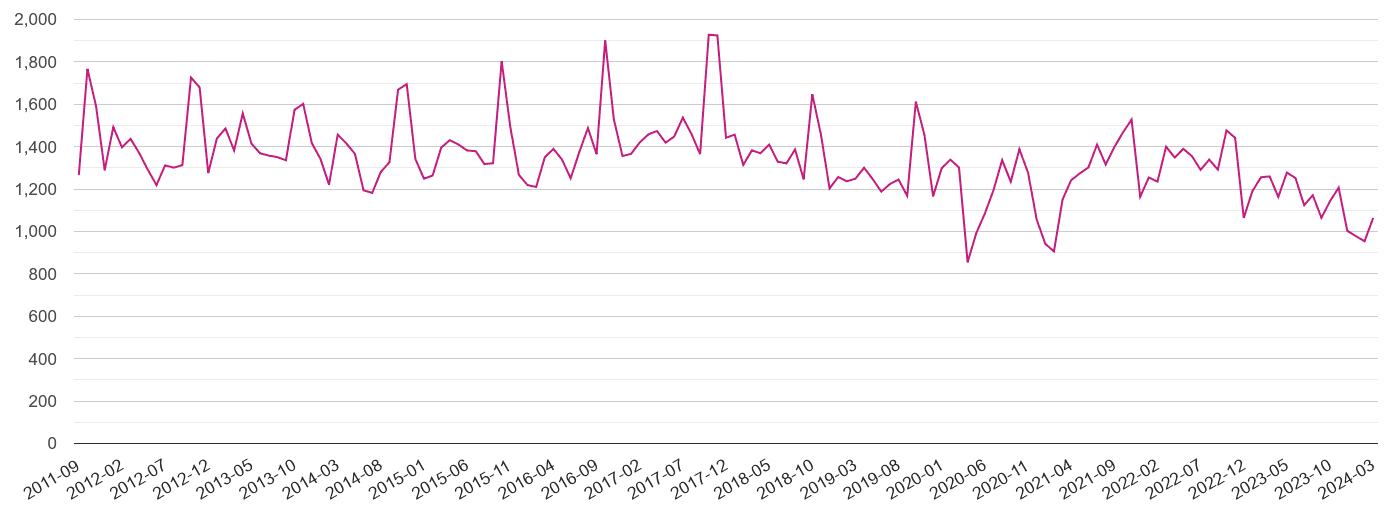
Number of crime incidents by month from January 2014 to April 2026.
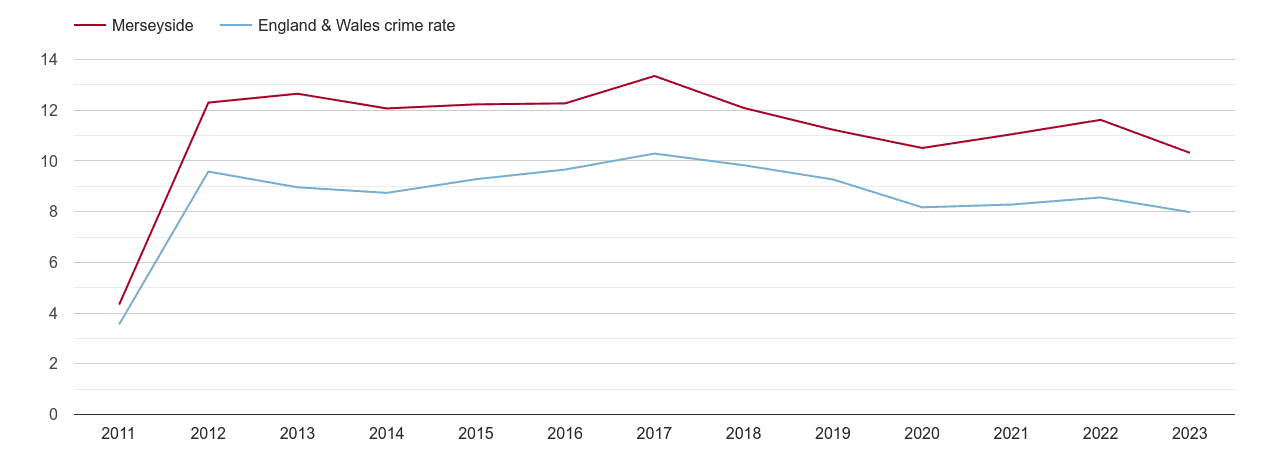
Crime rate per 1000 workday people compared to the national crime rate by year.
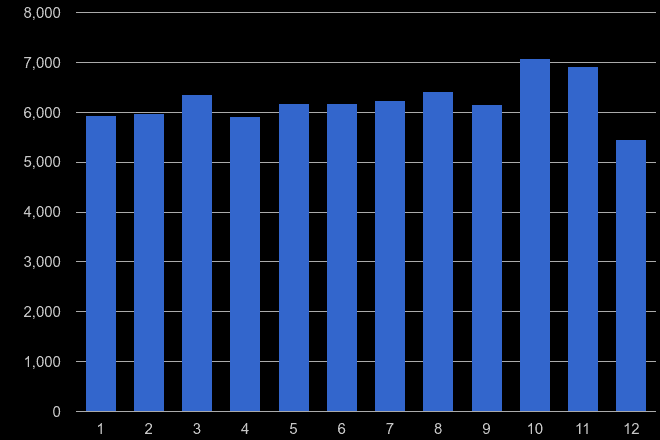
Total number of crimes reported in a given calendar month (1 = January … 12 = December) in the previous five years, i.e. from 2020 till 2024.

For details, click on the crime name with '→'
 login →


