Inner London crime stats
February 2018 - January 2019
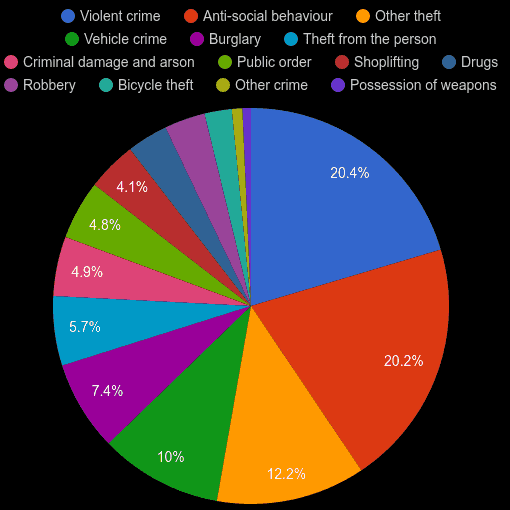
Crime categories comparison
The cathegory of "theft from the person crime" is the highest ranking crime category when category crime rate is compared to the national average. "Theft from the person crime" rate is at 422% of national crime rate which puts Inner London on 2. position out of 10 England's and Wales' postcode areas in this crime category. "Theft from the person crime" makes up 5.7% of all crimes committed in the area. The total number of "theft from the person crime" is 41.8k cases and has decreased by 9.5% when compared year-over-year in the period of February 2018 - January 2019. For details, click on the name of a category.
422%
of national crime rate5.7%
of all crimes41.8k
crimes committed-9.5%
annual change304%
of national crime rate3.3%
of all crimes24.6k
crimes committed2.2%
annual change176%
of national crime rate3.3%
of all crimes24.7k
crimes committed3.9%
annual change174%
of national crime rate2.2%
of all crimes16.4k
crimes committed-7.3%
annual change169%
of national crime rate12.2%
of all crimes89.8k
crimes committed9.3%
annual change161%
of national crime rate10%
of all crimes73.8k
crimes committed8.8%
annual change130%
of national crime rate7.4%
of all crimes54.3k
crimes committed8.8%
annual change118%
of national crime rate0.7%
of all crimes5.2k
crimes committed4%
annual change110%
of national crime rate20.2%
of all crimes149k
crimes committed-1.9%
annual change87%
of national crime rate20.4%
of all crimes151k
crimes committed4.6%
annual change83%
of national crime rate4.8%
of all crimes35.6k
crimes committed-1.5%
annual change82%
of national crime rate4.1%
of all crimes29.9k
crimes committed-7.4%
annual change64%
of national crime rate0.9%
of all crimes6.3k
crimes committed4.5%
annual change64%
of national crime rate4.9%
of all crimes35.9k
crimes committed-7%
annual changeAssociated reports:
