Inner London population statistics
In 2017, there were 5.4M residents in Inner London postcode area with an average age of 35.4 years. Population density was 8.6k residents per square kilometer. In England and Wales, the average age was 40. Based on Census, there were 2.43 residents per household in 2011.5.4M
total residents
estimates 201735.4
average age
estimates 20178.6k
population density
estimates 20172.43
residents per household
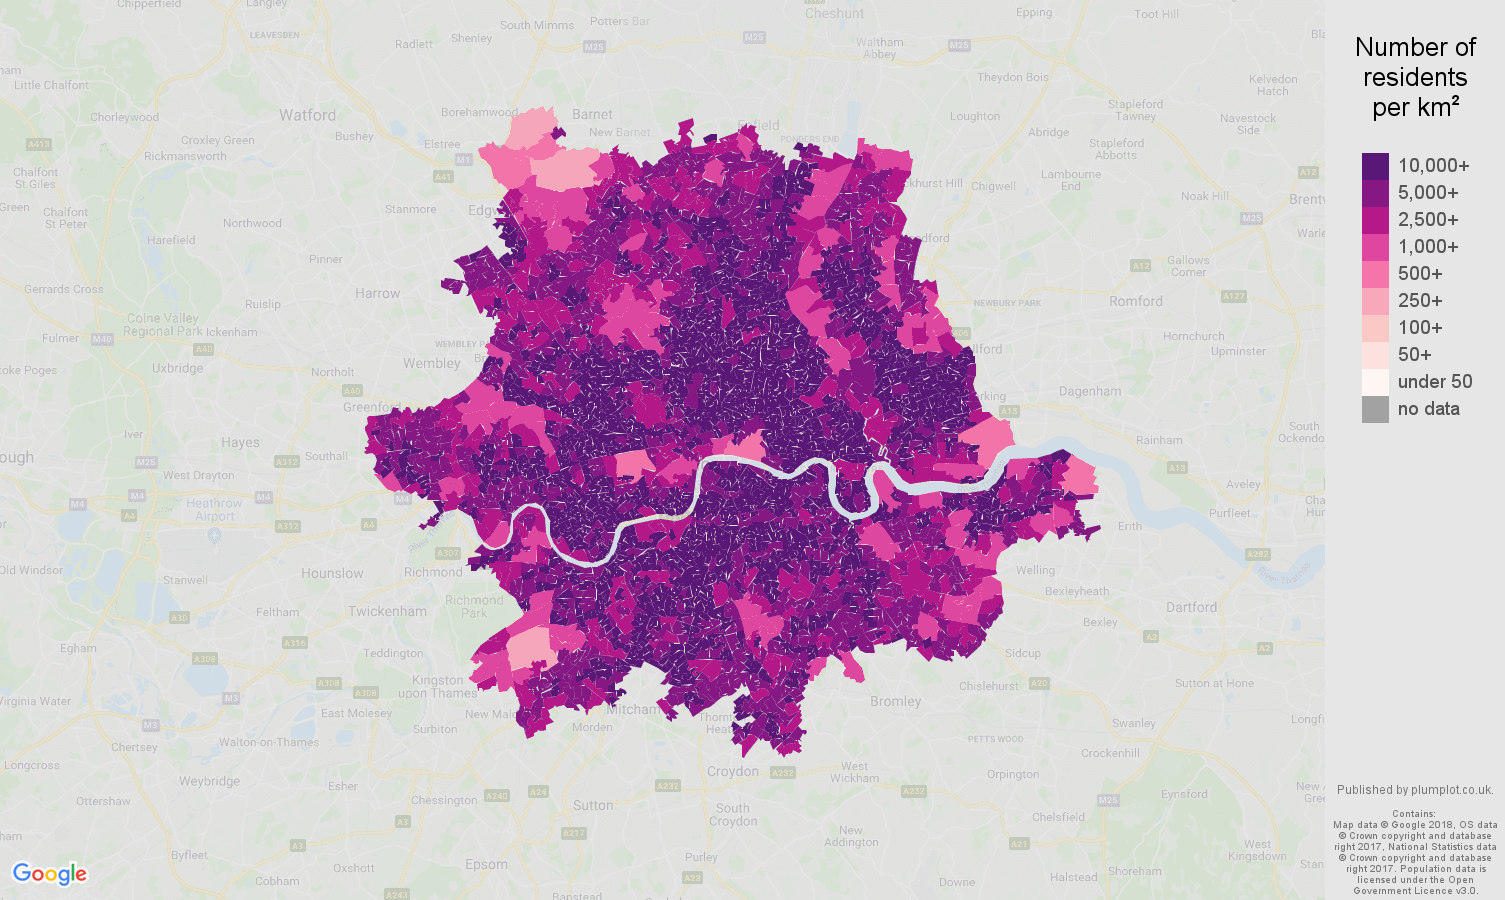
Census 2011Inner London population density map
shows a number of residents per square kilometer(km2), estimates from 2017.
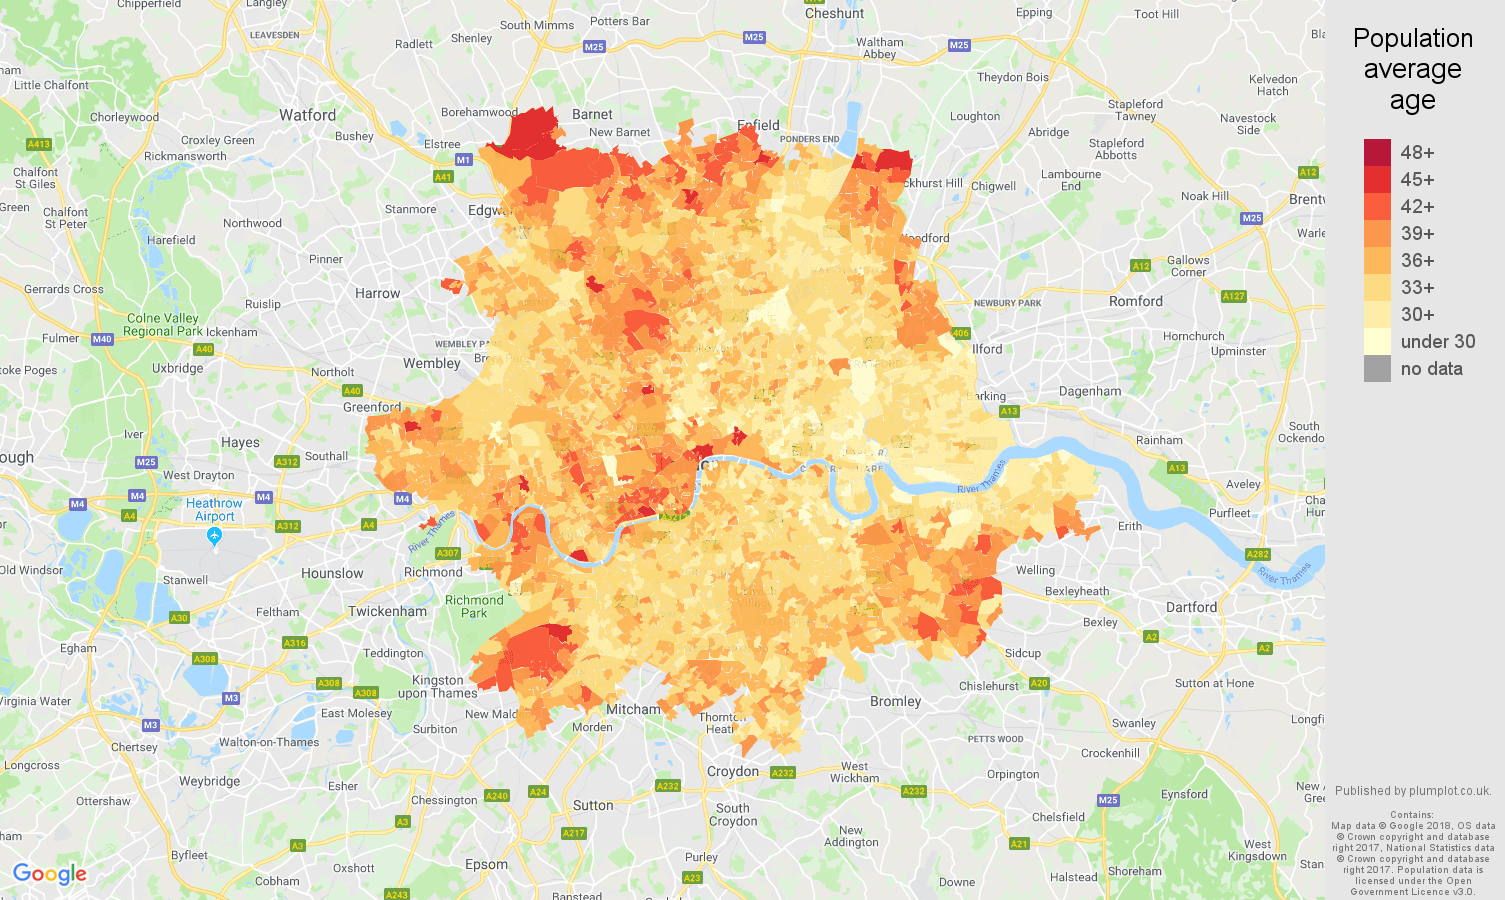
Inner London population average age map
Population average age by LSOA (County) in 2017.
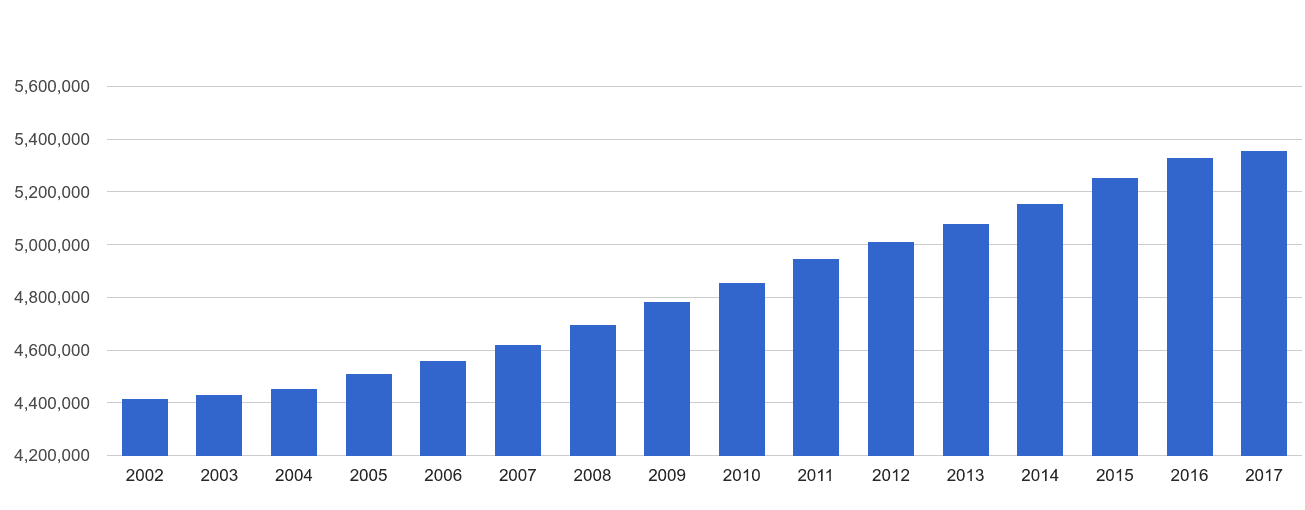
Inner London population growth
Total population per year outlines headcount differences.
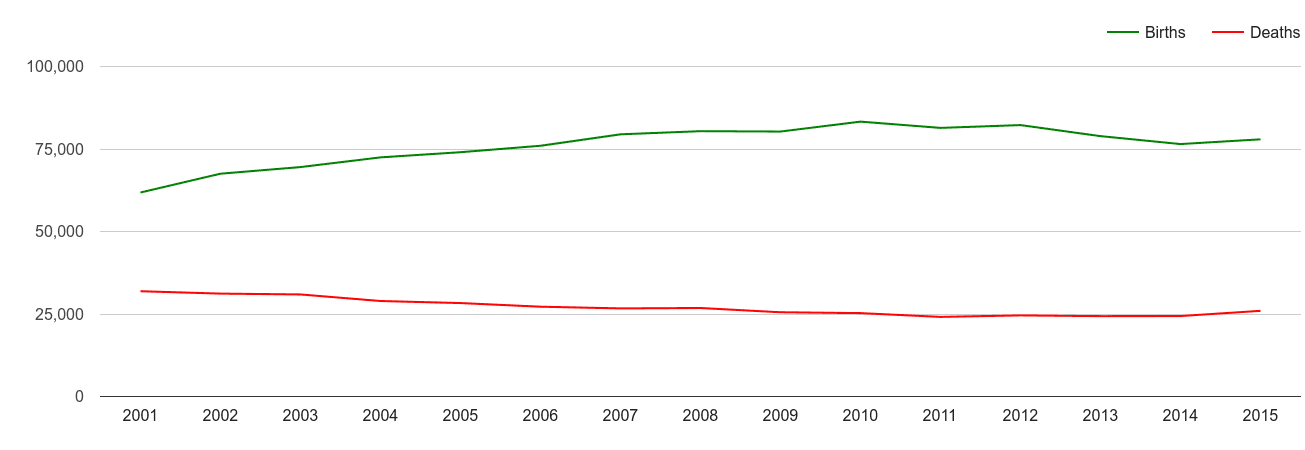
Inner London births and deaths
by year. Figures are for deaths registered, rather than deaths occurring in each calendar year. It can take months for a death referred to a coroner to be registered.
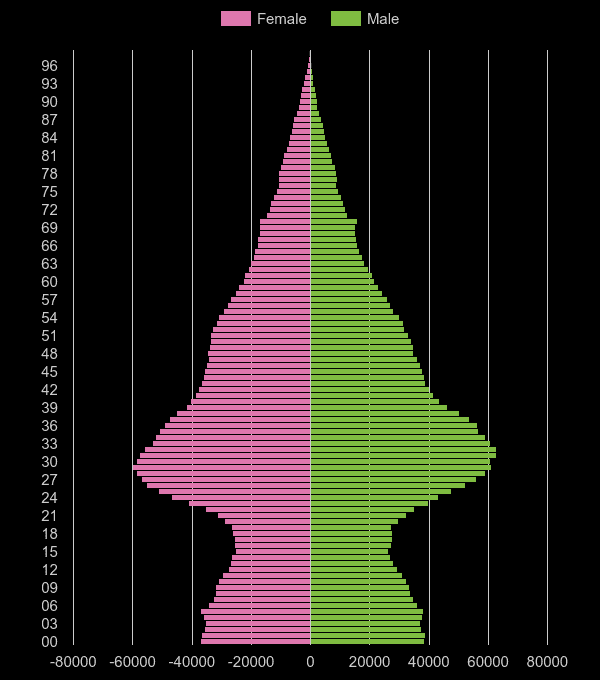
Inner London population pyramid
shows the distribution of various age groups in a population in 2017. Females are shown on the left, males are shown on the right.
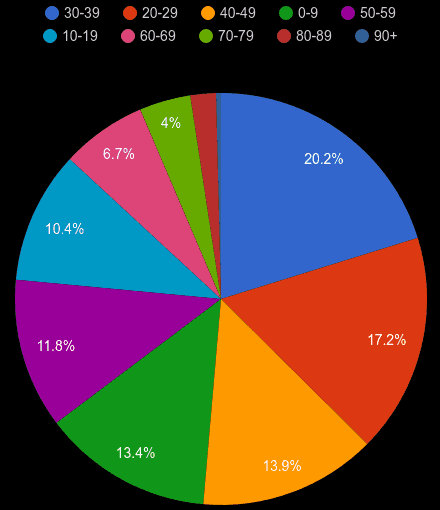
Inner London population share by decade of age
Ordered from the most to the least populous age group, 2017.
Inner London population by working age group
| age group | head-count | share in population |
|---|
| 0-15 | 1.1M | 19.7% |
| 16-64 | 3.8M | 70.1% |
| 65+ | 544k | 10.2% |
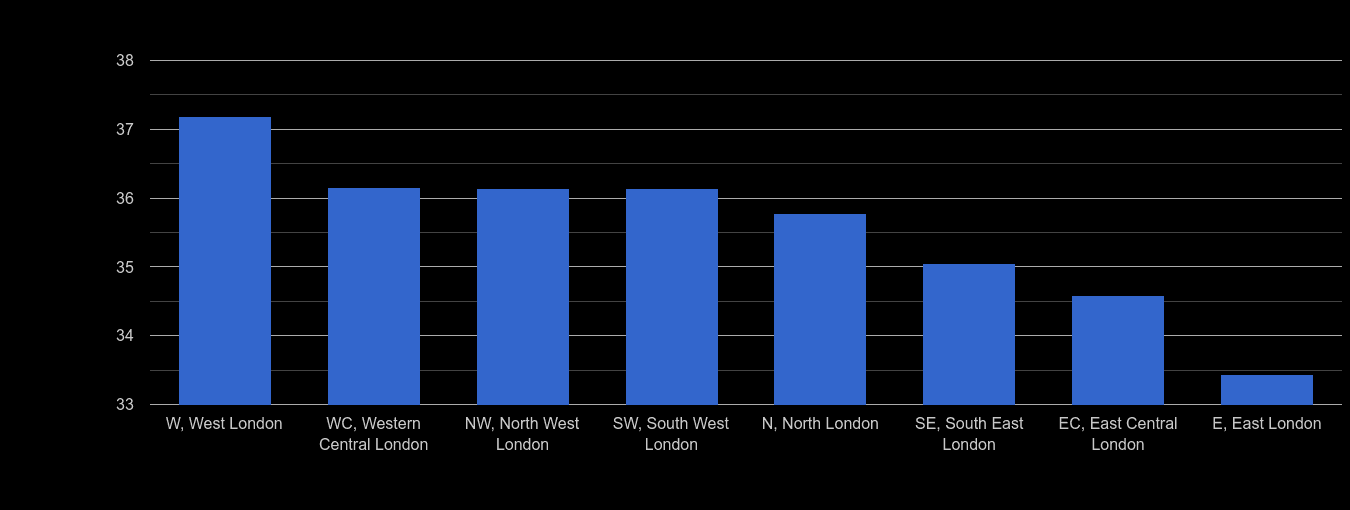
Inner London average age rank
Comparison of postcode areas average ages, 2017 population estimates.
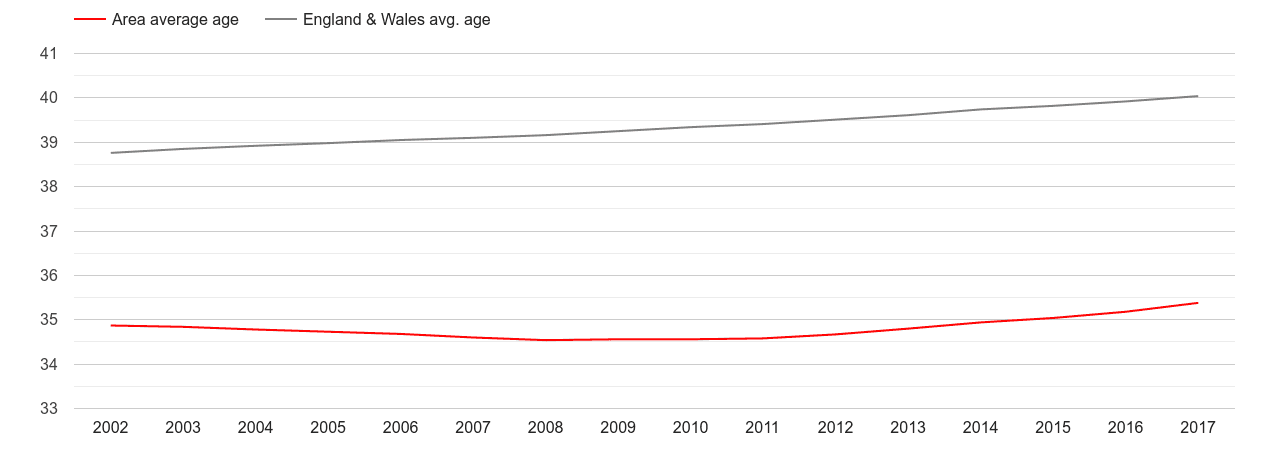
Inner London population average age
Annual area statistics of Inner London's population average age compared to country statistics.
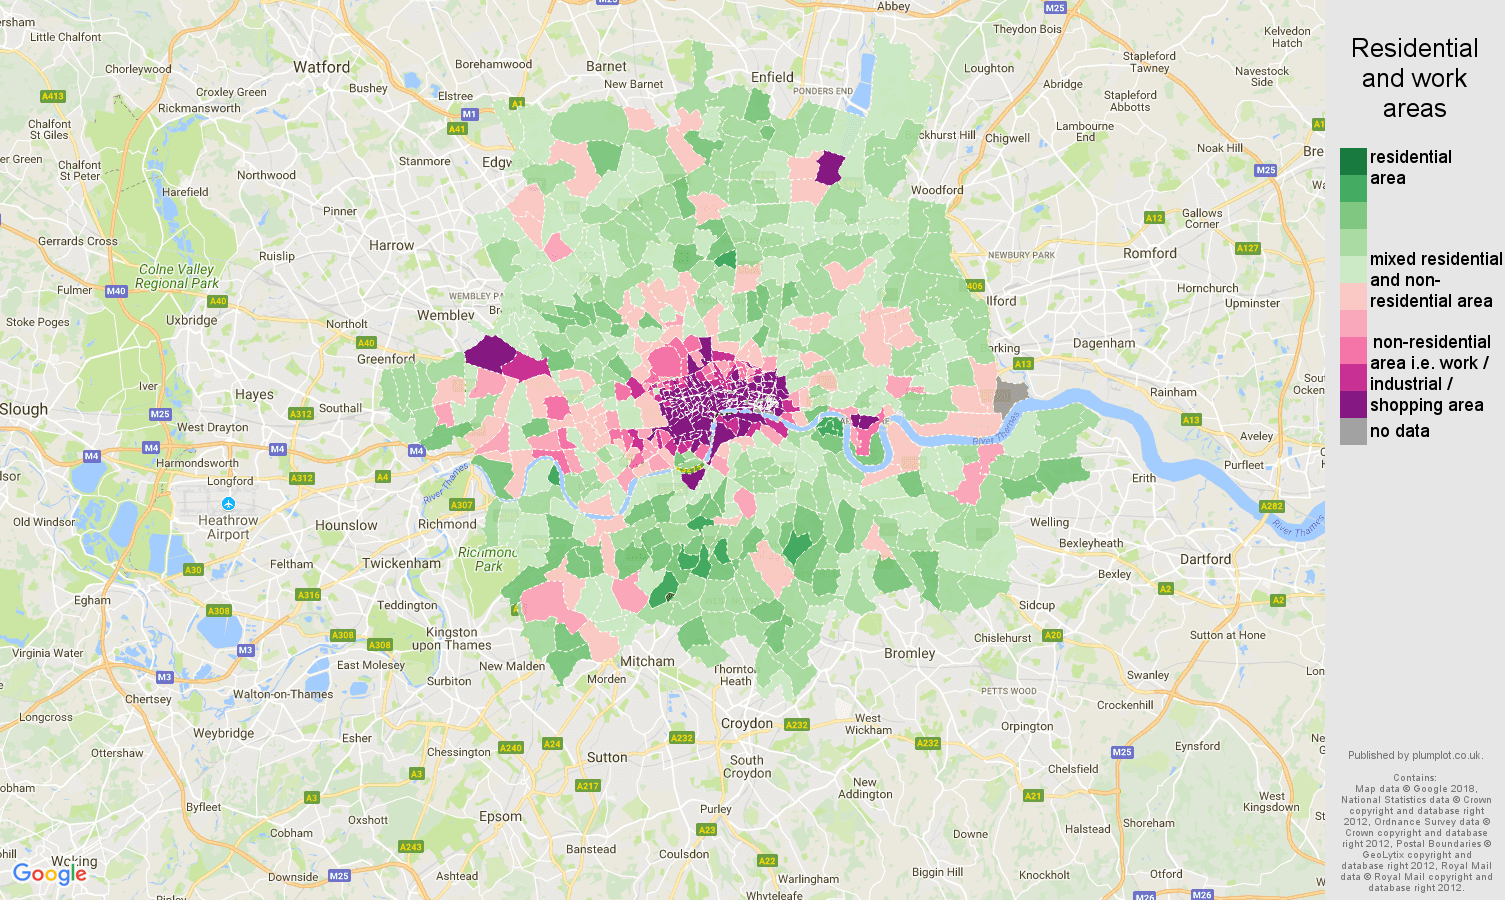
Inner London residential areas map
Purple-colored areas are business or industrial areas. Green-colored areas provide quieter surroundings and better living. Map is based on a UK Census 2011 data. Colors calculated from the ratio of number of residents divided by a number of workday people.
Associated reports:


