Inner London home energy costs
The following charts compare home (both flats and houses) energy costs in Inner London postcode area to the home energy costs in whole England and Wales. Outer ring charts show share in Inner London, inner charts show share for England and Wales. Data is taken from energy certificates for domestic buildings. The certificates were issued between 2008-2016. Data is available for more than 50% of all domestic properties. In case of multiple certificate for one property, only the latest available certificate data was used in the charts.
Inner London homes by heating cost per square meters
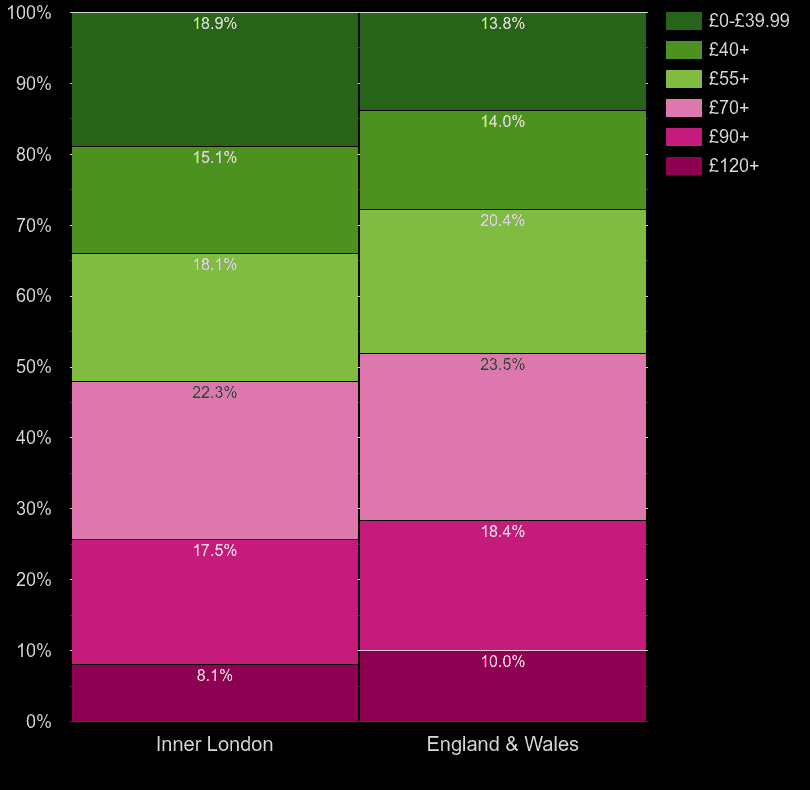
| Heating cost per 10m² per year | Inner London | England & Wales |
|---|
| █ £0-£39.99 | 18.9% | 13.8% |
| █ £40+ | 15.1% | 14.0% |
| █ £55+ | 18.1% | 20.4% |
| █ £70+ | 22.3% | 23.5% |
| █ £90+ | 17.5% | 18.4% |
| █ £120+ | 8.1% | 10.0% |
Inner London homes by hot water cost per square meters
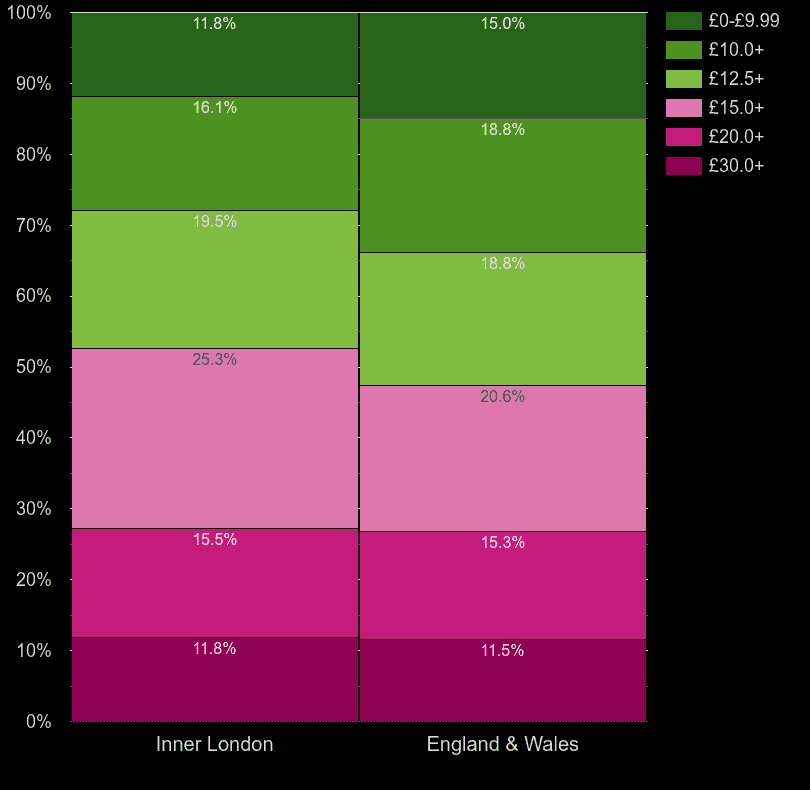
| Hot water cost per 10m² per year | Inner London | England & Wales |
|---|
| █ £0-£9.99 | 11.8% | 15.0% |
| █ £10.0+ | 16.1% | 18.8% |
| █ £12.5+ | 19.5% | 18.8% |
| █ £15.0+ | 25.3% | 20.6% |
| █ £20.0+ | 15.5% | 15.3% |
| █ £30.0+ | 11.8% | 11.5% |
Inner London homes by lighting cost per square meters
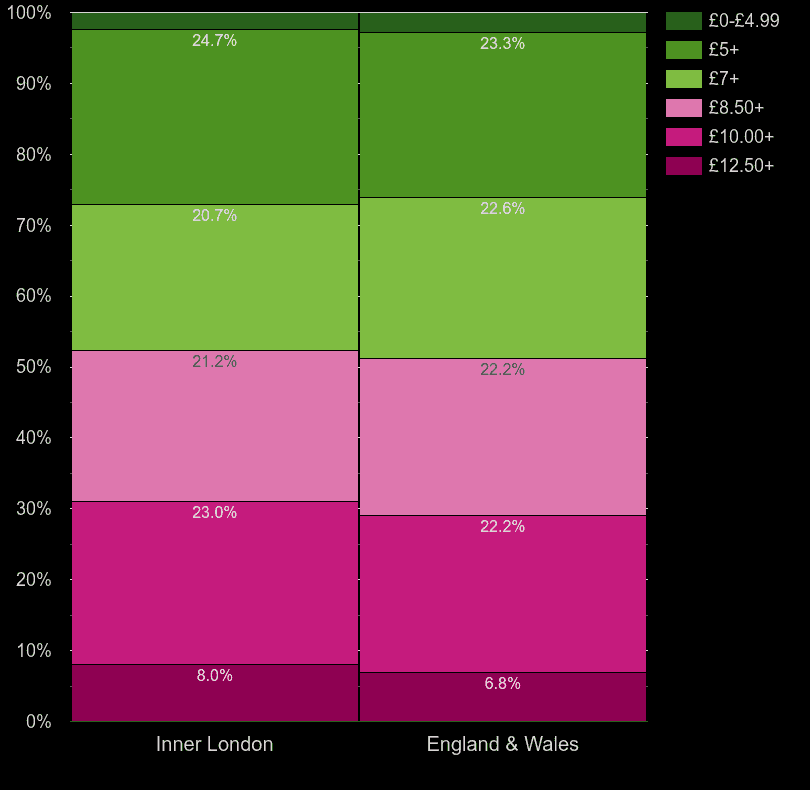
| Lighting cost per 10m² per year | Inner London | England & Wales |
|---|
| █ £0-£4.99 | 2.4% | 2.8% |
| █ £5+ | 24.7% | 23.3% |
| █ £7+ | 20.7% | 22.6% |
| █ £8.50+ | 21.2% | 22.2% |
| █ £10.00+ | 23.0% | 22.2% |
| █ £12.50+ | 8.0% | 6.8% |
Inner London homes by heating cost per room
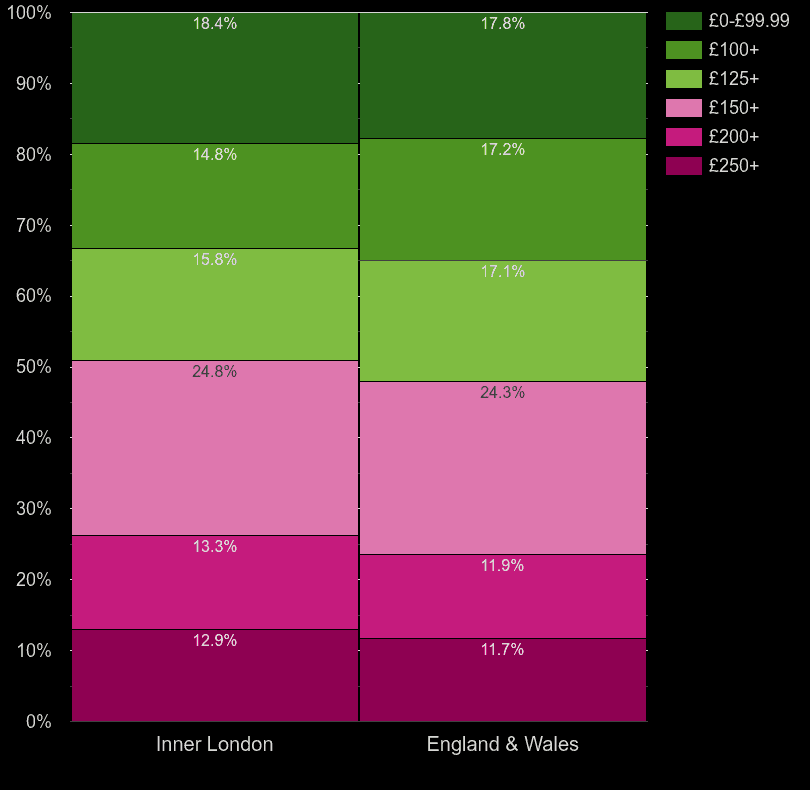
| Heating cost per 10m² per habitable room | Inner London | England & Wales |
|---|
| █ £0-£99.99 | 18.4% | 17.8% |
| █ £100+ | 14.8% | 17.2% |
| █ £125+ | 15.8% | 17.1% |
| █ £150+ | 24.8% | 24.3% |
| █ £200+ | 13.3% | 11.9% |
| █ £250+ | 12.9% | 11.7% |
Inner London homes by hot water cost per room
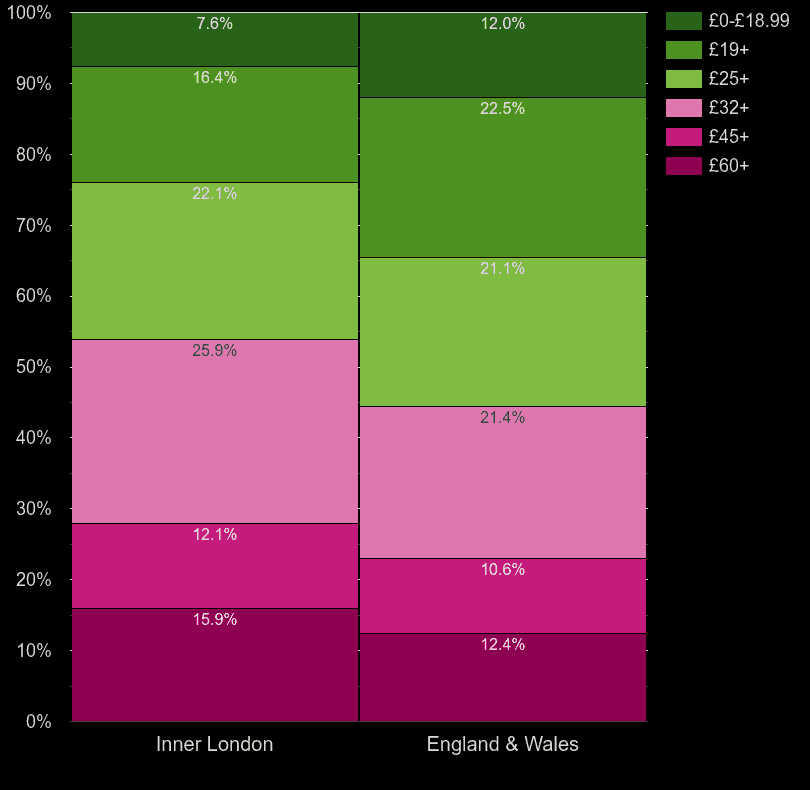
| Hot water cost per 10m² per habitable room | Inner London | England & Wales |
|---|
| █ £0-£18.99 | 7.6% | 12.0% |
| █ £19+ | 16.4% | 22.5% |
| █ £25+ | 22.0% | 21.1% |
| █ £32+ | 25.9% | 21.4% |
| █ £45+ | 12.1% | 10.6% |
| █ £60+ | 15.9% | 12.4% |
Inner London homes by lighting cost per room
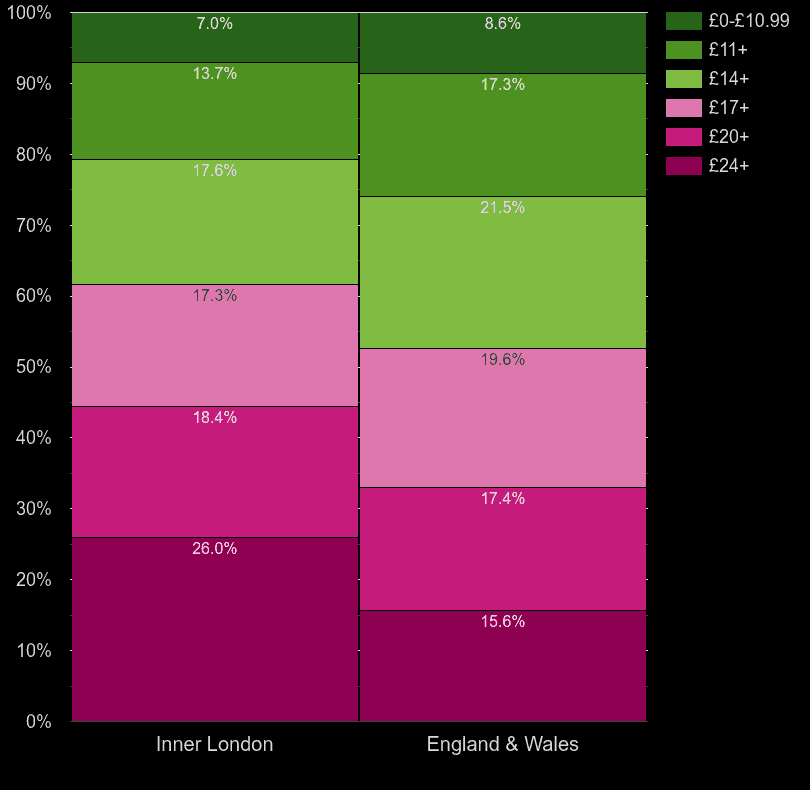
| Lighting cost per 10m² per habitable room | Inner London | England & Wales |
|---|
| █ £0-£10.99 | 7.0% | 8.6% |
| █ £11+ | 13.6% | 17.3% |
| █ £14+ | 17.6% | 21.5% |
| █ £17+ | 17.3% | 19.6% |
| █ £20+ | 18.4% | 17.4% |
| █ £24+ | 26.0% | 15.6% |
Associated reports: