Inner London home energy efficiency
The following charts compare home (both flats and houses) energy efficiency in Inner London postcode area to the home energy efficiency in whole England and Wales. Outer ring charts show share in Inner London, inner charts show share for England and Wales. Data is taken from energy efficiency for domestic buildings. The certificates were issued between 2008-2016. Data is available for more than 50% of all domestic properties. In case of multiple certificate for one property, only the latest available certificate data was used in the charts.
Inner London homes by energy rating
The latest available energy rating converted into a linear 'A to G' rating (from the most energy efficient to the least energy efficient - G). Energy rating was measured in the period of 2008-2016
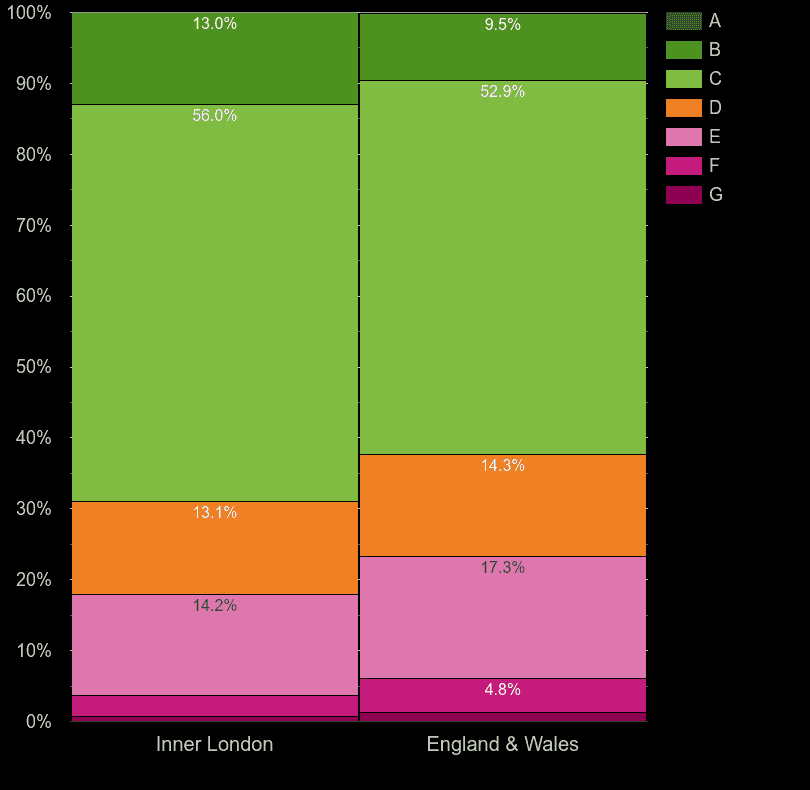
| Energy rating | Inner London | England & Wales |
|---|
| █ A | 0.1% | 0.1% |
| █ B | 13.0% | 9.5% |
| █ C | 56.0% | 52.9% |
| █ D | 13.1% | 14.3% |
| █ E | 14.2% | 17.3% |
| █ F | 3.0% | 4.8% |
| █ G | 0.7% | 1.2% |
Inner London homes by potential energy rating
Estimated potential energy rating converted into a linear 'A to G' rating (A - is the most energy efficient)
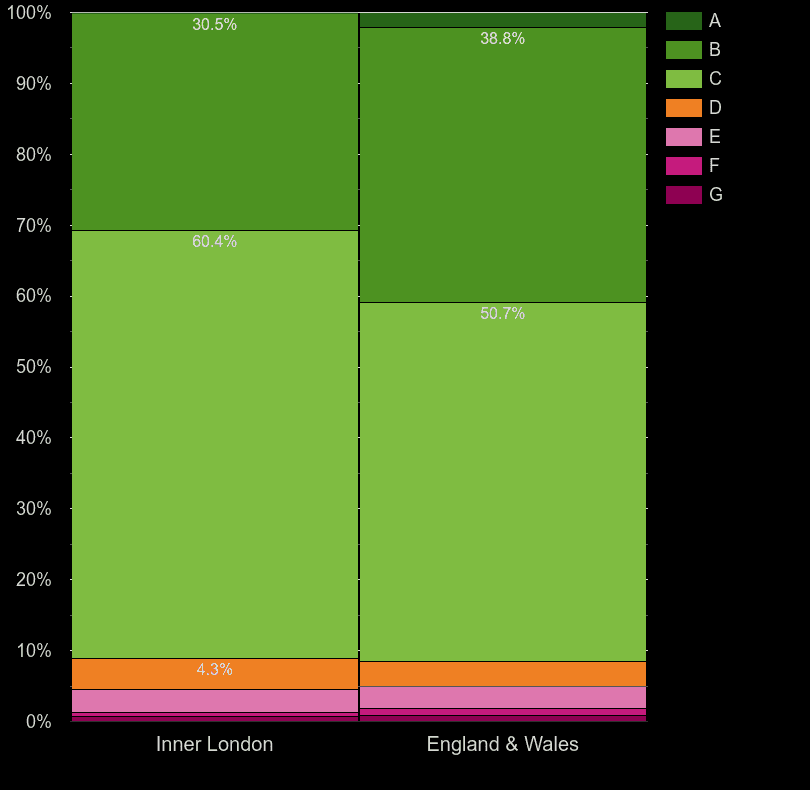
| Potential energy rating | Inner London | England & Wales |
|---|
| █ A | 0.2% | 2.1% |
| █ B | 30.5% | 38.8% |
| █ C | 60.4% | 50.7% |
| █ D | 4.3% | 3.4% |
| █ E | 3.2% | 3.2% |
| █ F | 0.6% | 0.9% |
| █ G | 0.7% | 0.9% |
Inner London homes by main heating control energy efficiency
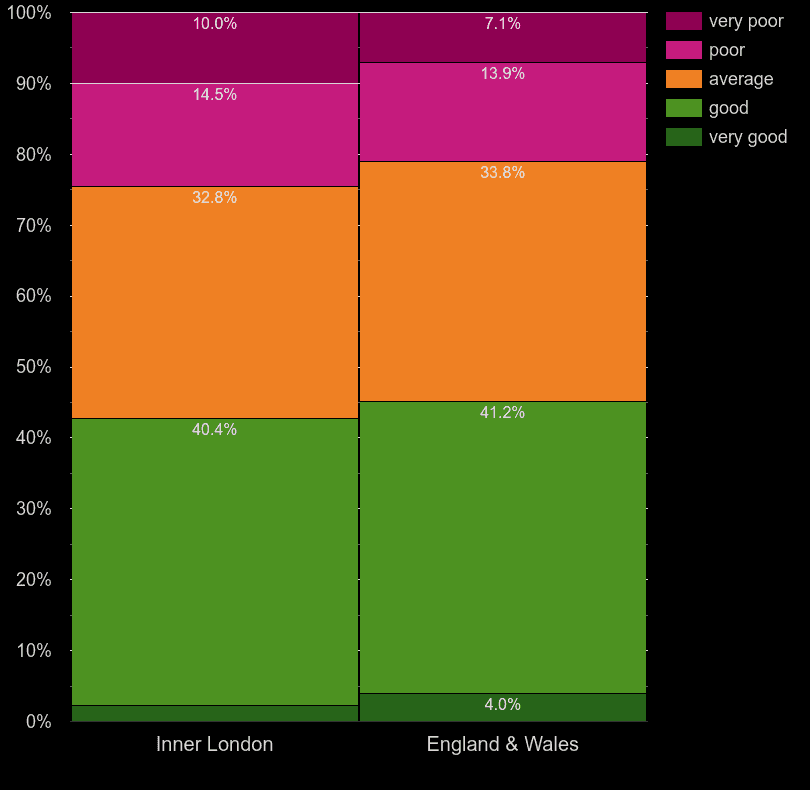
| Main heating control | Inner London | England & Wales |
|---|
| █ very poor | 10.0% | 7.1% |
| █ poor | 14.5% | 13.9% |
| █ average | 32.7% | 33.8% |
| █ good | 40.4% | 41.2% |
| █ very good | 2.3% | 4.0% |
Inner London homes by main heating energy efficiency
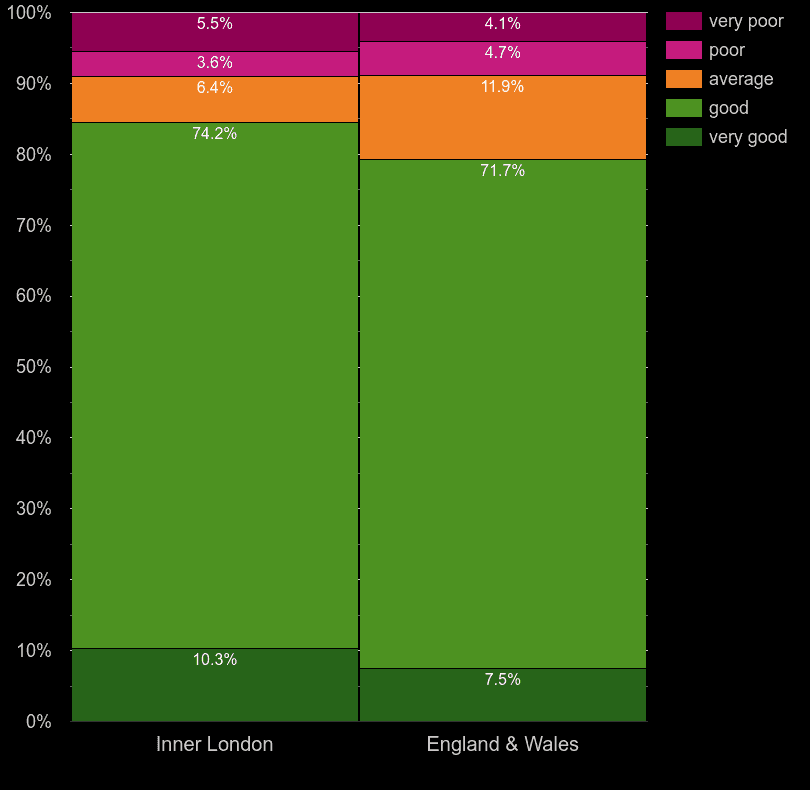
| Main heat efficiency | Inner London | England & Wales |
|---|
| █ very poor | 5.5% | 4.1% |
| █ poor | 3.6% | 4.7% |
| █ average | 6.4% | 11.9% |
| █ good | 74.2% | 71.7% |
| █ very good | 10.3% | 7.5% |
Inner London homes by walls energy efficiency
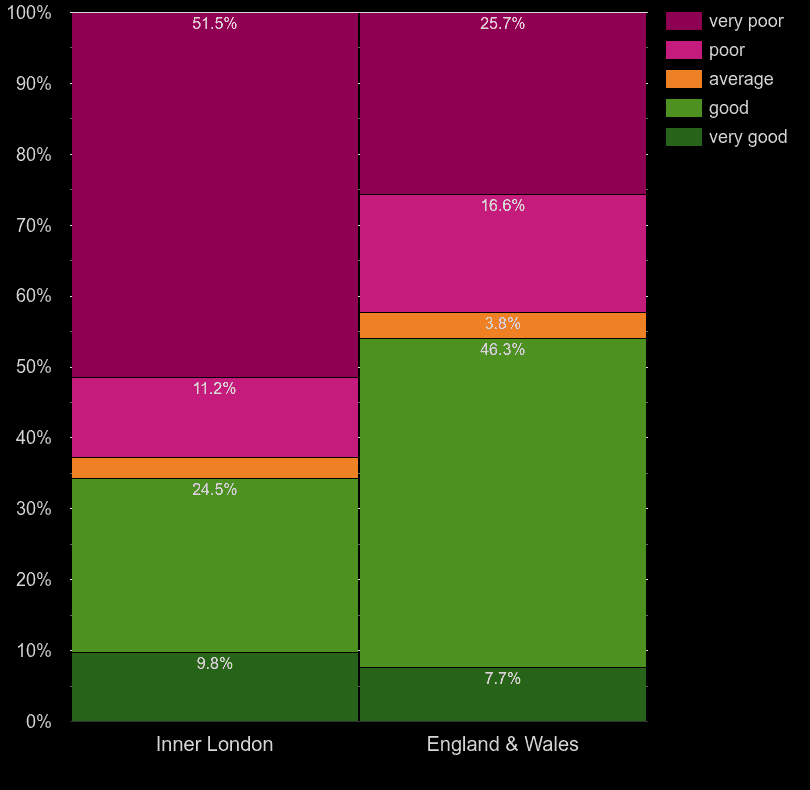
| Walls efficiency | Inner London | England & Wales |
|---|
| █ very poor | 51.7% | 25.7% |
| █ poor | 11.0% | 16.6% |
| █ average | 3.0% | 3.8% |
| █ good | 24.4% | 46.3% |
| █ very good | 9.8% | 7.7% |
Inner London homes by windows energy efficiency
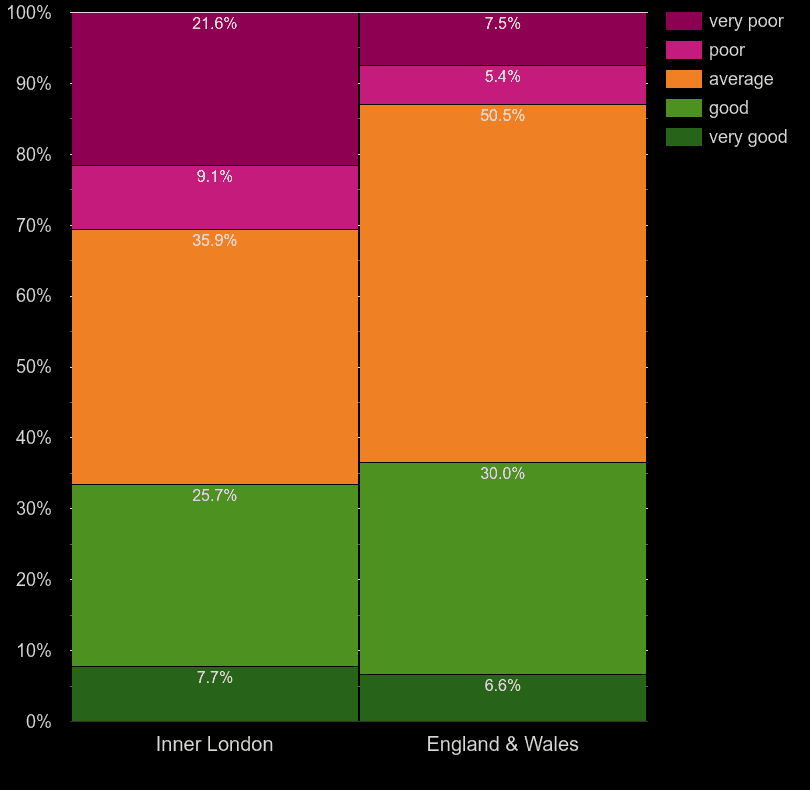
| Windows efficiency | Inner London | England & Wales |
|---|
| █ very poor | 21.6% | 7.5% |
| █ poor | 9.1% | 5.4% |
| █ average | 35.8% | 50.5% |
| █ good | 25.7% | 30.0% |
| █ very good | 7.7% | 6.6% |
Inner London homes by hot water heating energy efficiency
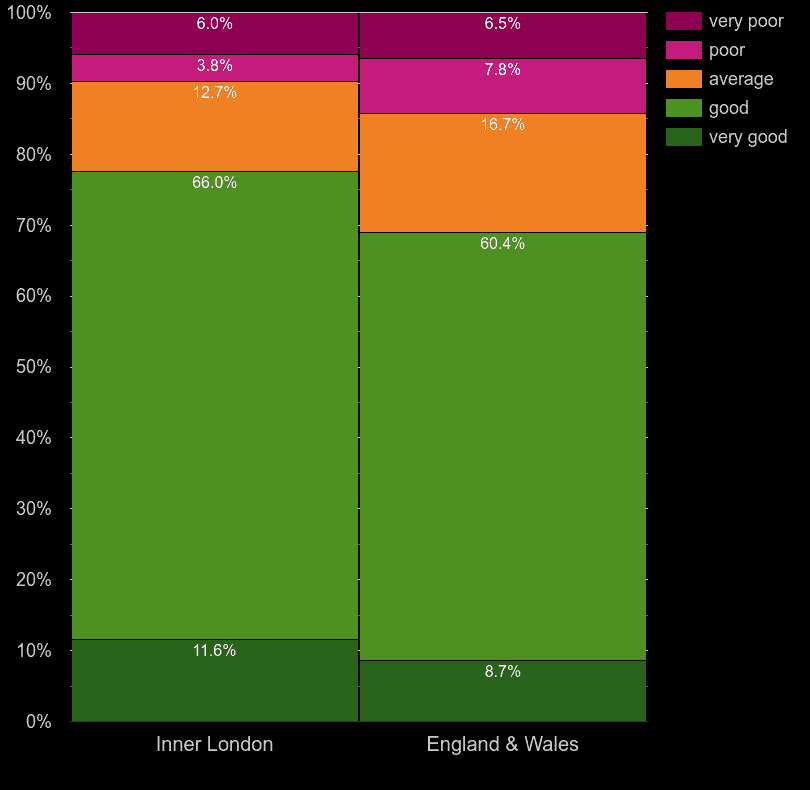
| Hot water heating energy efficiency | Inner London | England & Wales |
|---|
| █ very poor | 6.0% | 6.5% |
| █ poor | 3.8% | 7.8% |
| █ average | 12.7% | 16.7% |
| █ good | 66.0% | 60.4% |
| █ very good | 11.6% | 8.7% |
Inner London homes by lighting energy efficiency
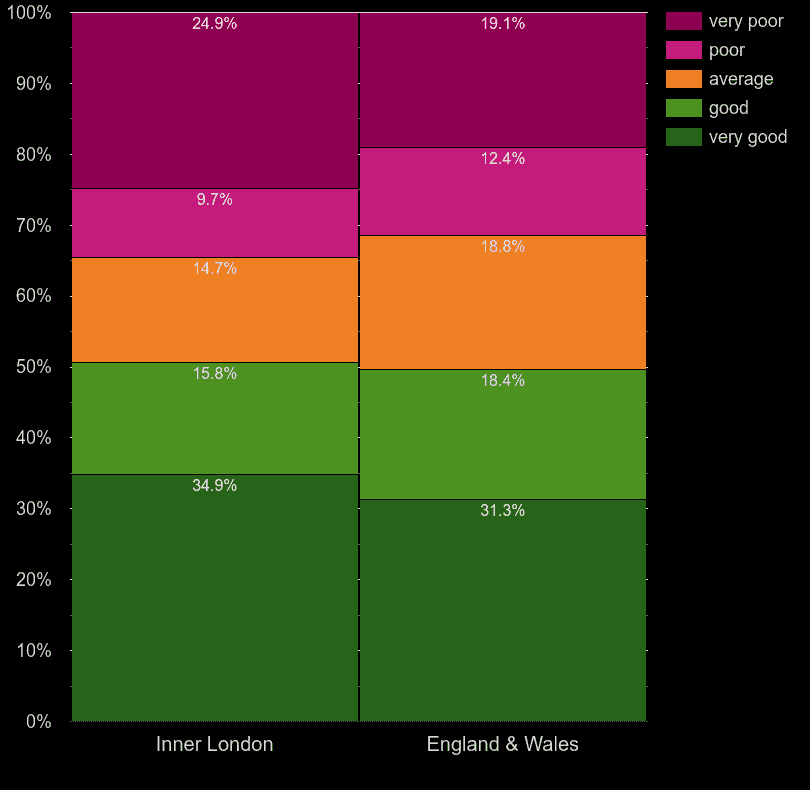
| Lightning energy efficiency | Inner London | England & Wales |
|---|
| █ very poor | 24.9% | 19.1% |
| █ poor | 9.7% | 12.4% |
| █ average | 14.7% | 18.8% |
| █ good | 15.8% | 18.4% |
| █ very good | 34.9% | 31.3% |
Associated reports:


