London compared to other regions
|
| London | East Midlands | East of England | North East | North West | South East | South West | West Midlands | Yorkshire | Wales | ENG+WAL |
| Antisoc. behaviour | █▌27.0 | █▌18.0 | █▌13.0 | █▌22.4 | █▌10.9 | █▌13.1 | █▌16.2 | █▌11.6 | █▌16.1 | █▌13.7 | 16.2 |
| Burglary | █▌5.5 | █▌3.8 | █▌3.1 | █▌4.5 | █▌1.9 | █▌2.8 | █▌3.0 | █▌4.3 | █▌5.4 | █▌2.5 | 3.7 |
| C. damage,arson | █▌6.3 | █▌8.4 | █▌7.1 | █▌11.5 | █▌4.9 | █▌7.0 | █▌7.1 | █▌7.7 | █▌9.3 | █▌7.7 | 7.3 |
| Drugs | █▌6.3 | █▌3.2 | █▌3.2 | █▌3.2 | █▌3.3 | █▌3.0 | █▌2.1 | █▌2.9 | █▌3.9 | █▌2.9 | 3.6 |
| Public order | █▌6.8 | █▌7.8 | █▌5.8 | █▌8.5 | █▌5.2 | █▌6.6 | █▌7.1 | █▌6.4 | █▌9.3 | █▌8.6 | 6.9 |
| Robbery | █▌3.6 | █▌1.1 | █▌0.8 | █▌1.2 | █▌0.5 | █▌0.8 | █▌0.8 | █▌1.6 | █▌1.4 | █▌0.5 | 1.4 |
| Shoplifting | █▌10.1 | █▌9.6 | █▌7.8 | █▌12.3 | █▌3.8 | █▌8.7 | █▌7.2 | █▌9.3 | █▌9.4 | █▌6.7 | 8.3 |
| Theft fm pers. | █▌9.7 | █▌0.6 | █▌0.7 | █▌0.5 | █▌0.3 | █▌0.6 | █▌0.4 | █▌0.6 | █▌0.7 | █▌0.4 | 2.0 |
| Vehicle crime | █▌9.6 | █▌4.5 | █▌5.0 | █▌4.2 | █▌2.0 | █▌4.0 | █▌3.1 | █▌6.9 | █▌6.0 | █▌3.0 | 5.1 |
| Violent crime | █▌31.2 | █▌38.2 | █▌35.3 | █▌40.4 | █▌25.0 | █▌34.4 | █▌36.3 | █▌41.1 | █▌46.5 | █▌35.5 | 35.4 |
| Weapon posses. | █▌0.7 | █▌1.1 | █▌1.0 | █▌1.0 | █▌0.6 | █▌1.0 | █▌0.7 | █▌1.7 | █▌1.1 | █▌0.8 | 1.0 |
|
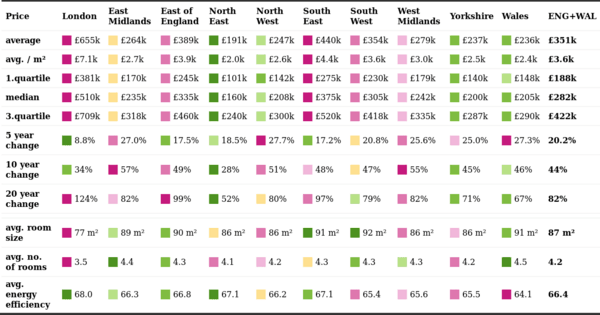
| Price | London | East Midlands | East of England | North East | North West | South East | South West | West Midlands | Yorkshire | Wales | ENG+WAL |
| average | █▌£647k | █▌£264k | █▌£390k | █▌£196k | █▌£250k | █▌£441k | █▌£354k | █▌£282k | █▌£238k | █▌£239k | £351k |
| avg. / m² | █▌£7.1k | █▌£2.7k | █▌£3.9k | █▌£2.1k | █▌£2.6k | █▌£4.4k | █▌£3.5k | █▌£3.0k | █▌£2.5k | █▌£2.4k | £3.6k |
| 1.quartile | █▌£380k | █▌£170k | █▌£245k | █▌£103k | █▌£145k | █▌£275k | █▌£229k | █▌£180k | █▌£142k | █▌£148k | £188k |
| median | █▌£505k | █▌£235k | █▌£338k | █▌£160k | █▌£210k | █▌£375k | █▌£305k | █▌£245k | █▌£200k | █▌£205k | £282k |
| 3.quartile | █▌£710k | █▌£315k | █▌£460k | █▌£240k | █▌£300k | █▌£520k | █▌£418k | █▌£335k | █▌£289k | █▌£290k | £420k |
| 5 year change | █▌5.2% | █▌21.8% | █▌14.4% | █▌15.7% | █▌23.6% | █▌12.6% | █▌15.8% | █▌22.5% | █▌21.2% | █▌24.2% | 15.1% |
| 10 year change | █▌29% | █▌54% | █▌45% | █▌27% | █▌51% | █▌41% | █▌44% | █▌53% | █▌43% | █▌46% | 41% |
| 20 year change | █▌120% | █▌81% | █▌99% | █▌47% | █▌78% | █▌96% | █▌79% | █▌84% | █▌67% | █▌64% | 80% |
| Size, efficiency | low █▌█▌█▌█▌█▌█▌█▌ high |
| avg. room size | █▌77 m² | █▌89 m² | █▌90 m² | █▌86 m² | █▌86 m² | █▌91 m² | █▌92 m² | █▌86 m² | █▌86 m² | █▌91 m² | 87 m² |
| avg. no. of rooms | █▌3.5 | █▌4.4 | █▌4.3 | █▌4.1 | █▌4.2 | █▌4.3 | █▌4.3 | █▌4.3 | █▌4.2 | █▌4.5 | 4.2 |
| avg. energy efficiency | █▌68.0 | █▌66.3 | █▌66.8 | █▌67.1 | █▌66.2 | █▌67.1 | █▌65.4 | █▌65.6 | █▌65.5 | █▌64.1 | 66.4 |
| Total properties sold | █▌72943 | █▌65342 | █▌77286 | █▌30502 | █▌90261 | █▌111192 | █▌73637 | █▌61751 | █▌65315 | █▌34697 | 682926 |
|
| London | East Midlands | East of England | North East | North West | South East | South West | West Midlands | Yorkshire | Wales | ENG+WAL |
| Average age in years | █▌37.1 | █▌41.5 | █▌41.4 | █▌42.0 | █▌40.6 | █▌41.5 | █▌43.2 | █▌40.4 | █▌40.7 | █▌42.5 | 40.8 |
| Population density per km² | █▌5.8k | █▌323 | █▌344 | █▌297 | █▌546 | █▌505 | █▌247 | █▌476 | █▌384 | █▌153 | 409 |
| Avg. age change in yrs since 2002 | █▌1.3 | █▌2.4 | █▌2.2 | █▌2.6 | █▌1.8 | █▌2.3 | █▌2.4 | █▌1.7 | █▌2.0 | █▌2.8 | 2.0 |
| Population % change since 2002 | █▌23.2% | █▌19.0% | █▌21.1% | █▌9.0% | █▌14.0% | █▌19.9% | █▌18.4% | █▌16.7% | █▌13.5% | █▌9.0% | 17.5% |
|
| London | East Midlands | East of England | North East | North West | South East | South West | West Midlands | Yorkshire | Wales | ENG+WAL |
|
| Asian | █▌20.7% | █▌7.7% | █▌6.4% | █▌3.5% | █▌8.4% | █▌7.0% | █▌2.8% | █▌13.3% | █▌9.1% | █▌2.9% | 9.3% |
| Black | █▌13.5% | █▌2.5% | █▌2.9% | █▌1.0% | █▌2.3% | █▌2.4% | █▌1.2% | █▌4.5% | █▌2.2% | █▌0.9% | 4.0% |
| Mixed | █▌5.7% | █▌2.3% | █▌2.8% | █▌1.2% | █▌2.2% | █▌2.8% | █▌2.0% | █▌3.0% | █▌2.2% | █▌1.6% | 2.9% |
| Other | █▌6.3% | █▌1.2% | █▌1.4% | █▌0.9% | █▌1.5% | █▌1.5% | █▌0.9% | █▌2.1% | █▌1.5% | █▌0.9% | 2.1% |
| White | █▌53.8% | █▌86.3% | █▌86.5% | █▌93.4% | █▌85.6% | █▌86.3% | █▌93.1% | █▌77.0% | █▌85.0% | █▌93.8% | 81.7% |
|
| Buddhist | █▌0.9% | █▌0.3% | █▌0.4% | █▌0.3% | █▌0.3% | █▌0.6% | █▌0.4% | █▌0.3% | █▌0.3% | █▌0.3% | 0.5% |
| Christian | █▌40.7% | █▌45.6% | █▌46.6% | █▌50.9% | █▌52.5% | █▌46.5% | █▌46.2% | █▌46.6% | █▌44.9% | █▌43.6% | 46.2% |
| Hindu | █▌5.1% | █▌2.3% | █▌1.4% | █▌0.4% | █▌0.7% | █▌1.7% | █▌0.5% | █▌1.5% | █▌0.6% | █▌0.4% | 1.7% |
| Jewish | █▌1.7% | █▌0.1% | █▌0.7% | █▌0.2% | █▌0.4% | █▌0.2% | █▌0.1% | █▌0.1% | █▌0.2% | █▌0.1% | 0.5% |
| Muslim | █▌15.0% | █▌4.2% | █▌3.7% | █▌2.4% | █▌7.6% | █▌3.3% | █▌1.4% | █▌9.6% | █▌8.3% | █▌2.2% | 6.5% |
| No answer | █▌7.0% | █▌5.9% | █▌6.1% | █▌5.0% | █▌5.3% | █▌6.1% | █▌6.4% | █▌5.7% | █▌5.7% | █▌6.3% | 6.0% |
| No religion | █▌27.1% | █▌40.1% | █▌40.2% | █▌40.2% | █▌32.6% | █▌40.2% | █▌44.1% | █▌32.9% | █▌39.2% | █▌46.5% | 37.2% |
| Other | █▌1.6% | █▌1.1% | █▌0.4% | █▌0.3% | █▌0.2% | █▌0.8% | █▌0.1% | █▌2.9% | █▌0.4% | █▌0.1% | 0.9% |
| Sikh | █▌1.0% | █▌0.5% | █▌0.6% | █▌0.4% | █▌0.4% | █▌0.6% | █▌0.6% | █▌0.5% | █▌0.4% | █▌0.5% | 0.6% |
|
| 1. No or low deprivation | █▌48.1% | █▌47.9% | █▌49.6% | █▌45.7% | █▌46.7% | █▌52.0% | █▌50.1% | █▌45.9% | █▌46.7% | █▌45.9% | 48.3% |
| 2. Low - moderate deprivation | █▌32.9% | █▌34.0% | █▌34.0% | █▌33.5% | █▌33.1% | █▌32.8% | █▌33.8% | █▌34.1% | █▌33.7% | █▌33.4% | 33.5% |
| 3. Deprived | █▌14.4% | █▌14.4% | █▌13.2% | █▌16.1% | █▌15.4% | █▌12.2% | █▌13.0% | █▌15.6% | █▌15.2% | █▌16.0% | 14.3% |
| 4. Highly deprived | █▌4.3% | █▌3.5% | █▌3.0% | █▌4.5% | █▌4.5% | █▌2.8% | █▌2.9% | █▌4.2% | █▌4.2% | █▌4.5% | 3.7% |
| Average no. of cars | █▌0.8 | █▌1.3 | █▌1.4 | █▌1.1 | █▌1.2 | █▌1.4 | █▌1.4 | █▌1.3 | █▌1.2 | █▌1.3 | 1.2 |
|
| ENG+WAL |
| Earnings | £44.9k |
| Net income | £34.5k |
| Income after housing costs | £29.1k |
 login →