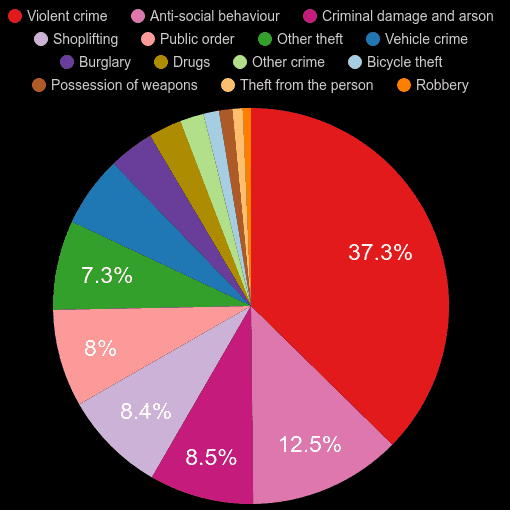
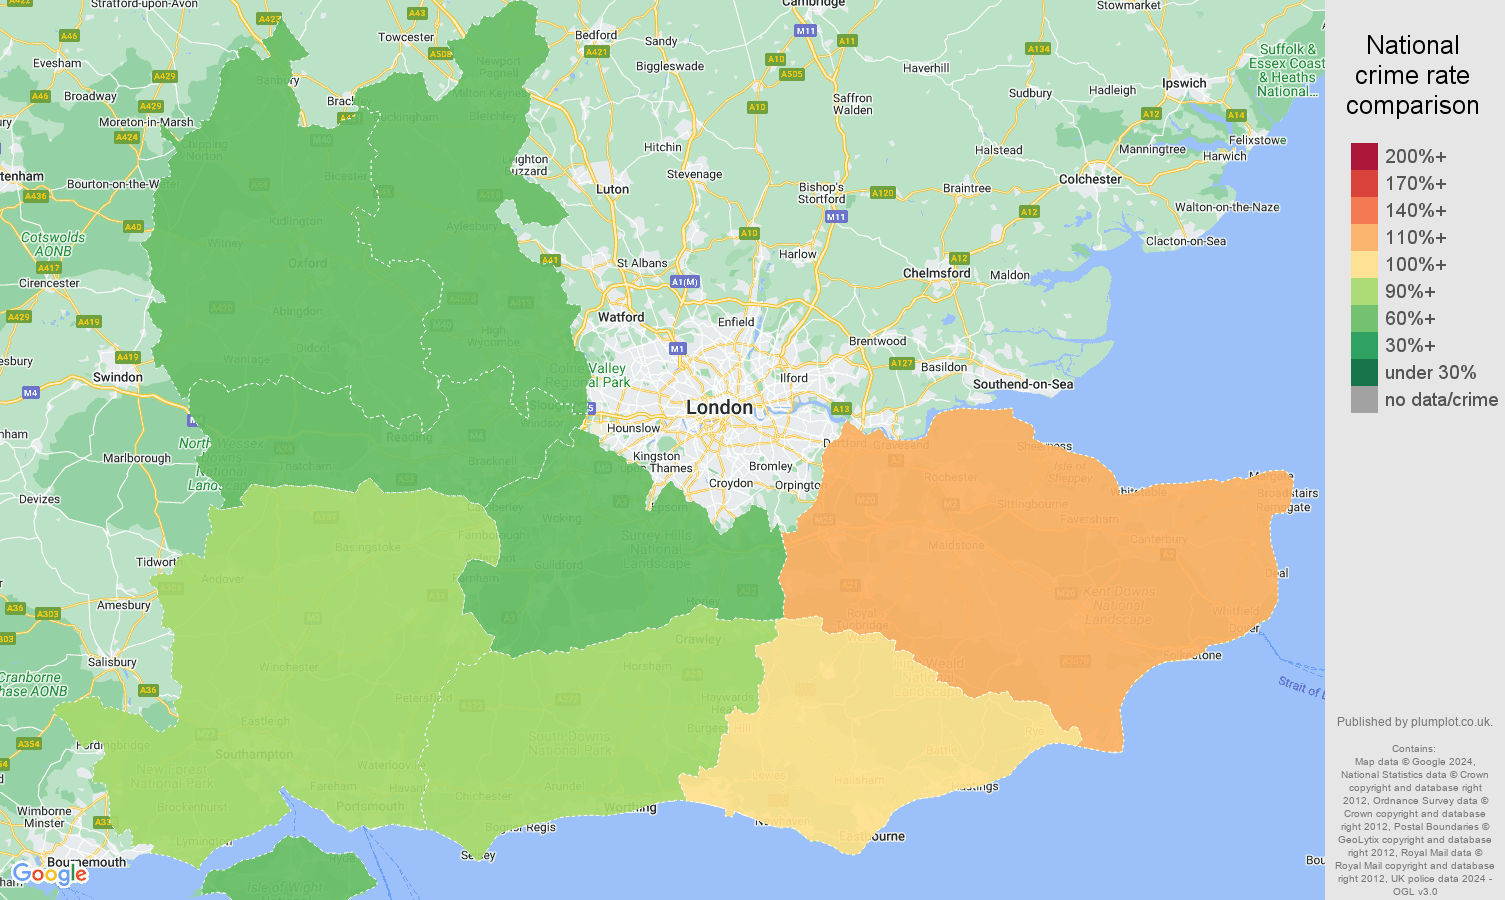
The overall crime rate in South East region is 92.5 crimes per 1,000 which is 92% of the national crime average. Most crimes, 292k crimes were violent crimes which is 37.4% of all crimes committed in the area. Violent crime rate is at 98% of national crime rate. Robbery crime was the fastest growing crime and it increased by 44.3% over the last twelve months.The category of "possession of weapons crime" is the highest ranking crime category when category crime rate is compared to the national average. Possession of weapons crime rate is at 107% of national crime rate which puts South East on 4. position out of 9 England's and Wales' regions in this crime category. Possession of weapons crime makes up 1.1% of all crimes committed in the area. As of May 2026 possession of weapons crime totalled 8.9k representing an increase 6.0% year-over-year.
| Crime statistic | Share of all crimes | Ranking (9 regions) | % of national crime rate | Crime volume | % annual change |
|---|---|---|---|---|---|
| Violent crime → | 37.4% | 3. lowest | 98% | 292k | 0.4% |
| Antisocial behaviour crime → | 15.0% | 4. lowest | 87% | 117k | 14.0% |
| Shoplifting crime → | 9.5% | 4. lowest | 105% | 74.1k | -4.7% |
| Criminal damage and arson crime → | 7.6% | 3. lowest | 97% | 59.4k | -6.4% |
| Public order crime → | 7.1% | 3. lowest | 96% | 55.9k | -7.1% |
| Other theft crime → | 6.7% | 4. highest | 93% | 52.2k | -6.5% |
| Vehicle crime → | 4.4% | 3. lowest | 80% | 34.4k | -14.1% |
| Drugs crime → | 3.3% | 5. highest | 86% | 25.6k | 4.5% |
| Burglary crime → | 3.1% | 2. lowest | 77% | 23.9k | -10.8% |
| Other crime → | 2.3% | 4. lowest | 98% | 17.9k | -5.6% |
| Possession of weapons crime → | 1.1% | 4. highest | 107% | 8.9k | 6.0% |
| Robbery crime → | 1.0% | 4. lowest | 65% | 7.7k | 44.3% |
| Bicycle theft crime → | 0.9% | 3. highest | 101% | 7.3k | -14.7% |
| Theft from the person crime → | 0.6% | 3. lowest | 30% | 4.7k | -26.4% |
| Crime statistic | Share of all crimes | Crime rate ranking | % of national crime rate | Crime volume | % annual change |
| For details, click on the crime name with '→' | |||||
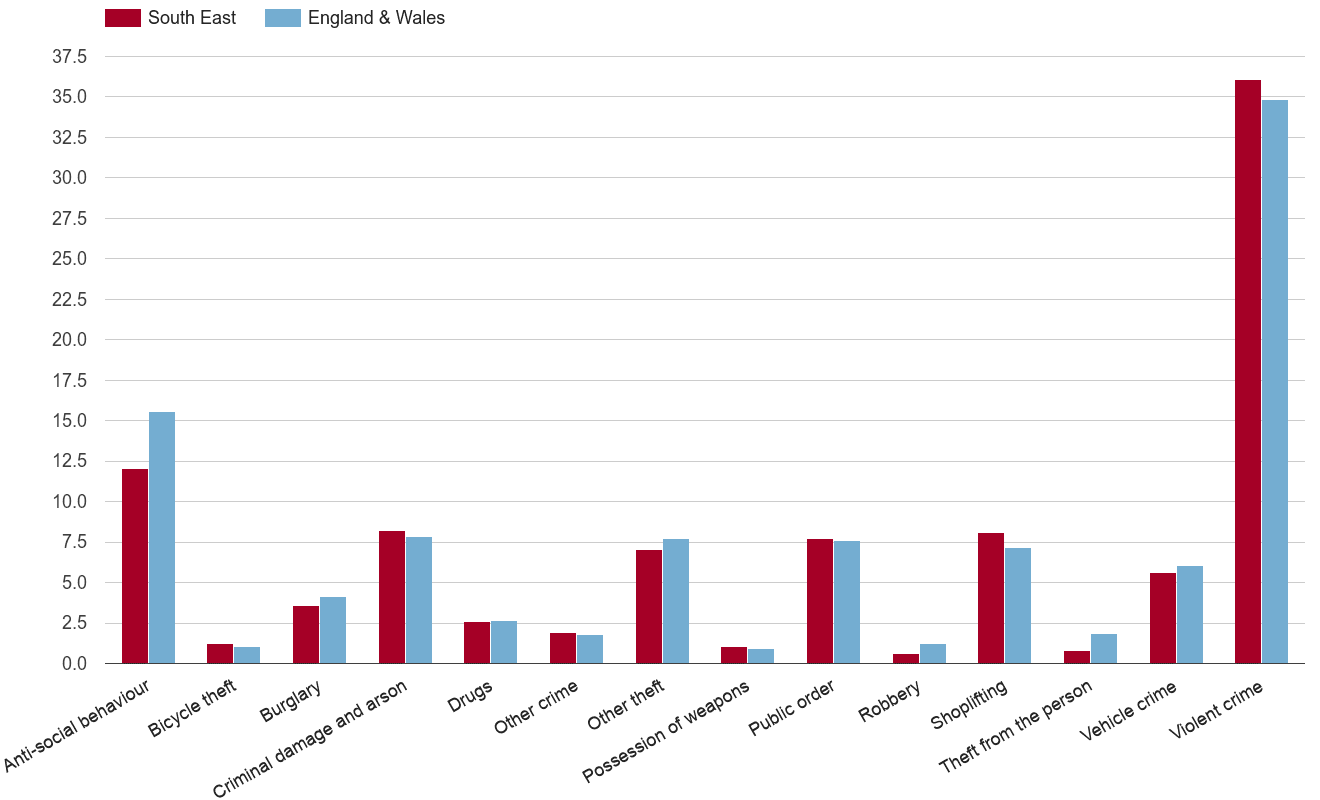
This graph compares crime rate in South East region to the national crime rate for each crime statistic.
| Crime statistic | South East region crime rate | England and Wales - national crime rate |
|---|---|---|
| Anti-social behaviour | 13.9 | 16.0 |
| Bicycle theft | 0.9 | 0.9 |
| Burglary | 2.8 | 3.7 |
| Criminal damage and arson | 7.0 | 7.2 |
| Drugs | 3.0 | 3.5 |
| Other crime | 2.1 | 2.2 |
| Other theft | 6.2 | 6.6 |
| Possession of weapons | 1.1 | 1.0 |
| Public order | 6.6 | 6.9 |
| Robbery | 0.9 | 1.4 |
| Shoplifting | 8.8 | 8.3 |
| Theft from the person | 0.6 | 1.8 |
| Vehicle crime | 4.1 | 5.1 |
| Violent crime | 34.6 | 35.4 |
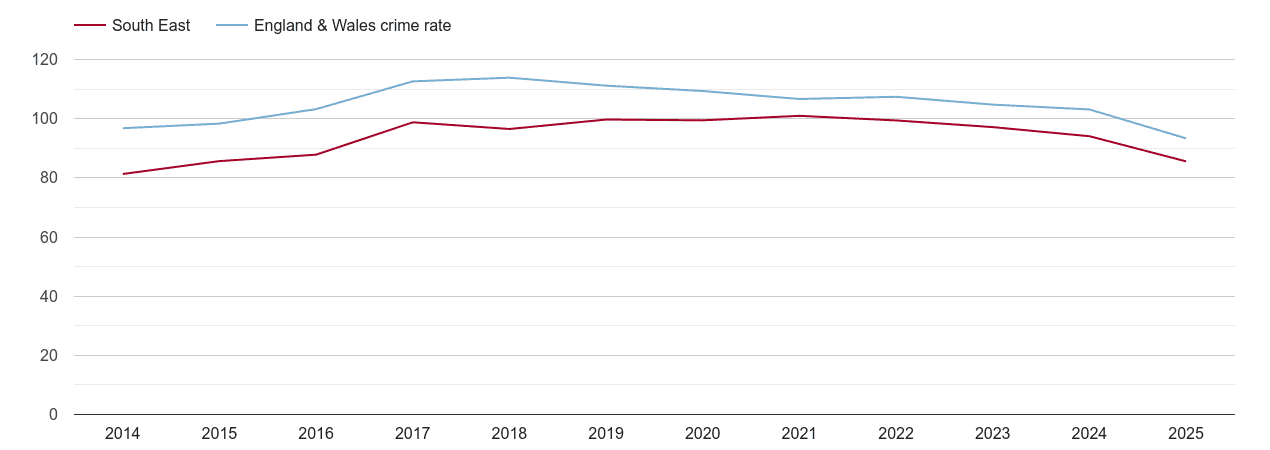
Overall crime rate per 1000 workday people compared to the national crime rate by year.
For details, click on the crime name with '→'
| Violent crime → | 37.4% |
| Antisocial behaviour crime → | 15.0% |
| Shoplifting crime → | 9.5% |
| Criminal damage and arson crime → | 7.6% |
| Public order crime → | 7.1% |
| Other theft crime → | 6.7% |
| Vehicle crime → | 4.4% |
| Drugs crime → | 3.3% |
| Burglary crime → | 3.1% |
| Other crime → | 2.3% |
| Possession of weapons crime → | 1.1% |
| Robbery crime → | 1.0% |
| Bicycle theft crime → | 0.9% |
| Theft from the person crime → | 0.6% |
 login →


