North East house energy efficiency
January 2026
Houses are energy-efficient. The average house energy rating in North East region is 65.5, D rating. This is by 1.7 better score than the average house energy rating in England and Wales. The average potential rating is 81.9, B rating.
North East houses by energy rating
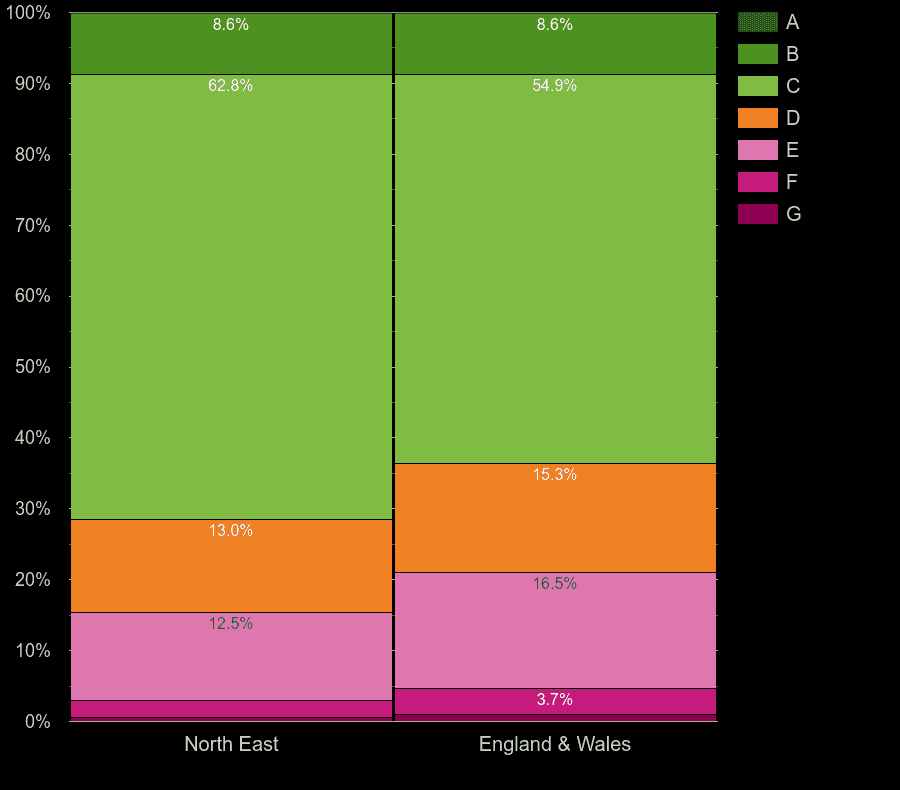
| Energy rating | North East | England & Wales |
|---|
| █ A | 0.2% | 0.3% |
| █ B | 8.2% | 8.2% |
| █ C | 66.0% | 58.7% |
| █ D | 12.0% | 14.2% |
| █ E | 11.0% | 14.5% |
| █ F | 2.1% | 3.2% |
| █ G | 0.6% | 0.9% |
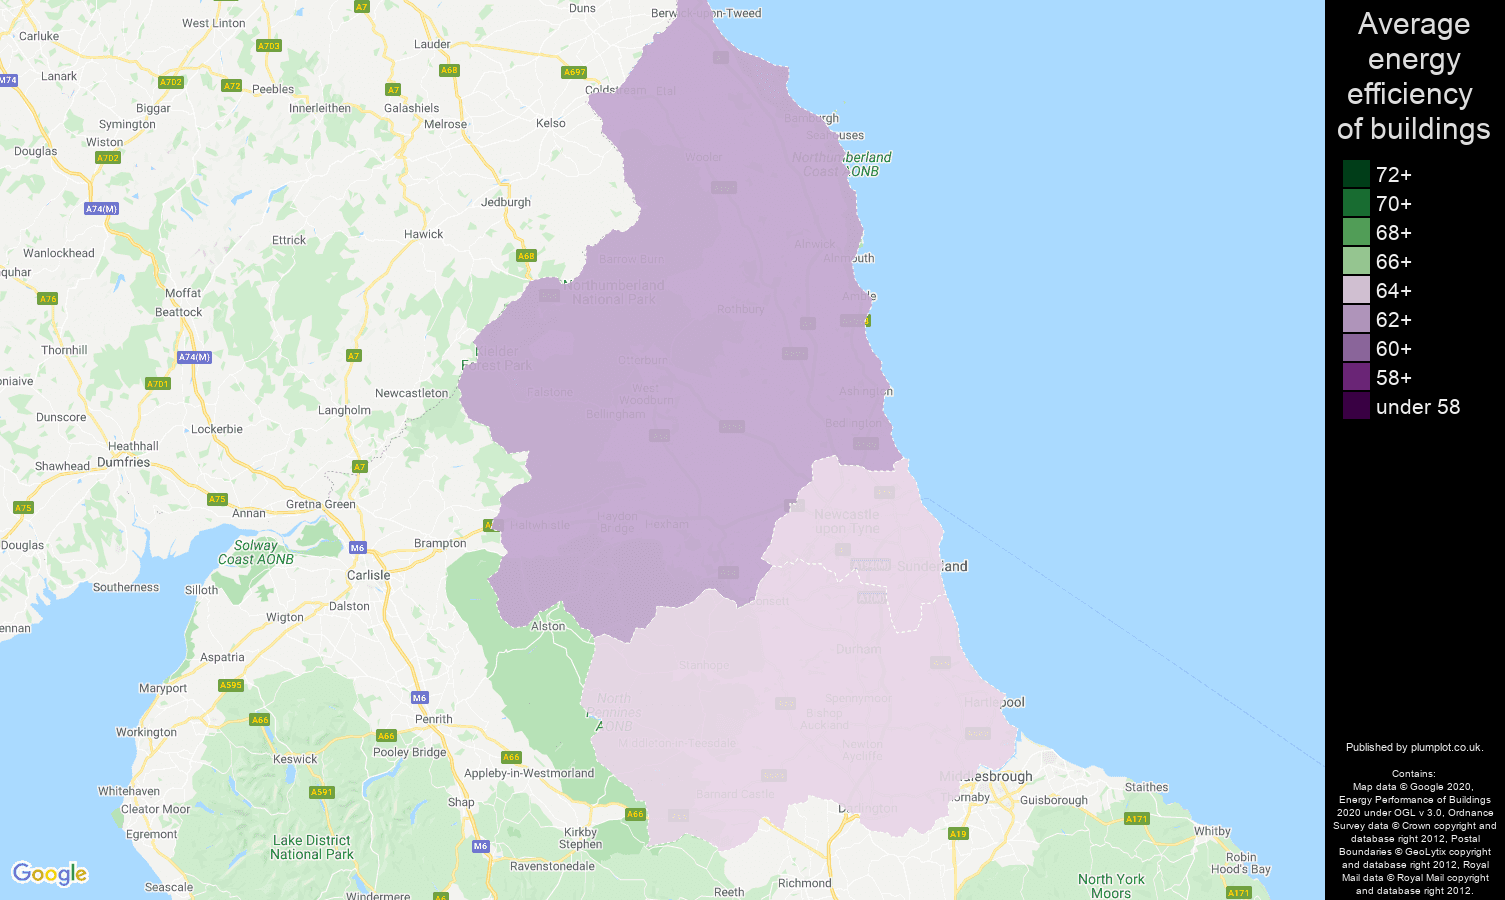
North East map of energy efficiency of houses
North East houses by potential energy rating
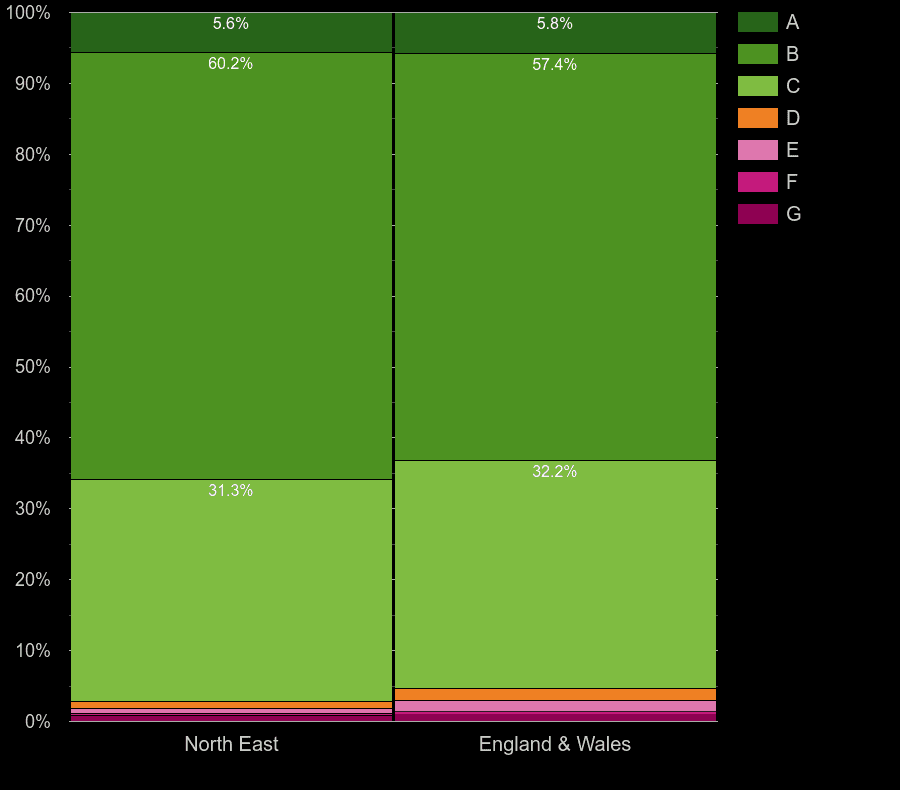
| Potential energy rating | North East | England & Wales |
|---|
| █ A | 5.3% | 5.6% |
| █ B | 61.4% | 59.3% |
| █ C | 30.8% | 31.2% |
| █ D | 0.8% | 1.3% |
| █ E | 0.6% | 1.2% |
| █ F | 0.2% | 0.3% |
| █ G | 0.9% | 1.1% |
North East houses by main heating control energy efficiency
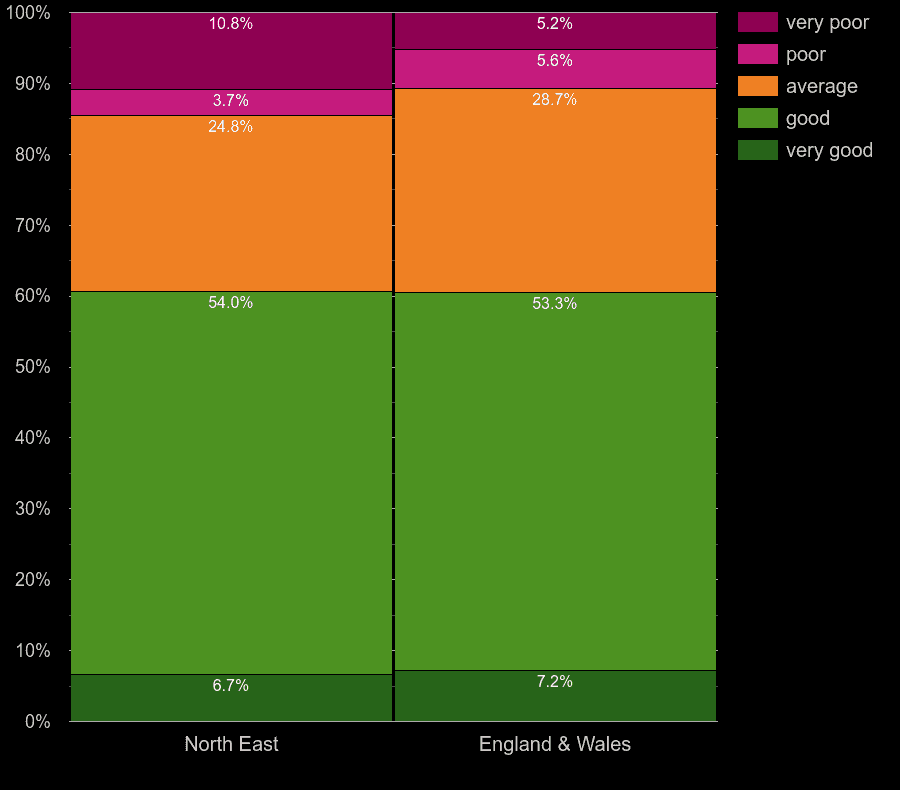
| Main heating control | North East | England & Wales |
|---|
| █ very poor | 9.1% | 4.4% |
| █ poor | 3.3% | 4.9% |
| █ average | 23.3% | 25.9% |
| █ good | 57.8% | 57.8% |
| █ very good | 6.5% | 7.1% |
North East houses by main heating energy efficiency
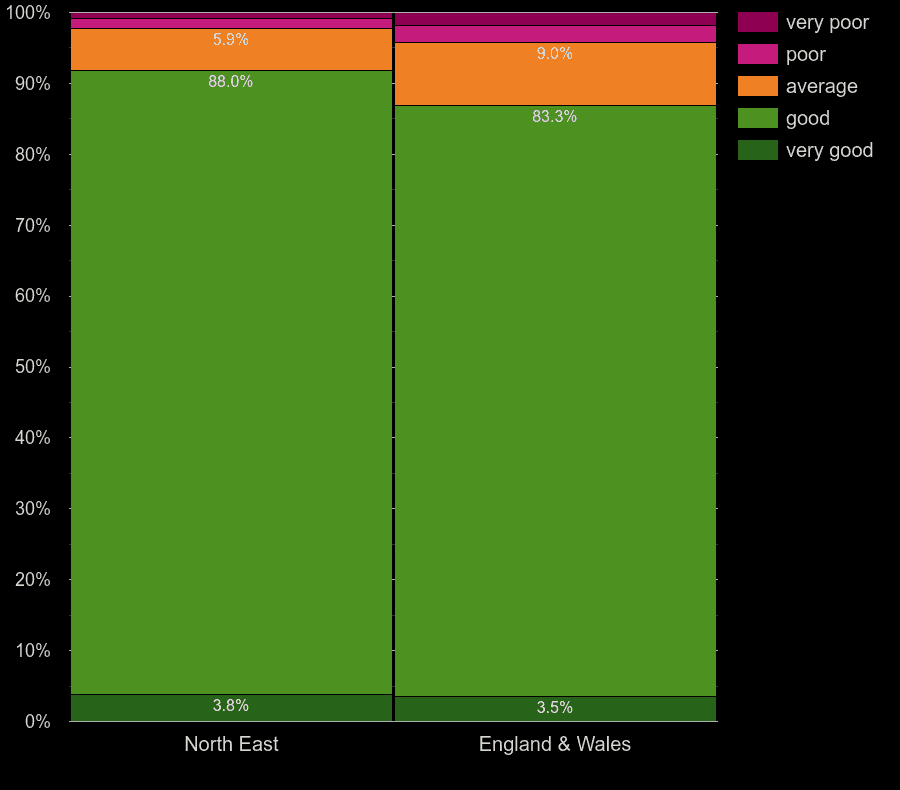
| Main heat efficiency | North East | England & Wales |
|---|
| █ very poor | 0.9% | 1.8% |
| █ poor | 1.4% | 2.3% |
| █ average | 5.5% | 8.5% |
| █ good | 89.1% | 84.5% |
| █ very good | 3.1% | 2.9% |
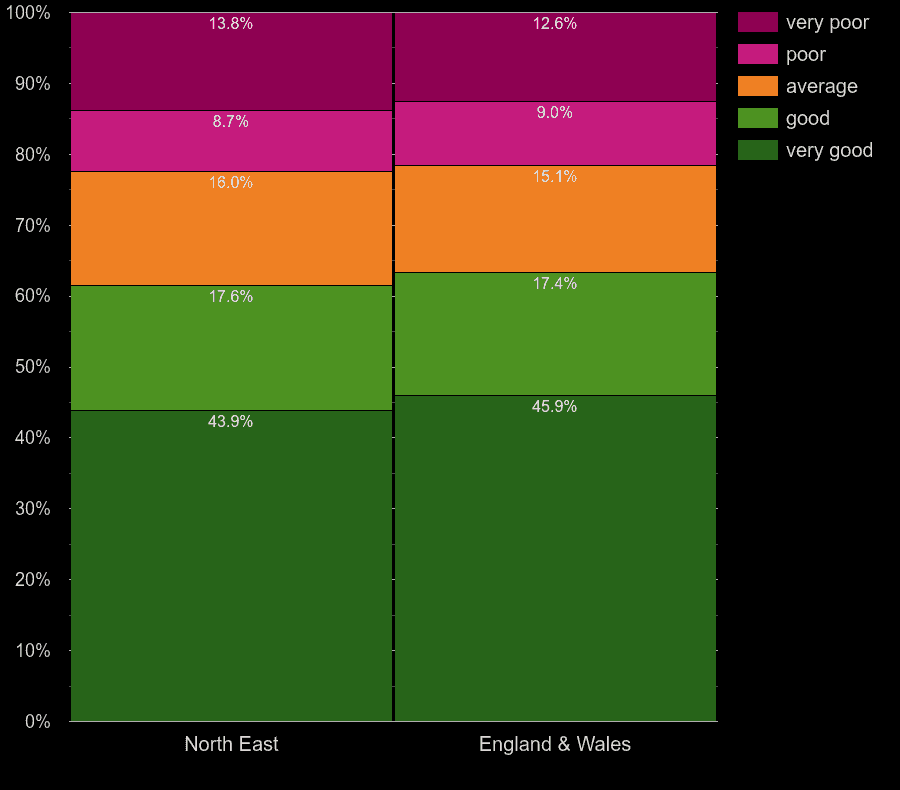
North East houses by walls energy efficiency
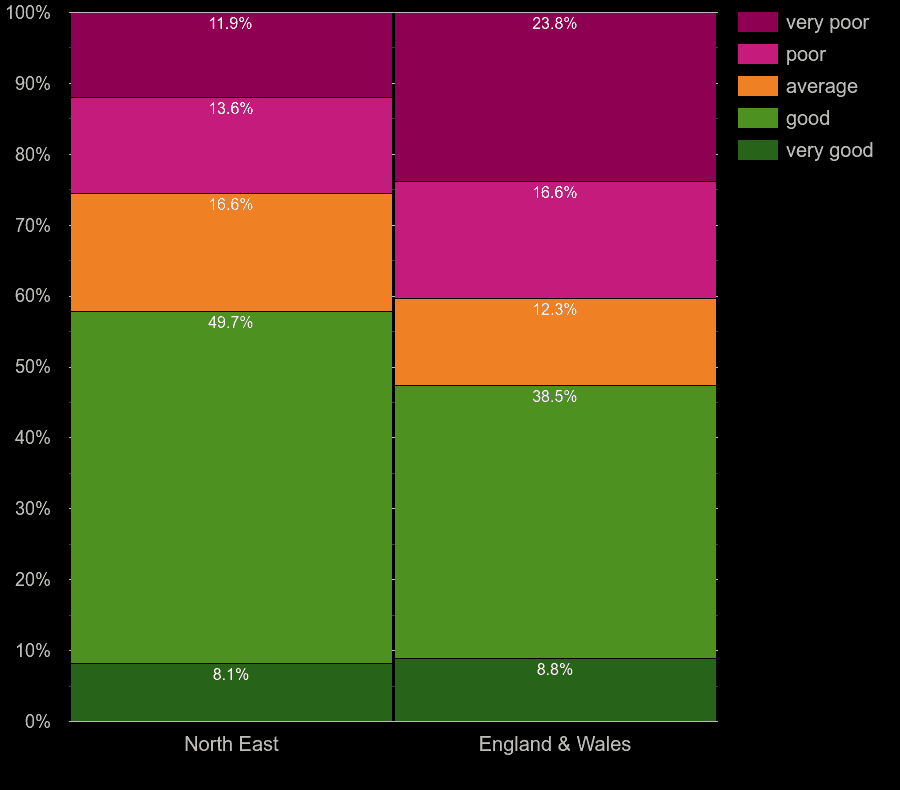
| Walls efficiency | North East | England & Wales |
|---|
| █ very poor | 11.3% | 22.5% |
| █ poor | 13.6% | 16.7% |
| █ average | 21.6% | 15.1% |
| █ good | 45.7% | 37.2% |
| █ very good | 7.8% | 8.5% |
North East houses by windows energy efficiency
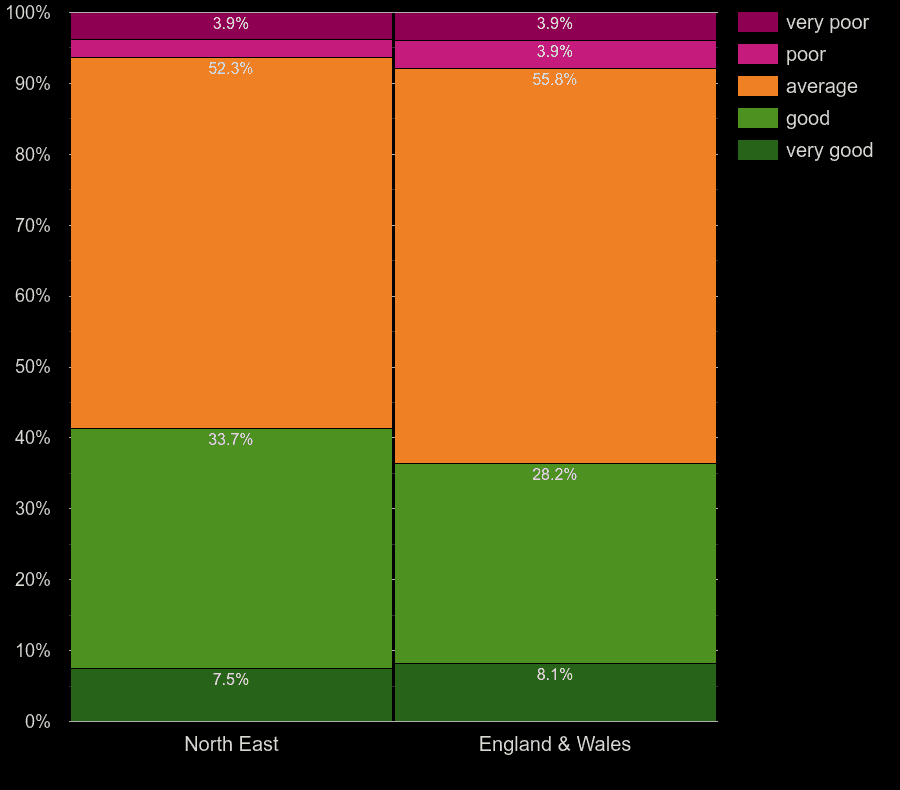
| Windows efficiency | North East | England & Wales |
|---|
| █ very poor | 3.3% | 3.5% |
| █ poor | 3.7% | 4.9% |
| █ average | 53.4% | 55.1% |
| █ good | 32.6% | 29.2% |
| █ very good | 6.8% | 7.3% |
North East houses by hot water heating energy efficiency
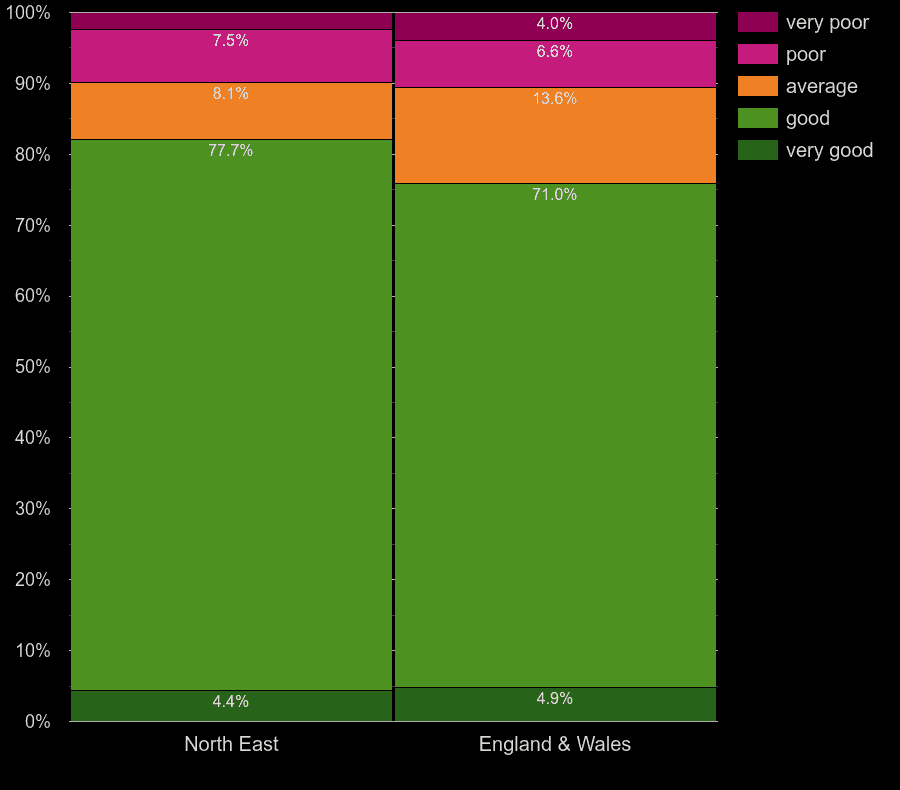
| Hot water heating energy efficiency | North East | England & Wales |
|---|
| █ very poor | 2.2% | 3.7% |
| █ poor | 6.6% | 6.1% |
| █ average | 7.5% | 12.6% |
| █ good | 80.2% | 73.5% |
| █ very good | 3.5% | 4.0% |
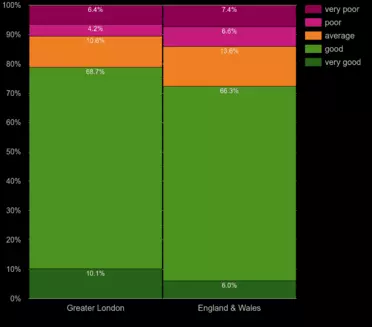
North East houses by lighting energy efficiency
| Lightning energy efficiency | North East | England & Wales |
|---|
| █ very poor | 11.6% | 10.3% |
| █ poor | 7.8% | 7.9% |
| █ average | 14.2% | 13.0% |
| █ good | 17.3% | 17.0% |
| █ very good | 49.2% | 51.8% |
Plumplot area insights - interactive charts and maps

Next for North East region


 login →