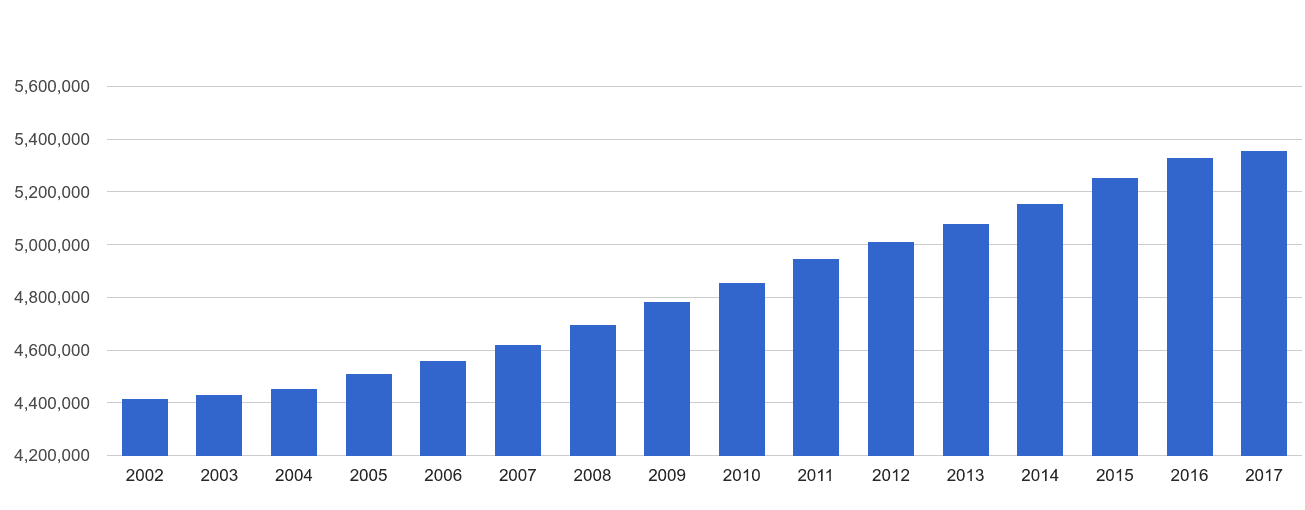
In 2017, the total population of Inner London postcode area was 5.4M. Since 2002, it increased by 939k people, which makes up for 21.3% population growth. Population average age was 35.4. It increased by 0.5 years since 2002.
+939k
population growth since 2002
+21.3%
population growth since 2002
+0.5 yrs
average age change since 2002
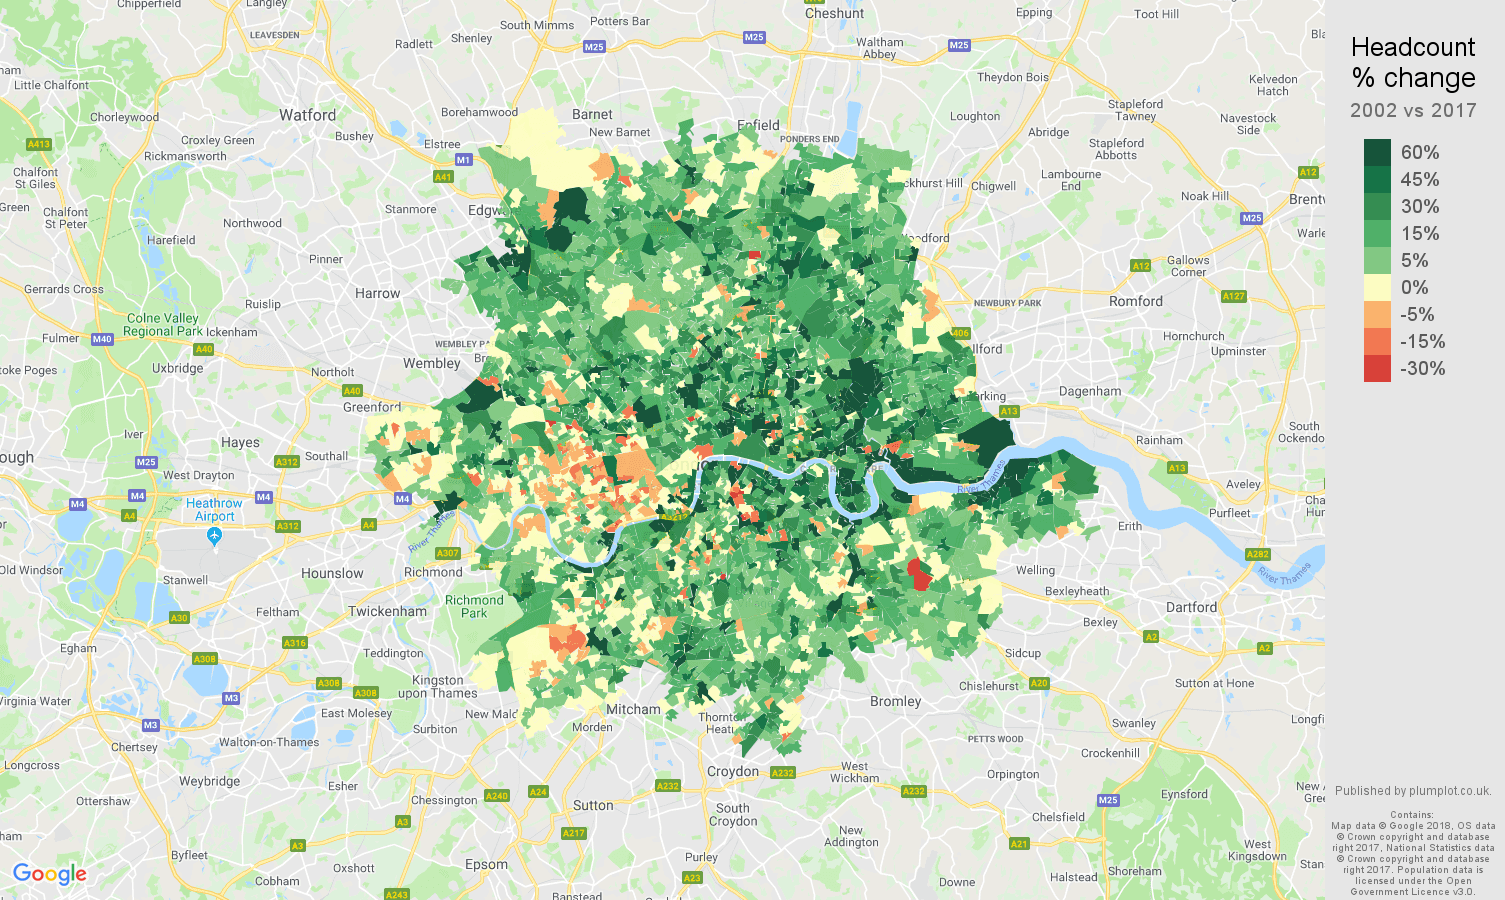
Inner London headcount change map
Compares the latest population estimates with population estimates in 2002 and shows percentage difference.
Inner London headcount change rank
Compares speed of population growth to other postcode areas. Areas with the highest population growth are on the left. Shows relative population change between 2002 and 2017.
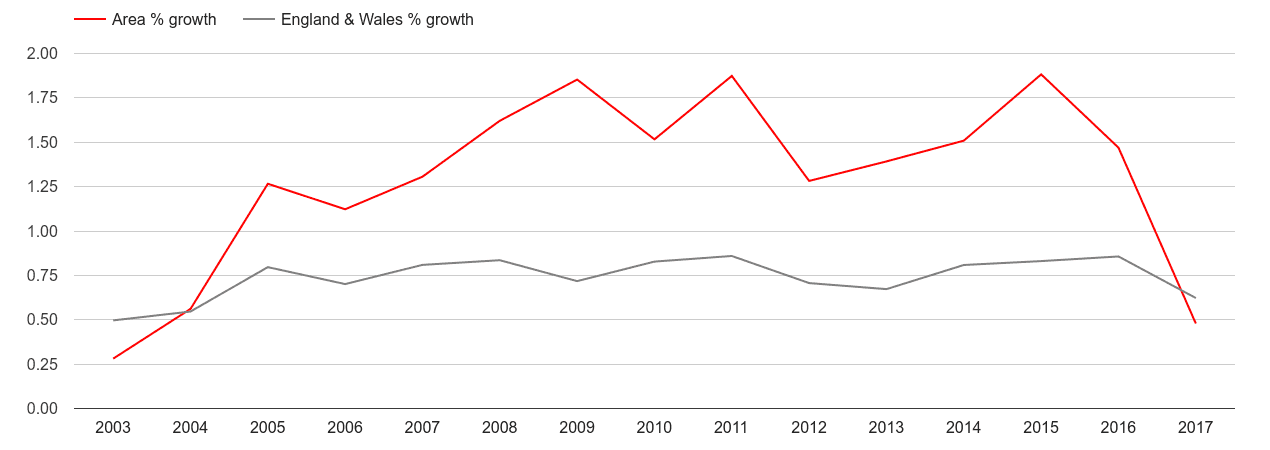
Inner London population growth rate
Shows year over year population change.
Inner London population growth
Shows total population by year.
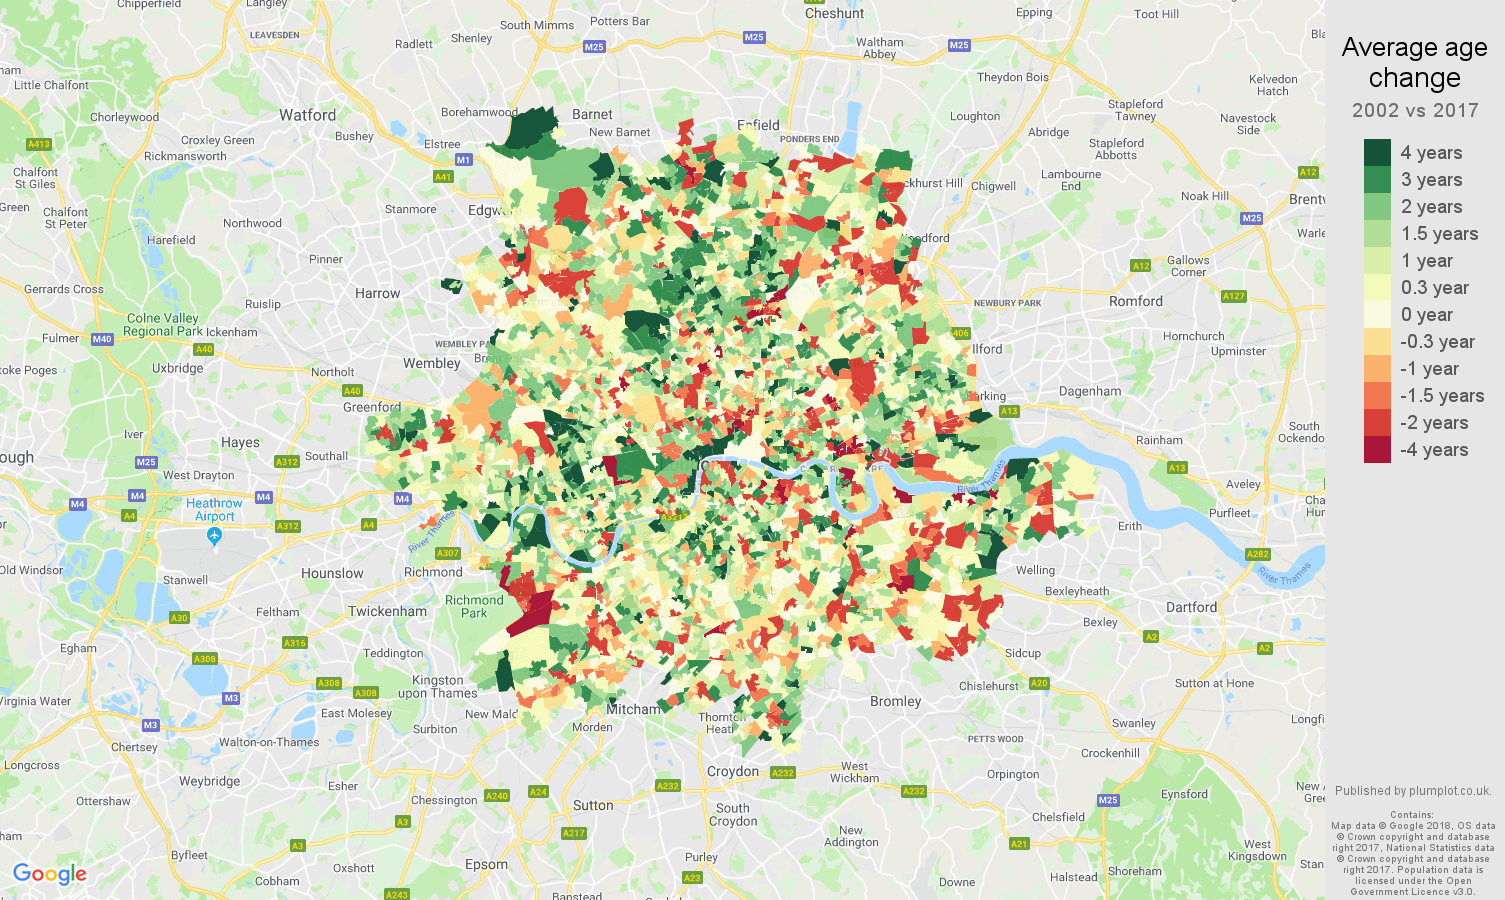
Inner London average age change map
Shows population's average age change since 2002.
Inner London population average age change rank
Compares the speed of average age change in the postcode areas. Areas with the fastest ageing population are on the left, the areas with their population becoming younger are on the right. Compares change between 2002 and 2017.
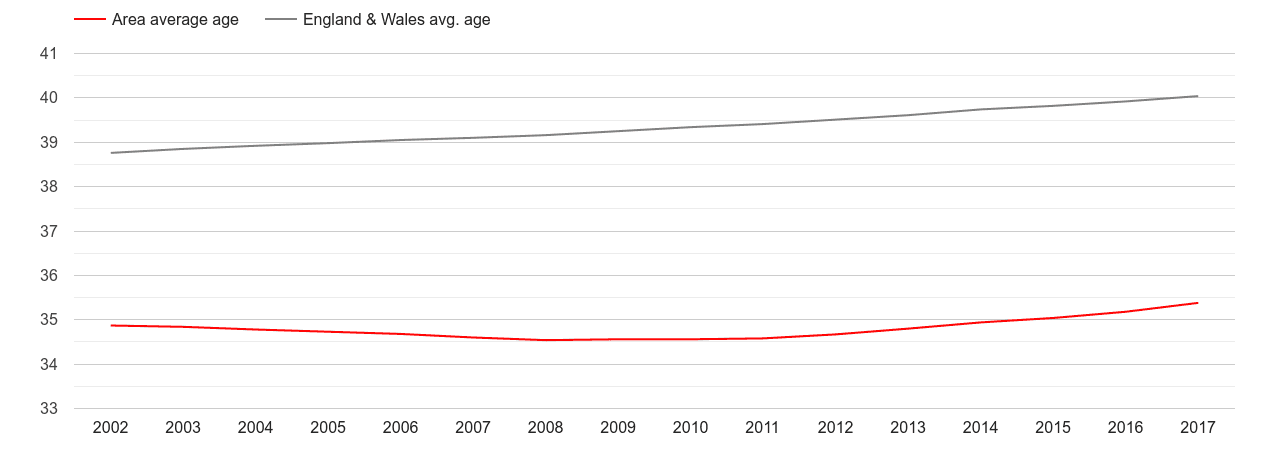
Inner London population average age
Annual statistics of population's average age.
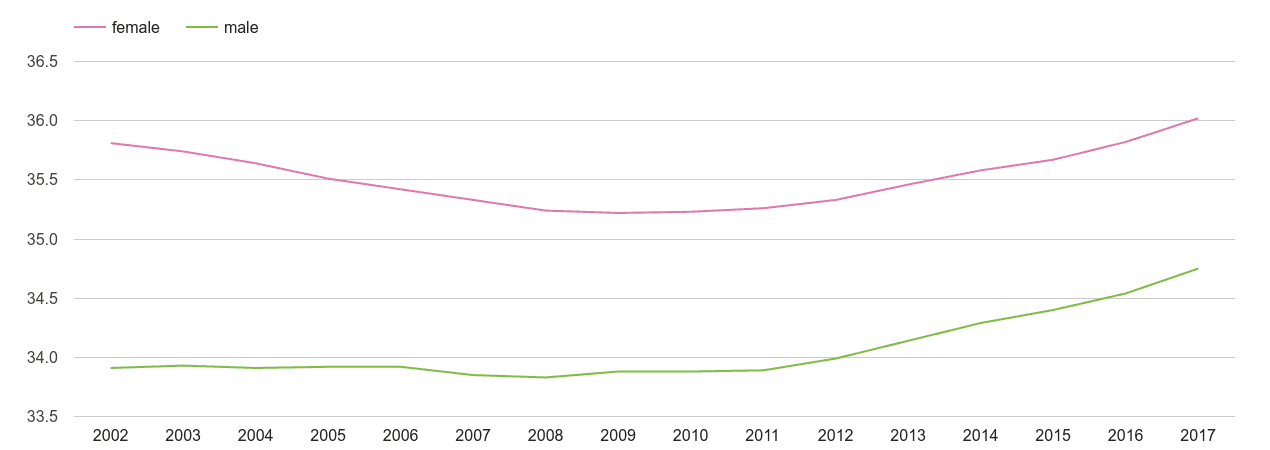
Inner London male and female average age
Annual statistics of population's average age by sex.
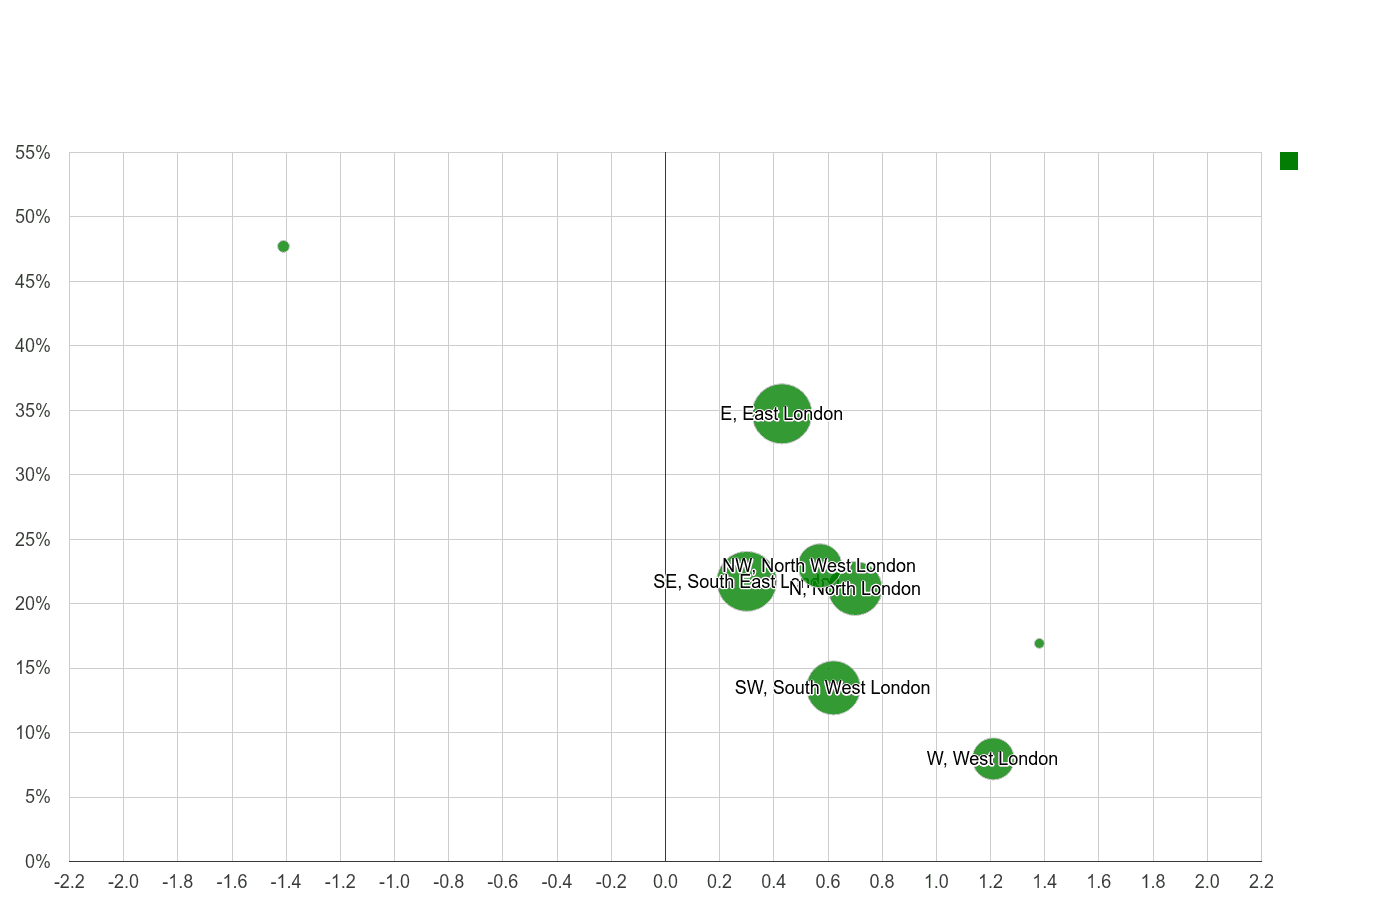
Inner London population changes compared to other areas
Comparison to other postcode areas. Metrics show a percentage change in the headcount between 2002 and 2017 on y-axis and change of the population's average age on x-axis. The size of the circle is directly proportional to the total population in 2017.
Headcount percentage changePopulation average age change
 Headcount percentage change