Inner London newly built property prices
Inner London
postcode area
February 2018 - January 2019
£786k
average price of a new property-2%
average price percentage change-£12.9k
average price changeEngland + Wales
February 2018 - January 2019
£345k
avg. price of a new property1%
average price percentage change£2.4k
average price changeInner London cost comparison of new homes and older homes
February 2018 - January 2019
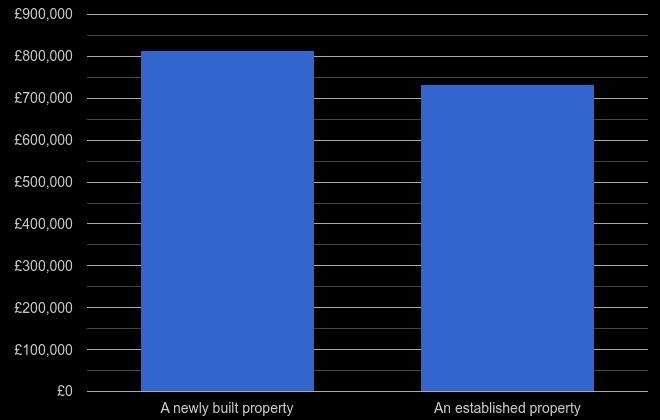
£786k
A newly built property£721k
An established propertyInner London sales share of new homes and older homes
February 2018 - January 2019
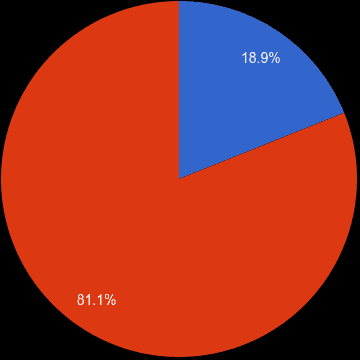
█ 19.4%
A newly built property10.5k
█ 80.6%
An established property43.5k
54k
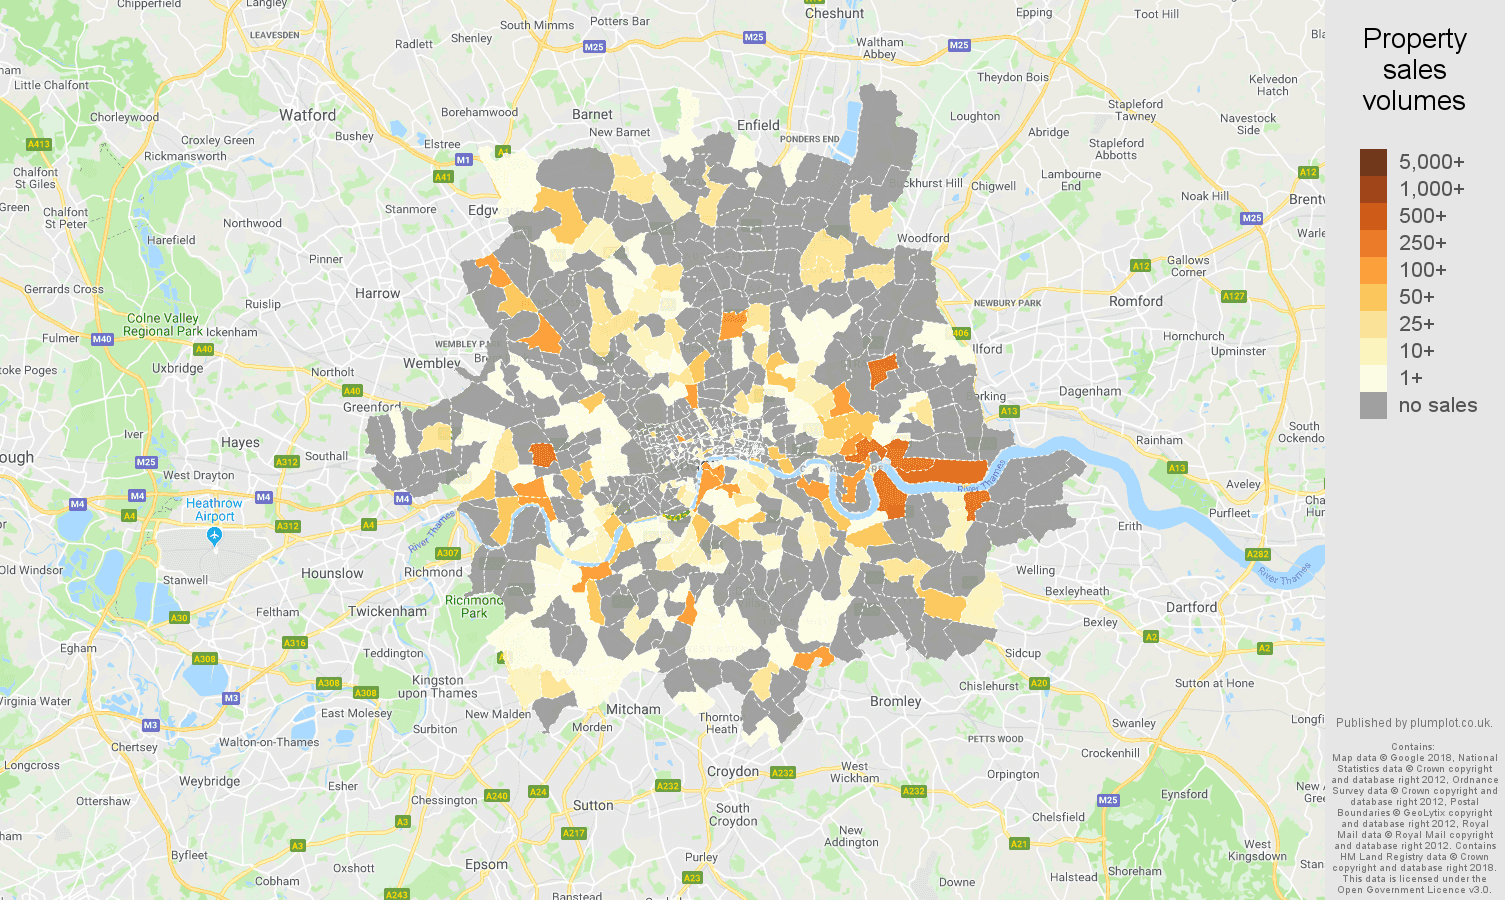
total sales volumeInner London map of sales of new properties
shows the total volume of new homes sold a given postcode sector. The biggest number of newly built properties were sold in E16 2, with 533 sold to date from February 2018 - January 2019.
Inner London new home sales share by price range
shows a sales volume of new homes in a given price range between February 2018 - January 2019. See also Inner London property sales reports.
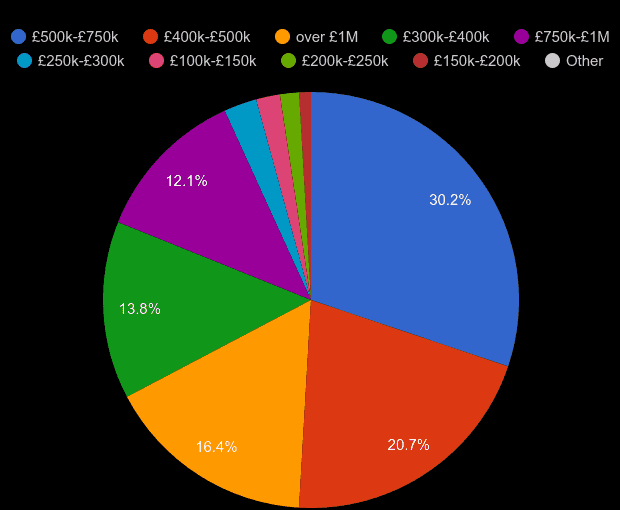
| Property price range | Market share | Sales volume |
|---|
| £50k-£100k | 0% | 2 |
| £100k-£150k | 2% | 205 |
| £150k-£200k | 1% | 109 |
| £200k-£250k | 1.2% | 122 |
| £250k-£300k | 2.4% | 256 |
| £300k-£400k | 14% | 1.5k |
| £400k-£500k | 21.3% | 2.2k |
| £500k-£750k | 29.8% | 3.1k |
| £750k-£1M | 12.1% | 1.3k |
| over £1M | 16.1% | 1.7k |
Inner London cost comparison of new houses and new flats
February 2018 - January 2019
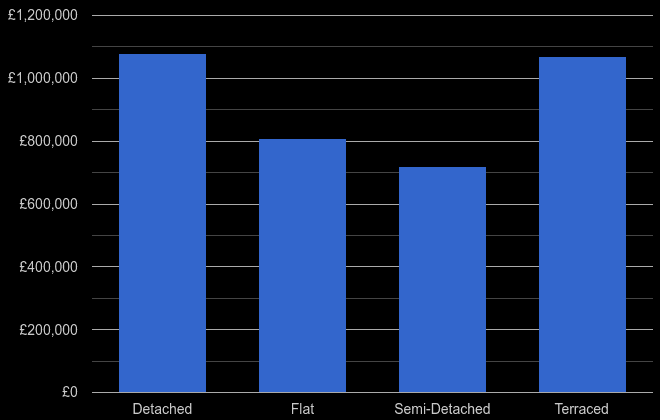
£1.1M
Detached£779k
Flat£872k
Semi-Detached£1M
TerracedInner London sales share of new houses and new flats
February 2018 - January 2019
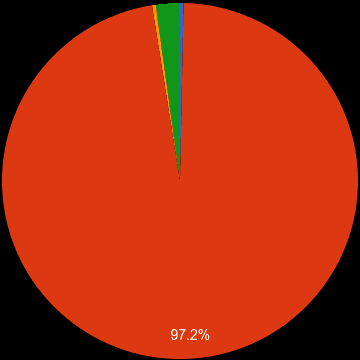
█ 0.3%
Detached33
█ 97.2%
Flat10.2k
█ 0.2%
Semi-Detached26
█ 2.2%
Terraced236
Inner London real new home prices
Yearly average nominal house prices adjusted for inflation
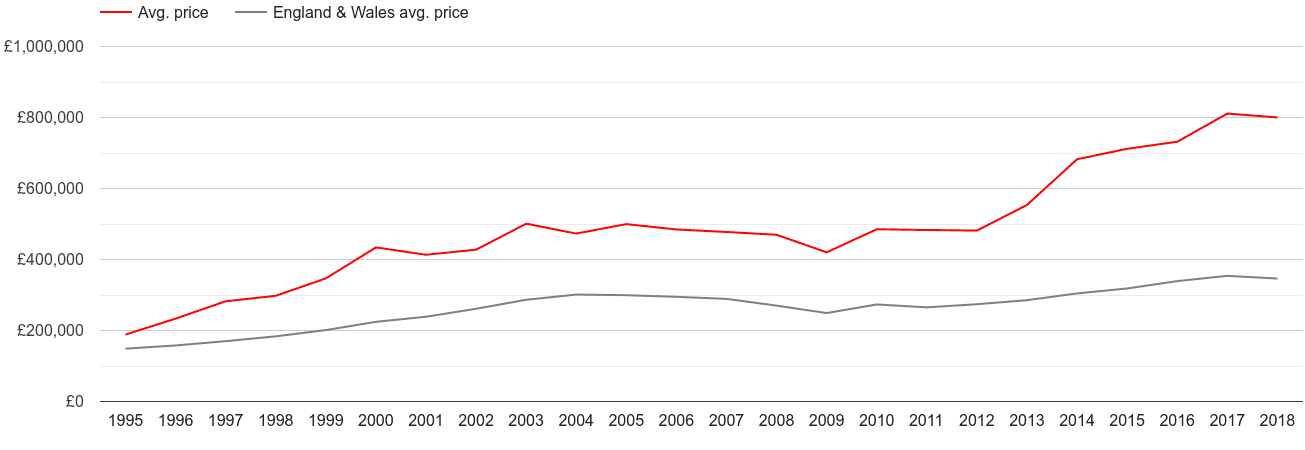
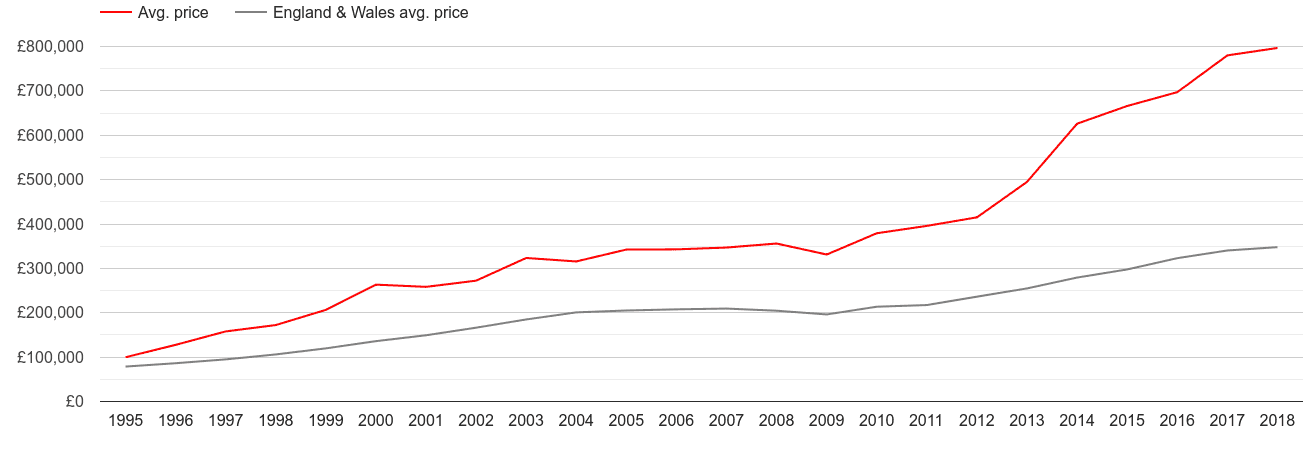
Inner London new home prices compared to England & Wales' new home prices
Yearly average nominal prices
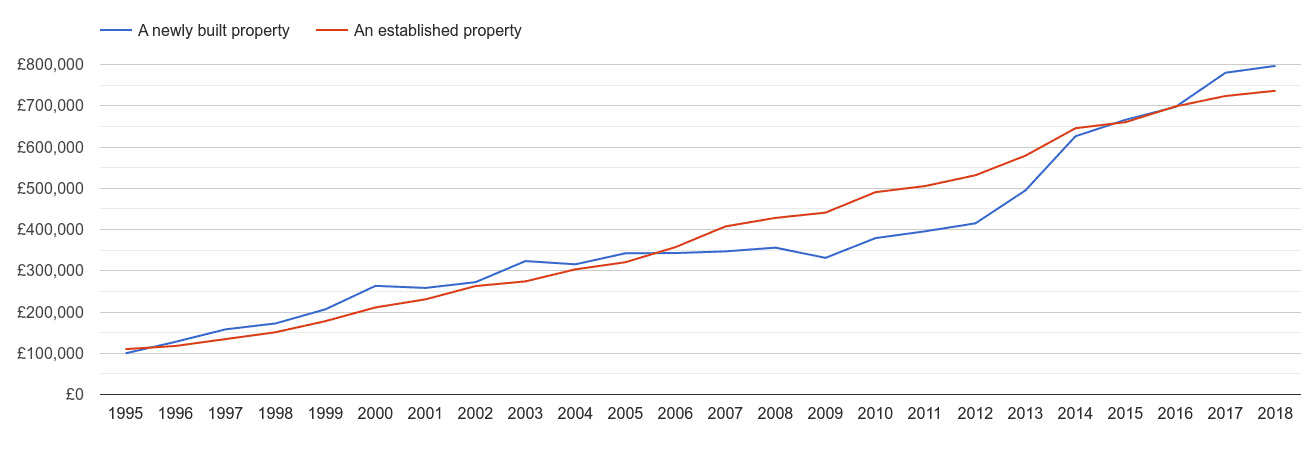
Inner London house prices new vs established
Yearly average nominal prices
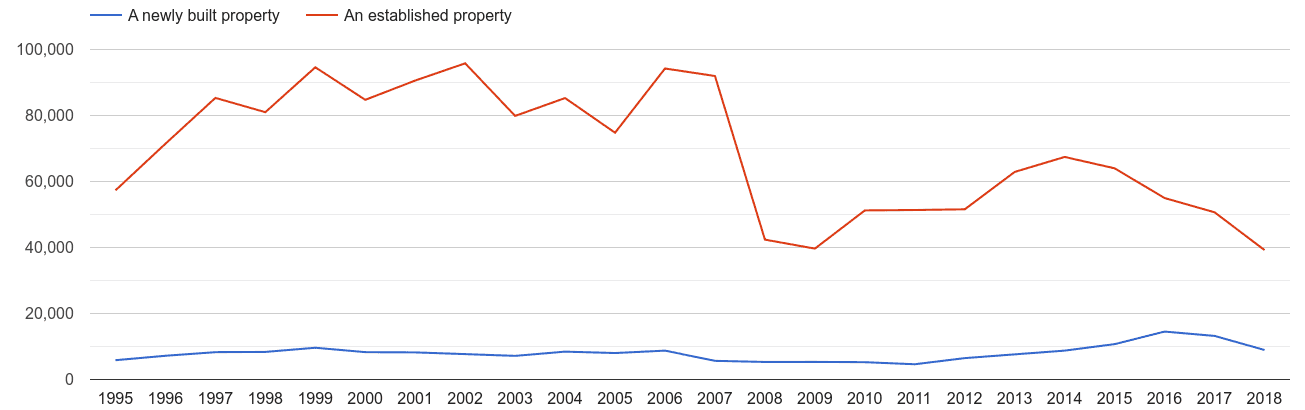
Inner London annual sales of new homes and older homes
Total sales volumes by year
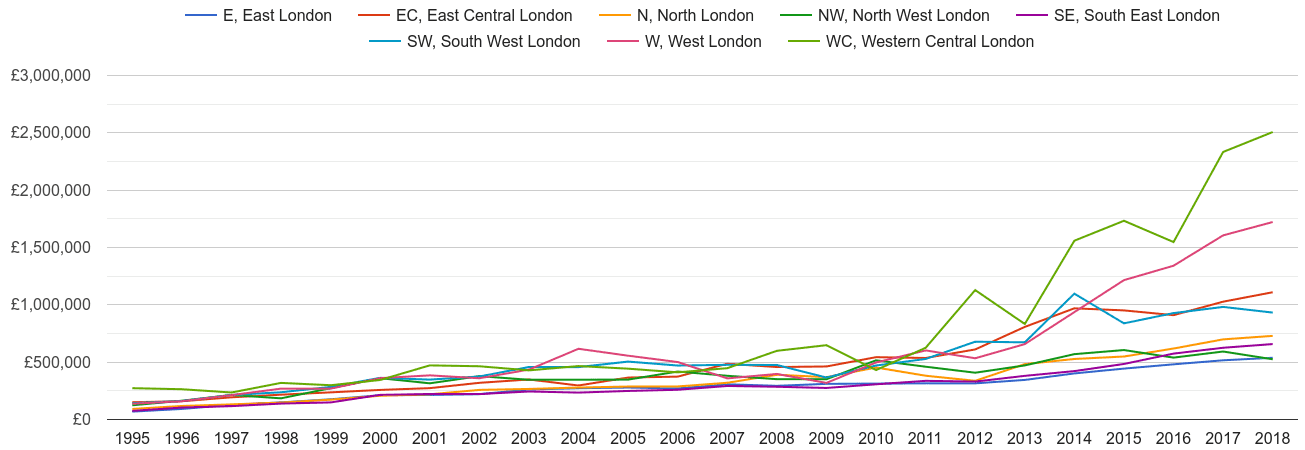
Inner London new home prices and nearby areas
Yearly average nominal prices
Associated reports:


