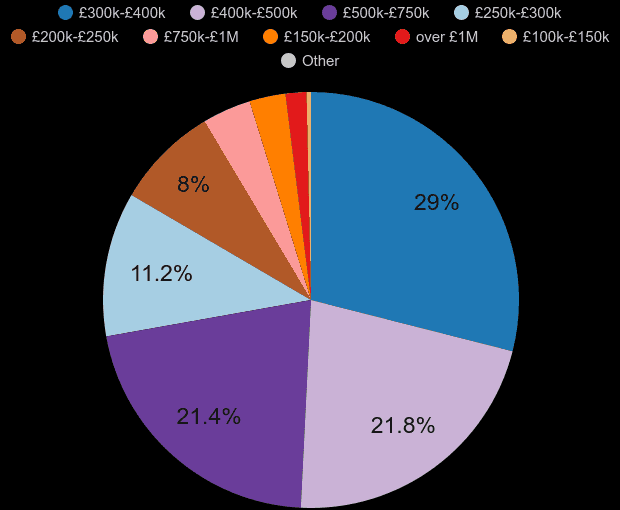
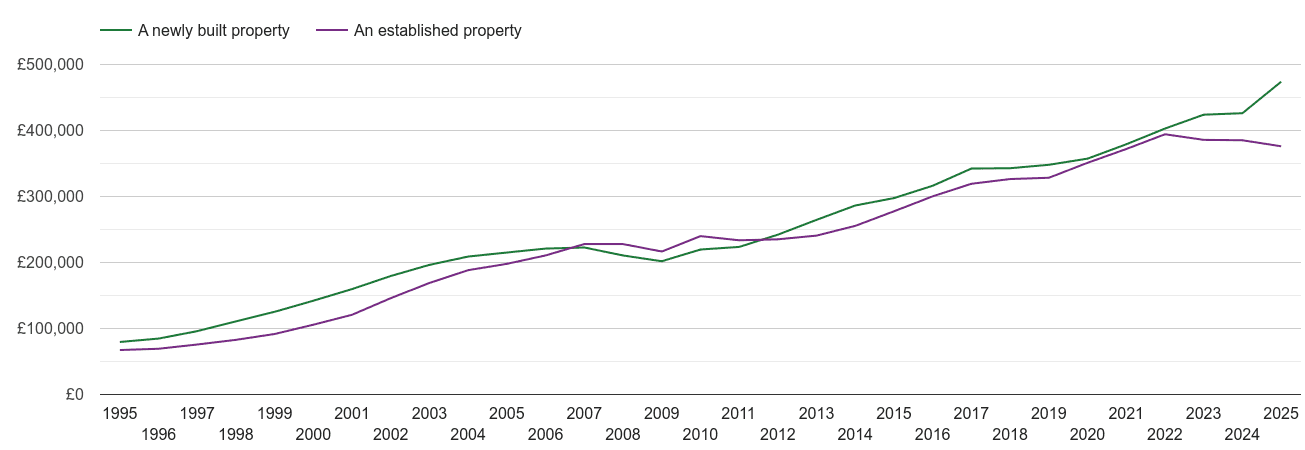
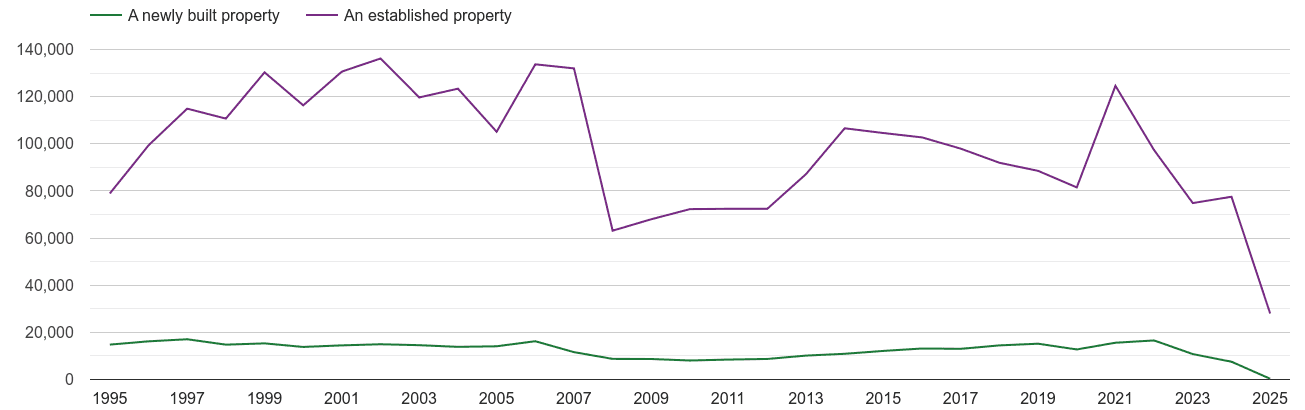
The price of a newly built property is £432k in East of England region. The price declined by -£9.0k (-2%) over the last twelve months. The price of an established property is £390k. There were 1571 sales of newly build properties. Most new properties were sold in the £300k-£400k price range with 452 (28.8%) properties sold, followed by £500k-£750k price range with 359 (22.9%) properties sold. Most new homes were sold in Essex, with 457 sold to date from July 2025 - June 2026.
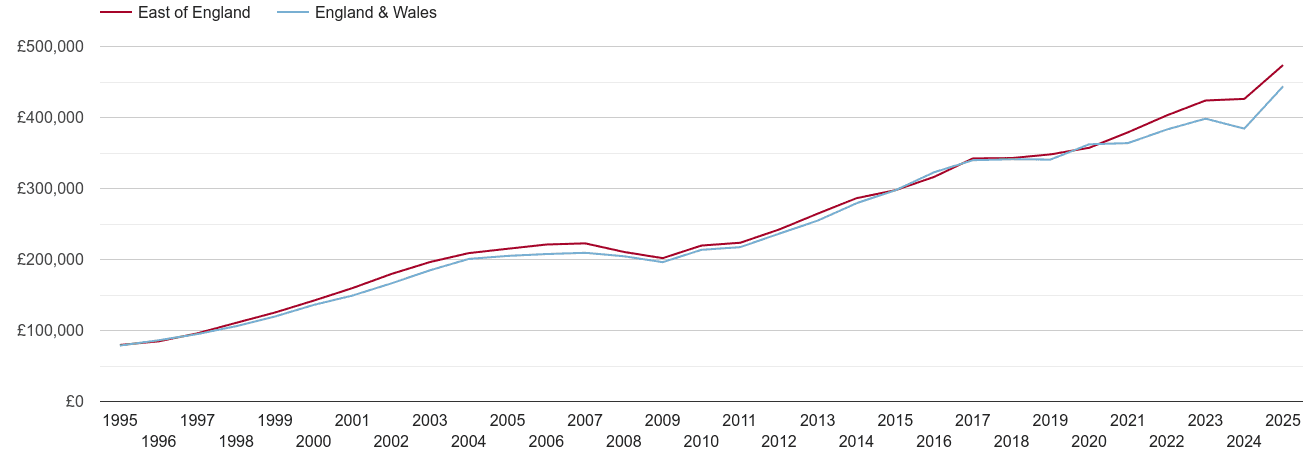
| July 2025 - June 2026 | East of England region | England & Wales |
|---|---|---|
| Average price of a new home | £432k | £401k |
| Average price % change | -2% | 2% |
| Average price change in GBP | -£9.0k | £8.6k |
July 2025 - June 2026
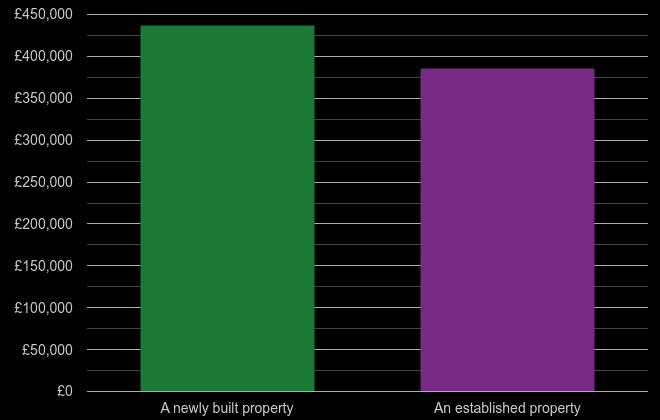
| New or established | Average price |
|---|---|
| █ A newly built property | £432k |
| █ An established property | £390k |
July 2025 - June 2026
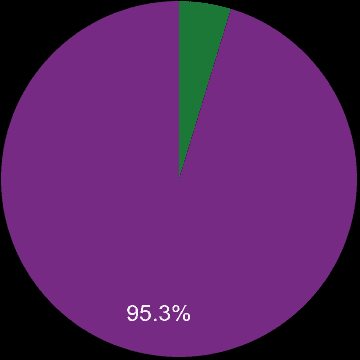
| New or established | Percentage share | Sales volume |
|---|---|---|
| █ A newly built property | 2.1% | 1.6k |
| █ An established property | 97.9% | 73.9k |
| All properties | 100% | 75.5k |
shows the total volume of new homes sold a given county.
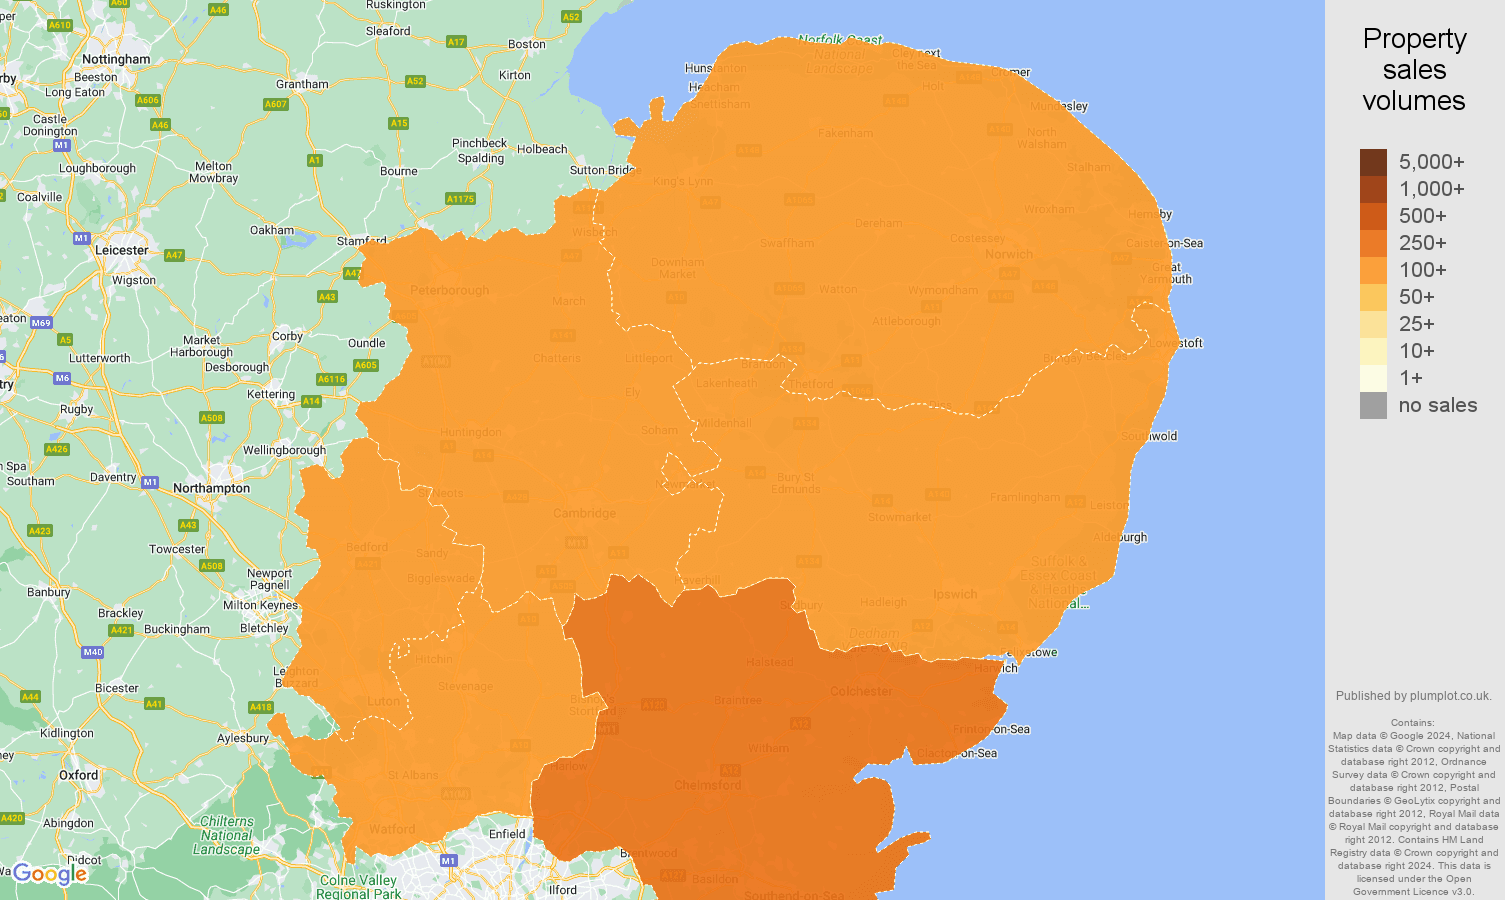
| County | Sales volume | Market share | |
|---|---|---|---|
| Bedfordshire | 263 | 16.7% | |
| Cambridgeshire | 238 | 15.1% | |
| Essex | 457 | 29.1% | |
| Hertfordshire | 139 | 8.8% | |
| Norfolk | 272 | 17.3% | |
| Suffolk | 202 | 12.9% | |
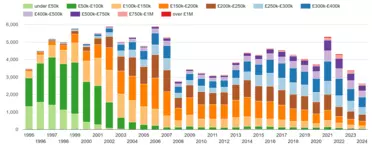
shows a sales volume of new homes in a given price range between July 2025 - June 2026. See also East of England property sales reports.
| Property price range | Market share | Sales volume |
|---|---|---|
| █ £50k-£100k | 0.6% | 10 |
| █ £100k-£150k | 0.8% | 12 |
| █ £150k-£200k | 2.2% | 35 |
| █ £200k-£250k | 9.2% | 145 |
| █ £250k-£300k | 10.8% | 169 |
| █ £300k-£400k | 28.8% | 452 |
| █ £400k-£500k | 19.0% | 299 |
| █ £500k-£750k | 22.9% | 359 |
| █ £750k-£1M | 4.7% | 74 |
| █ over £1M | 1.0% | 16 |
July 2025 - June 2026
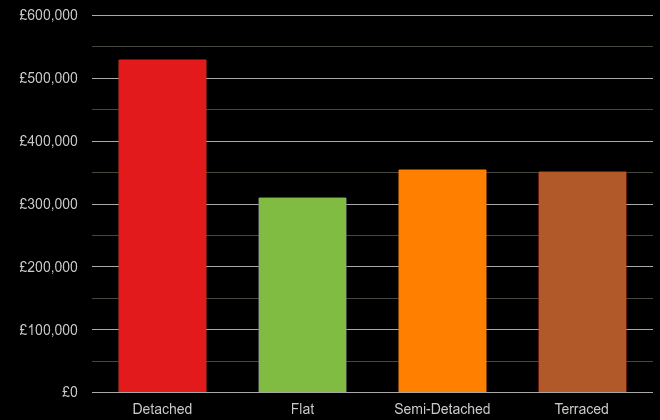
| House Type | Average price |
|---|---|
| █ Detached | £531k |
| █ Flat | £313k |
| █ Semi-Detached | £344k |
| █ Terraced | £347k |
July 2025 - June 2026
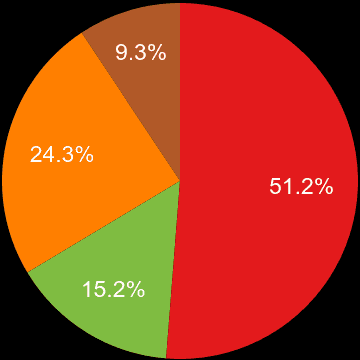
| House Type | Percentage share | Sales volume |
|---|---|---|
| █ Detached | 49.5% | 778 |
| █ Flat | 16.4% | 257 |
| █ Semi-Detached | 25.0% | 392 |
| █ Terraced | 9.2% | 144 |
Yearly average nominal house prices adjusted for inflation
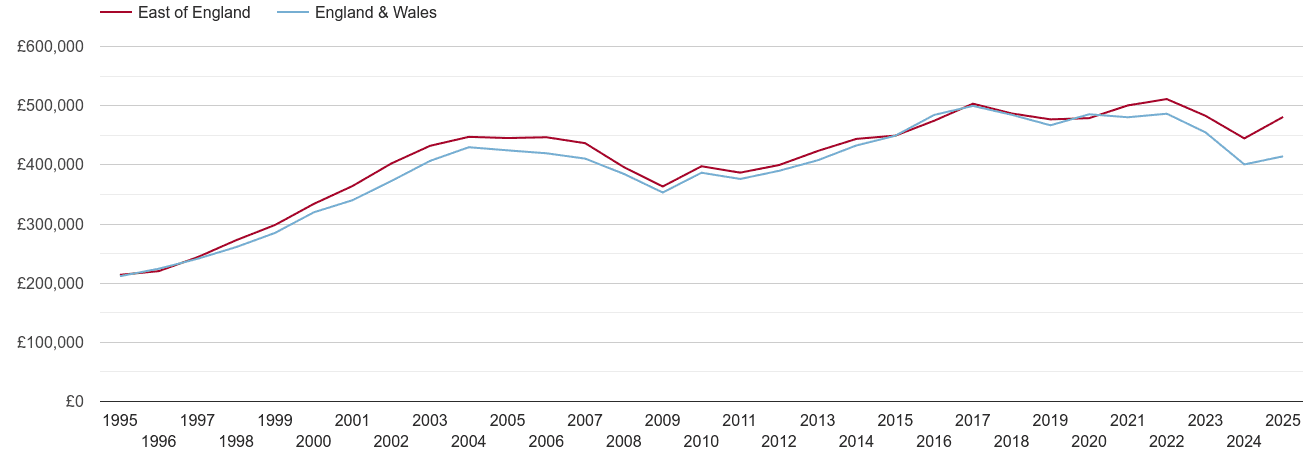
Yearly average nominal prices
Yearly average nominal prices
Yearly average nominal prices
Total sales volumes by year


 login →