East of England population statistics
In 2024, there were 6.6M residents in East of England region with an average age of 41.4 years. Population density was 344 residents per square kilometer. Population grew by 21.1% since 2002 and population average age increased by 2.2 years in the same period.Key Population Data: Residents, Age and Density in 2024 (latest estimate from ONS)| Population Estimates | Value in 2024 |
|---|
| Total residents | 6.6M |
| Average age | 41.4 |
| Population density | 344 |
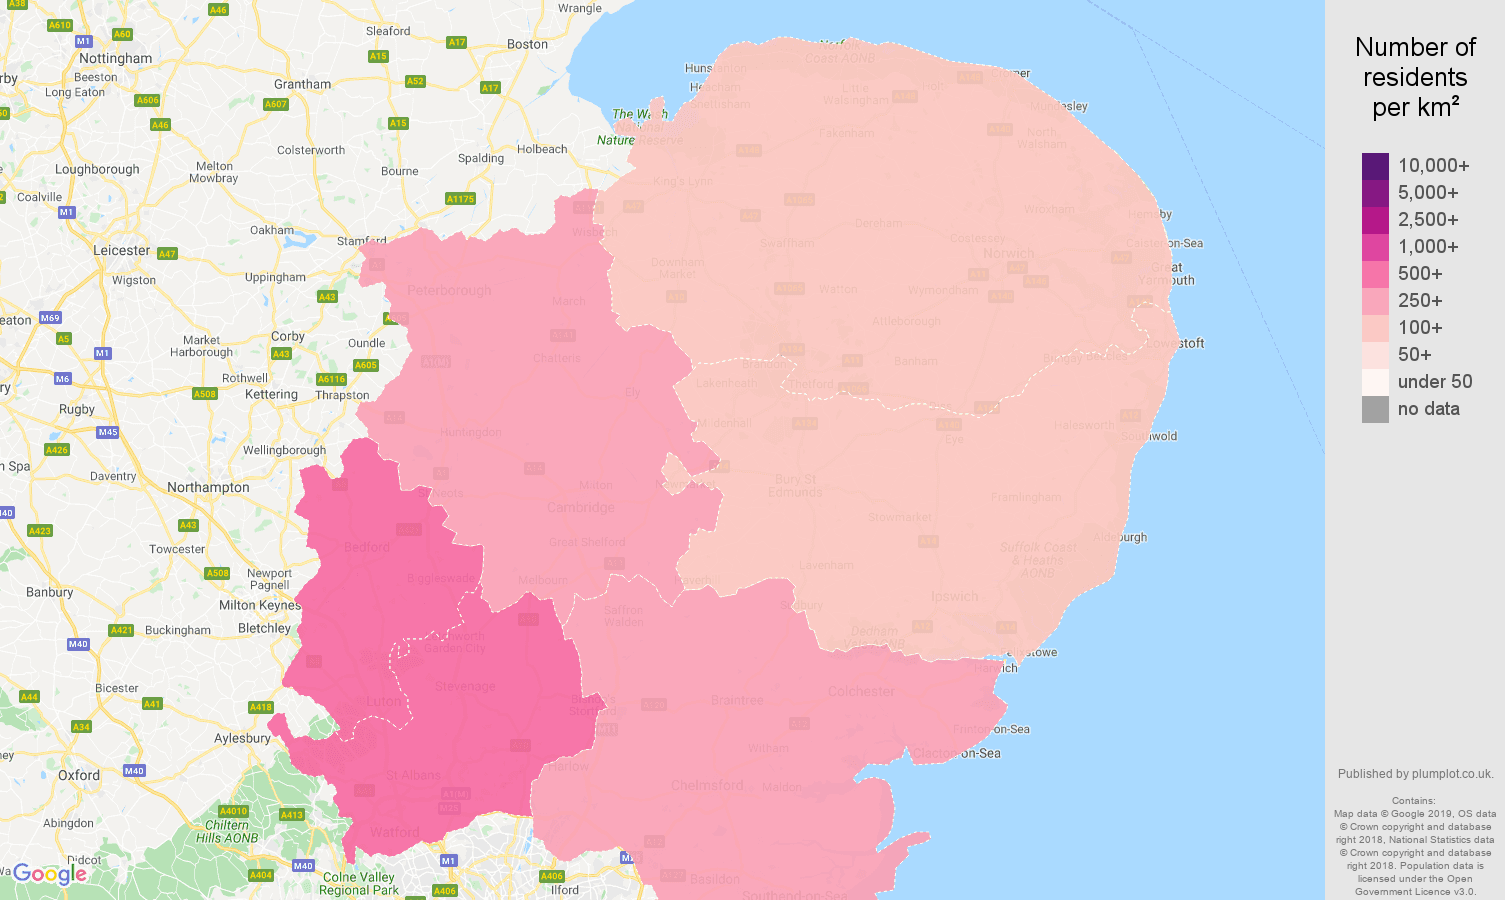
East of England population density map
shows a number of residents per square kilometer(km2), estimates from 2020.
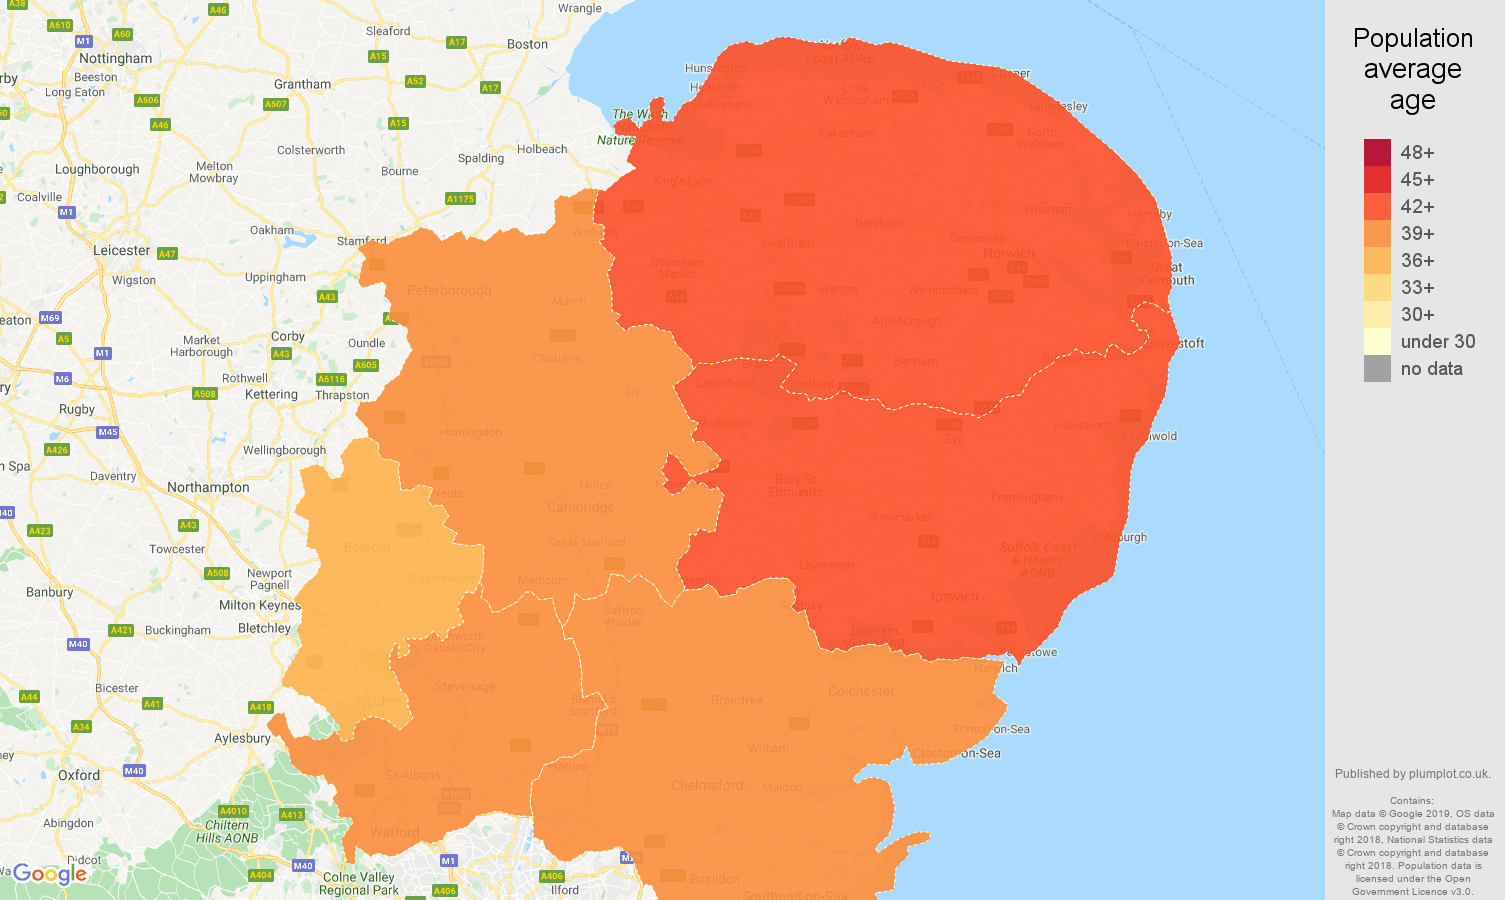
East of England population average age map
Population average age by LSOA (County) in 2018.
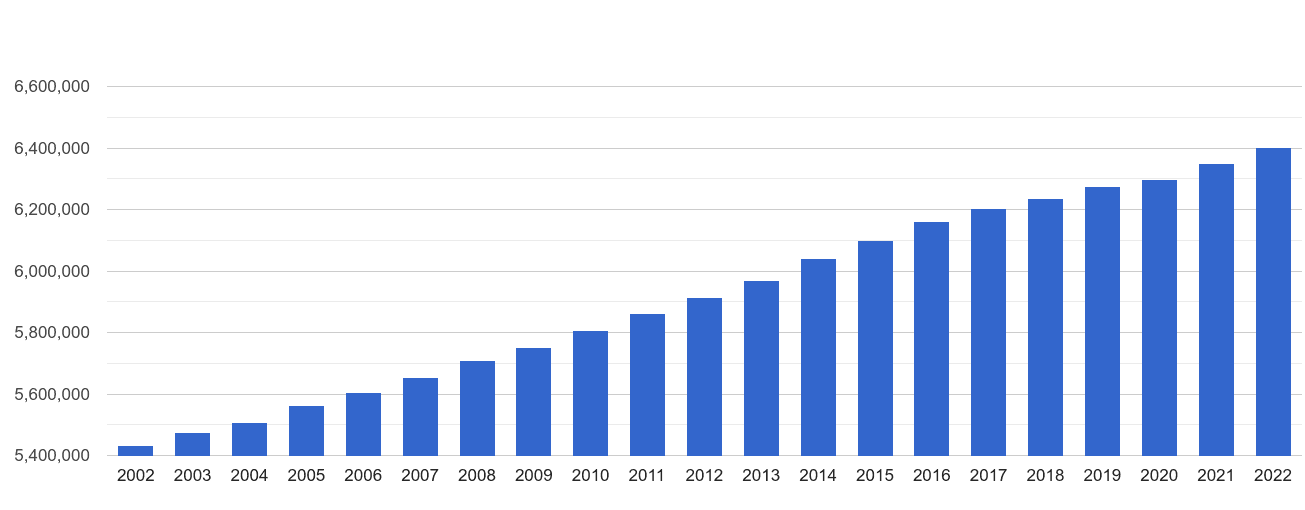
East of England population growth
Total population per year outlines headcount differences.
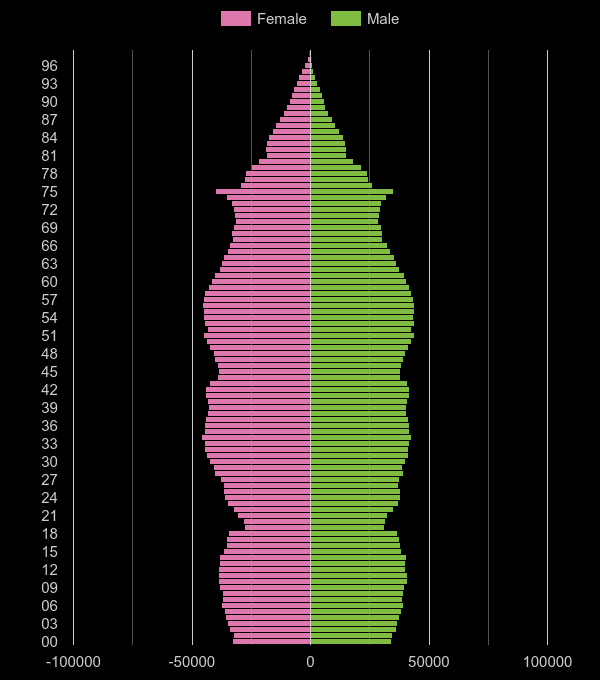
East of England population pyramid
shows the distribution of various age groups in a population in 2024. Females are shown on the left, males are shown on the right.
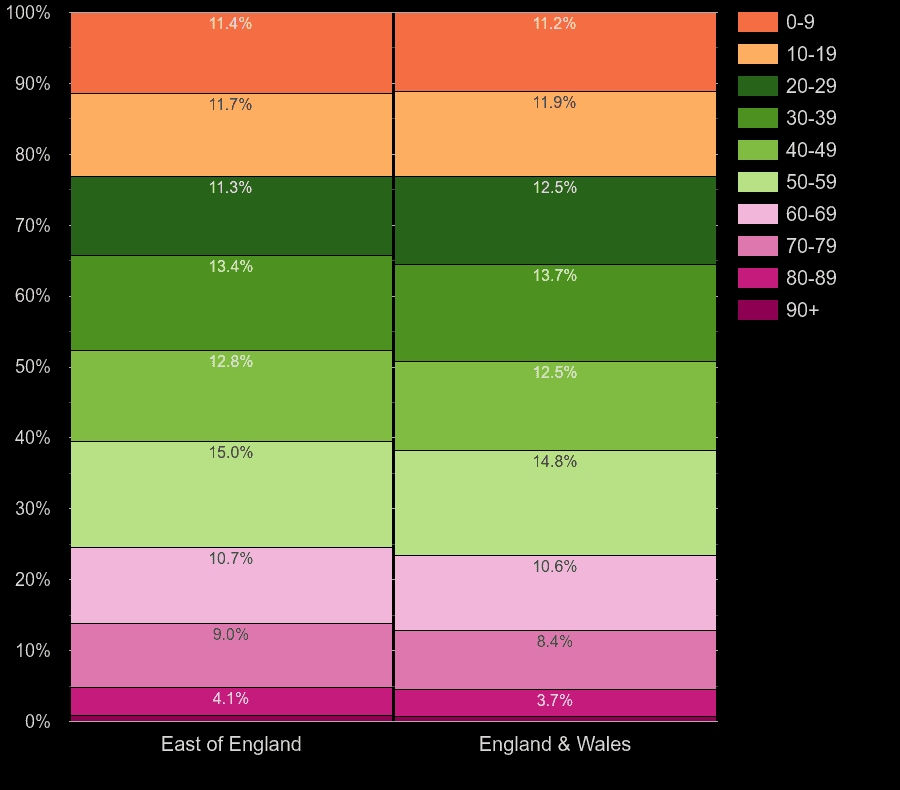
East of England population share by decade of age
Shares of population age groups compared to corresponding shares of population groups in England & Wales, 2024.
East of England working age population share
Working age population share compared to working age population share in England & Wales, 2024.
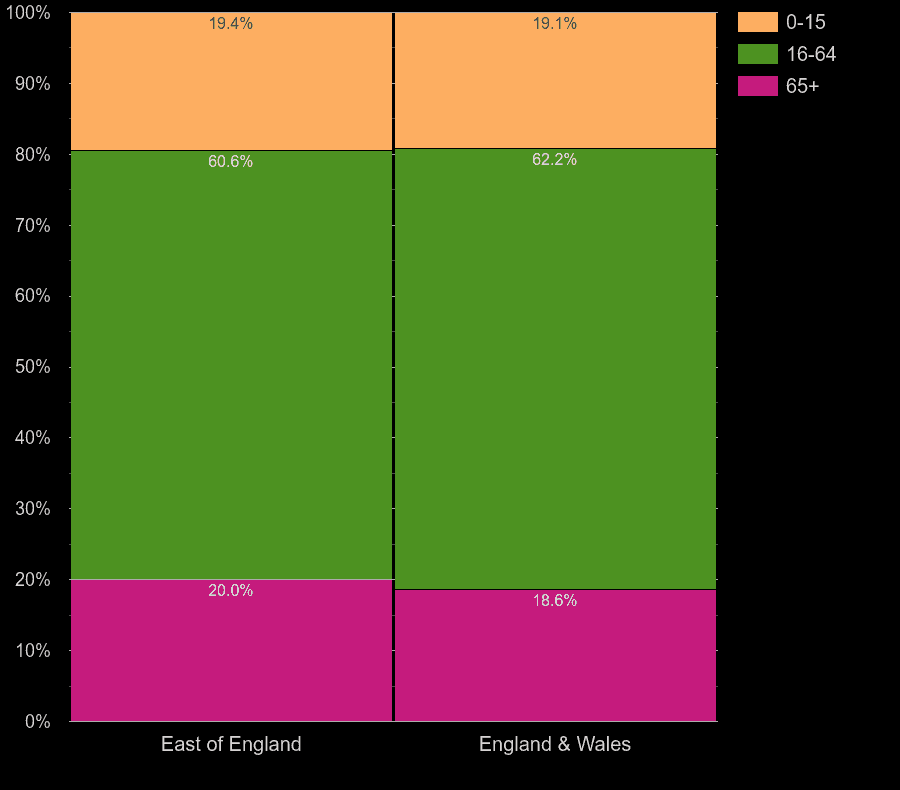
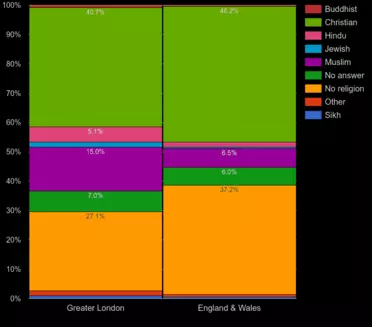
Age Distribution and Comparison to England & Wales| age group | head-count | % share of population | % for Eng & Wales |
|---|
| 0-15 | 1.2M | 18.8% | 18.3% |
| 16-64 | 4.0M | 61.3% | 62.8% |
| 65+ | 1.3M | 20.0% | 18.9% |
East of England average age rank
Comparison of regions average ages, 2024 population estimates.
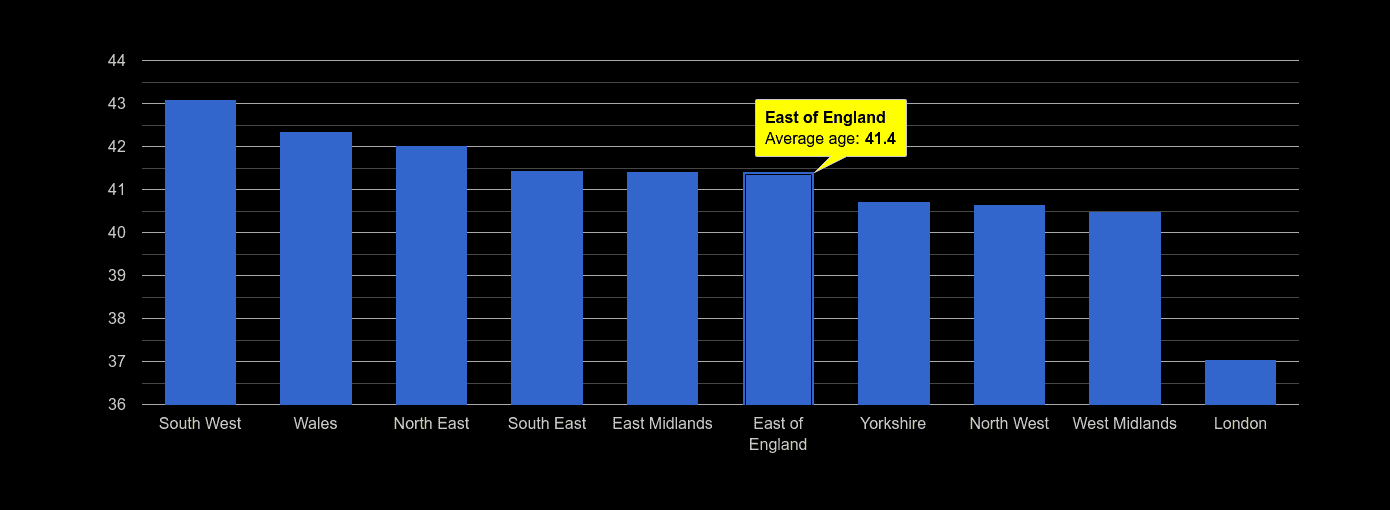
Average Age in East of England region and Comparison to England & Wales| region | Average age in 2024 |
|---|
| East of England | 41.4 |
| England & Wales | 40.8 |
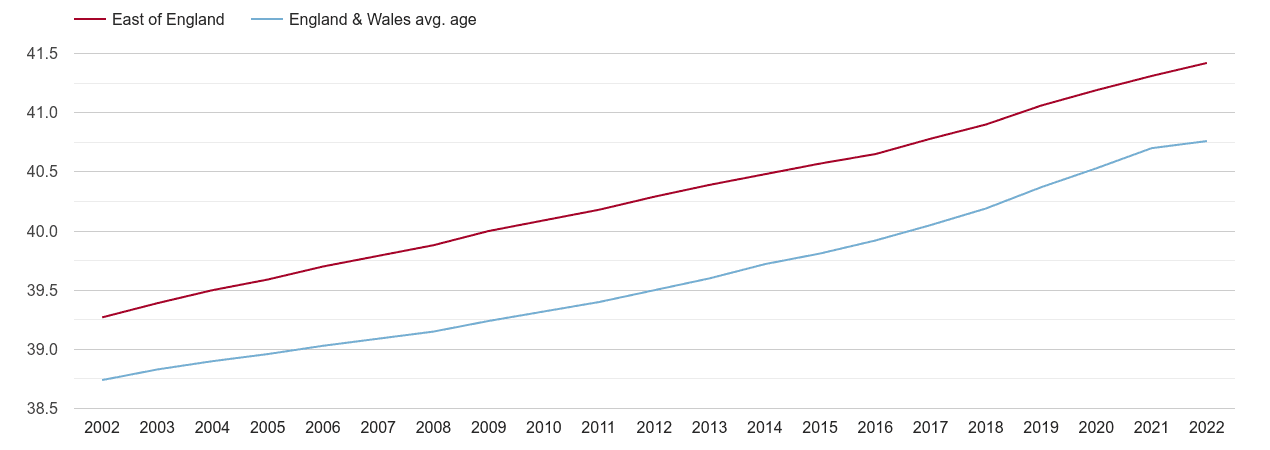
East of England population average age
Annual area statistics of East of England's population average age compared to country statistics.
Plumplot area insights - interactive charts and maps
Next for East of England region


 login →