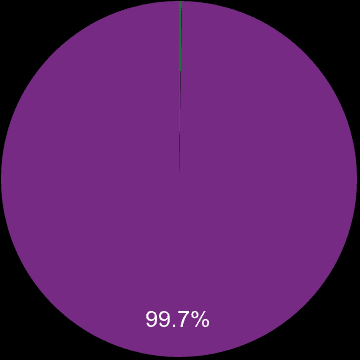
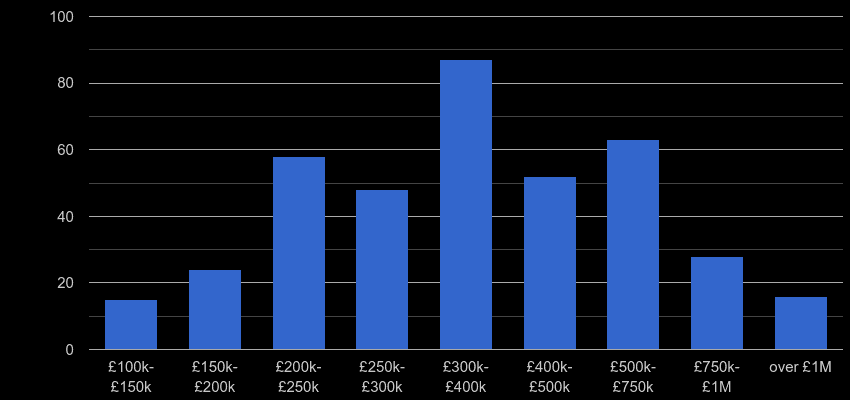
There were 508 property sales in Rutland county in the previous twelve months and sales dropped by 13.5% (-86 transactions). 9 properties, 1.8% were sales of a newly built property. Most properties were sold in the £300k-£400k price range with 114 (22.4%) properties sold, followed by £250k-£300k price range with 81 (15.9%) properties sold.

| New or established | Percentage share | Sales volume |
|---|---|---|
| █ A newly built property | 1.8% | 9 |
| █ An established property | 98.2% | 499 |
| All properties | 100% | 508 |

| House Type | Percentage share | Sales volume |
|---|---|---|
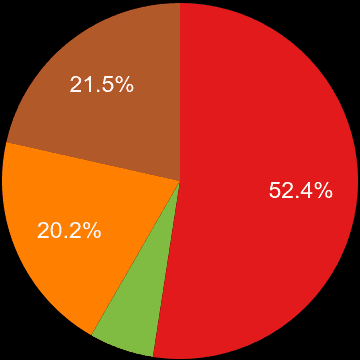
| █ Detached | 45.9% | 233 |
| █ Flat | 5.5% | 28 |
| █ Semi-Detached | 27.8% | 141 |
| █ Terraced | 20.9% | 106 |

| Property price range | Market share | Sales volume |
|---|---|---|
| £50k-£100k | 0.4% | 2 |
| £100k-£150k | 4.3% | 22 |
| £150k-£200k | 7.5% | 38 |
| £200k-£250k | 14.8% | 75 |
| £250k-£300k | 15.9% | 81 |
| £300k-£400k | 22.4% | 114 |
| £400k-£500k | 13.4% | 68 |
| £500k-£750k | 13.4% | 68 |
| £750k-£1M | 5.5% | 28 |
| over £1M | 2.4% | 12 |
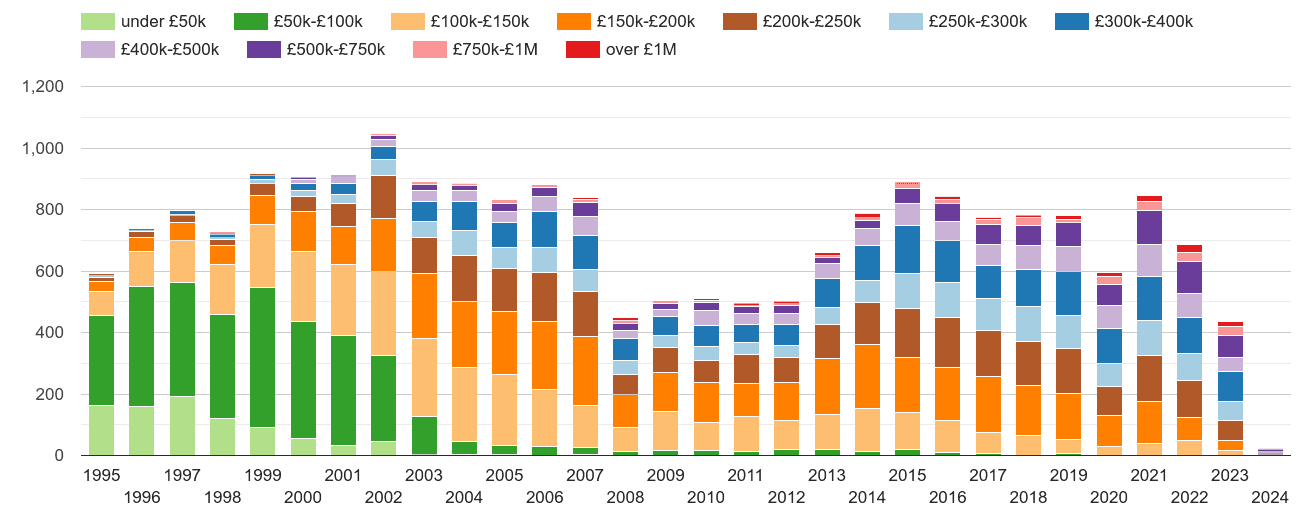
Yearly property sales volume by nominal price ranges

Total sales volume by year

Market share by year

Total sales volumes by year

Market share by year

shows the total volume of new properties sold a given postcode sector.