Telford property transactions

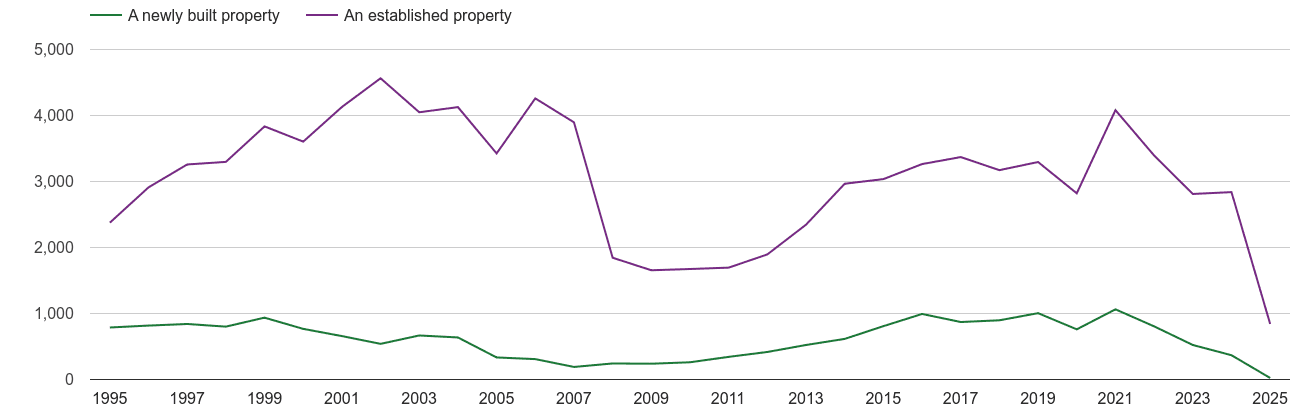
There were 2.8k property sales in Telford postcode area in the previous twelve months and sales dropped by 21.5% (-837 transactions). 95 properties, 3.4% were sales of a newly built property. Most properties were sold in the £150k-£200k price range with 607 (21.6%) properties sold, followed by £200k-£250k price range with 533 (19.0%) properties sold.
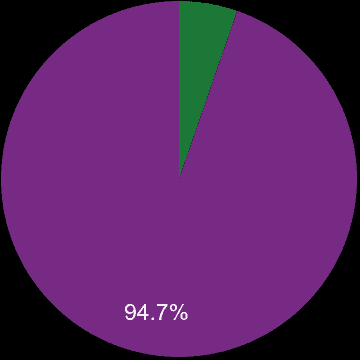
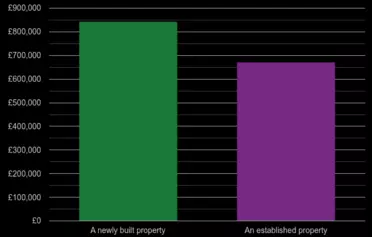
Telford sales share of new homes and older homes

September 2025 - August 2026

Telford sales share of new homes and older homes
Sales Share and Sales Volume of Newly Built Properties
New or establishedPercentage shareSales volume
█ A newly built property3.4%95
█ An established property96.6%2.7k
All properties100%2.8k

Telford sales share of houses and flats

September 2025 - August 2026

Telford sales share of houses and flats
Sales Share of Residential Properties by House Type
House TypePercentage shareSales volume
█ Detached35.2%988
█ Flat6.2%173
█ Semi-Detached36.2%1.0k
█ Terraced22.4%628

Telford property sales by price range

shows a number of properties sold in a given price range between September 2025 - August 2026.

Telford property sales by price range
Market Analysis of Sales Volume and Share by Property Price Range
Property price rangeMarket shareSales volume
under £50k0.2%6
£50k-£100k5.3%148
£100k-£150k13.5%379
£150k-£200k21.6%607
£200k-£250k19.0%533
£250k-£300k14.1%396
£300k-£400k14.7%412
£400k-£500k6.9%195
£500k-£750k4.0%112
£750k-£1M0.5%14
over £1M0.1%4

Telford property sales volumes

Yearly property sales volume by nominal price ranges

Telford property sales volumes

Telford annual sales of new homes and older homes

Total sales volume by year

Telford annual sales of new homes and older homes

Telford annual sales share of new homes and older homes

Market share by year

Telford annual sales share of new homes and older homes

Telford annual sales of houses and flats

Total sales volumes by year

Telford annual sales of houses and flats

Telford annual sales share of houses and flats

Market share by year

Telford annual sales share of houses and flats

Telford map of sales of new properties

shows the total volume of new properties sold a given postcode sector.
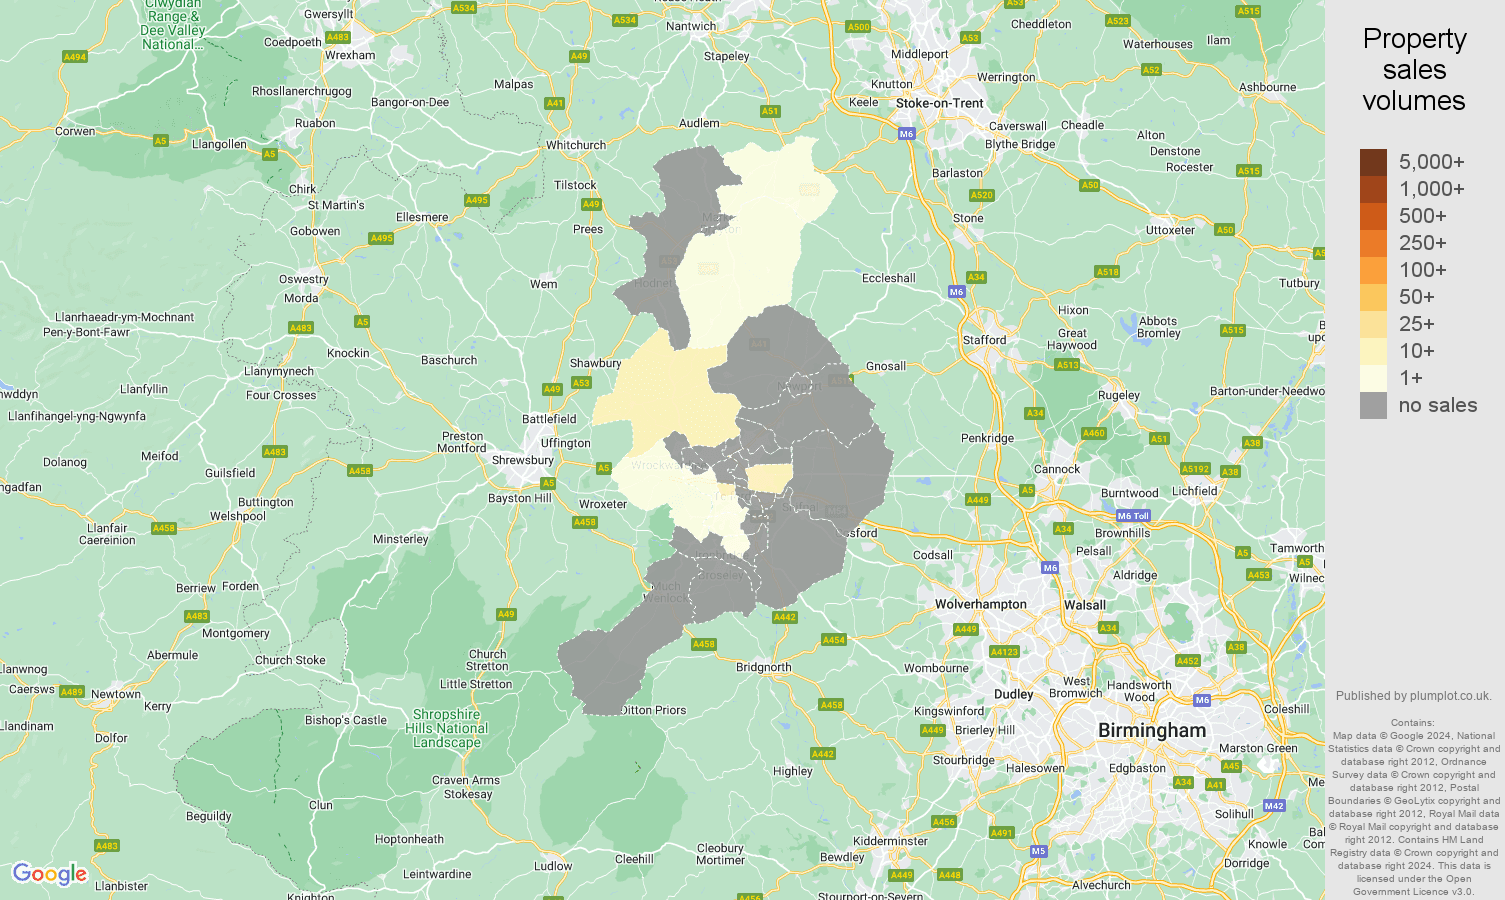
Telford map of sales of new properties

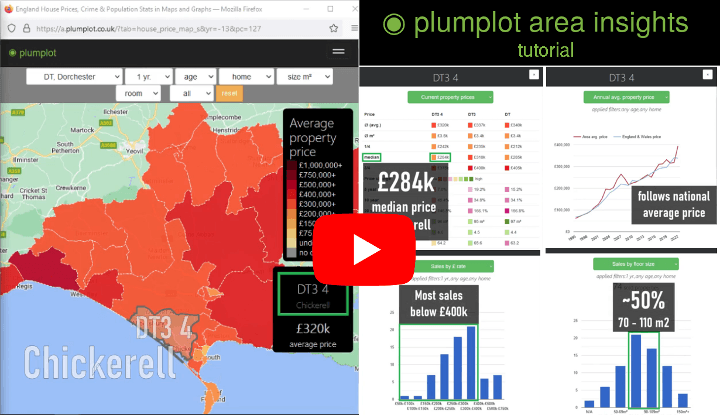
Plumplot area insights - interactive charts and maps

Plumplot area insights - interactive maps and charts

Next for Telford postcode area

→ House prices   House prices

→ House prices per square metre   House prices per square metre

→ New home prices   New home prices

→ Salary and unemployment   Salary and unemployment

→ Home energy efficiency   Home energy efficiency

→ Crime statistics   Crime statistics

→ Home features   Home features

→ Population statistics   Population statistics

→ Energy costs   Energy costs

plumplot area insights tutorial
Homeimage/svg+xmlhttps://openclipart.org/detail/170282/eco-green-house-icon-by-cybergedeondominiquechappard