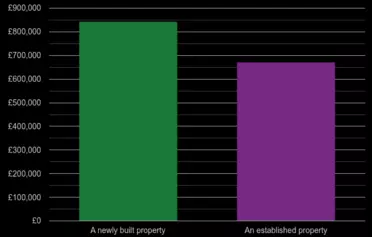
The average property price in Somerset county is £356k, the median price is £300k. The average price declined by -£8.0k (-2%) over the last twelve months. The price of an established property is £355k. The price of a newly built property is £396k. There were 13.1k property sales and sales dropped by 19.4% (-3.4k transactions). Most properties were sold in the £300k-£400k price range with 2859 (21.8%) properties sold, followed by £250k-£300k price range with 2255 (17.2%) properties sold.
| August 2025 - July 2026 | Somerset county | England & Wales |
|---|---|---|
| Average price | █ £356k | █ £350k |
| Median price | █ £300k | █ £280k |
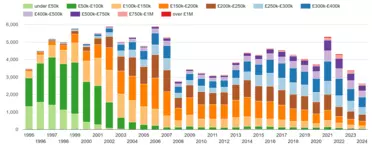
shows a number of properties sold in a given price range between August 2025 - July 2026.
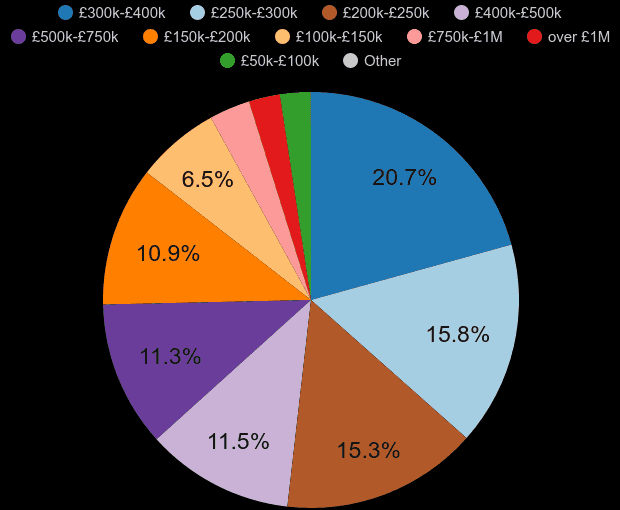
| Property price range | Market share | Sales volume |
|---|---|---|
| █ under £50k | 0.1% | 12 |
| █ £50k-£100k | 2.0% | 259 |
| █ £100k-£150k | 5.9% | 767 |
| █ £150k-£200k | 10.2% | 1.3k |
| █ £200k-£250k | 15.2% | 2.0k |
| █ £250k-£300k | 17.2% | 2.3k |
| █ £300k-£400k | 21.8% | 2.9k |
| █ £400k-£500k | 12.1% | 1.6k |
| █ £500k-£750k | 10.5% | 1.4k |
| █ £750k-£1M | 3.4% | 447 |
| █ over £1M | 1.5% | 196 |
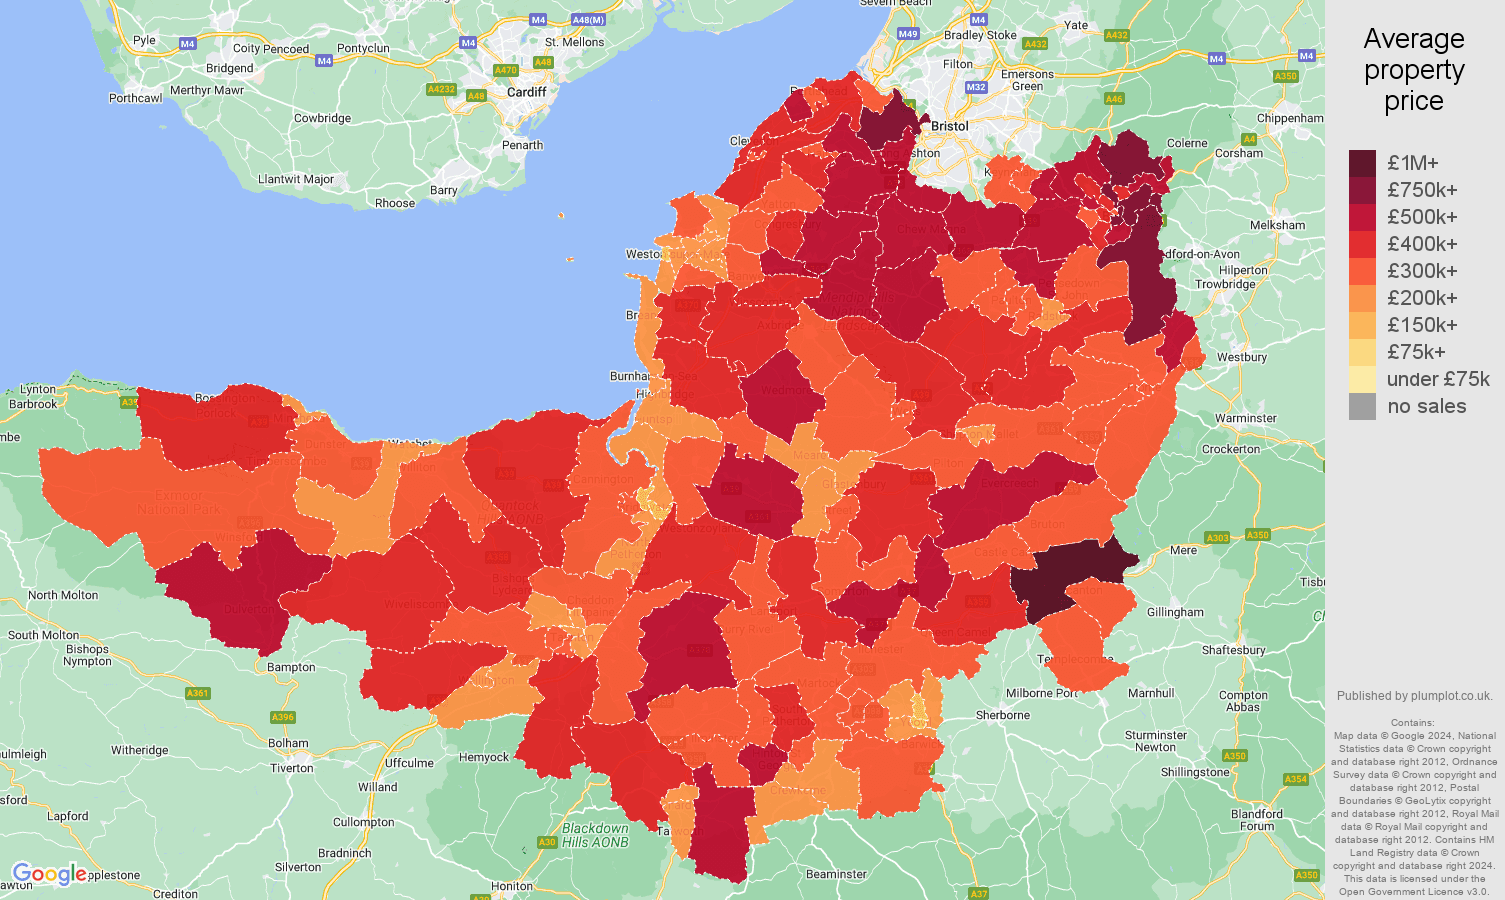
This price map shows the average property price in a given postcode sector. The most affordable place is 'BS22 0' with the average price of £115k. The most expensive place is 'BA1 9', £834k.
Comparison of the average property price and an average price percentage change by county. Price % change compares the average property price between August 2025 - July 2026 to the average price in the previous 12 months. The size of the circle shows the number of property transactions. The bigger the circle the higher the sales volumes in county.
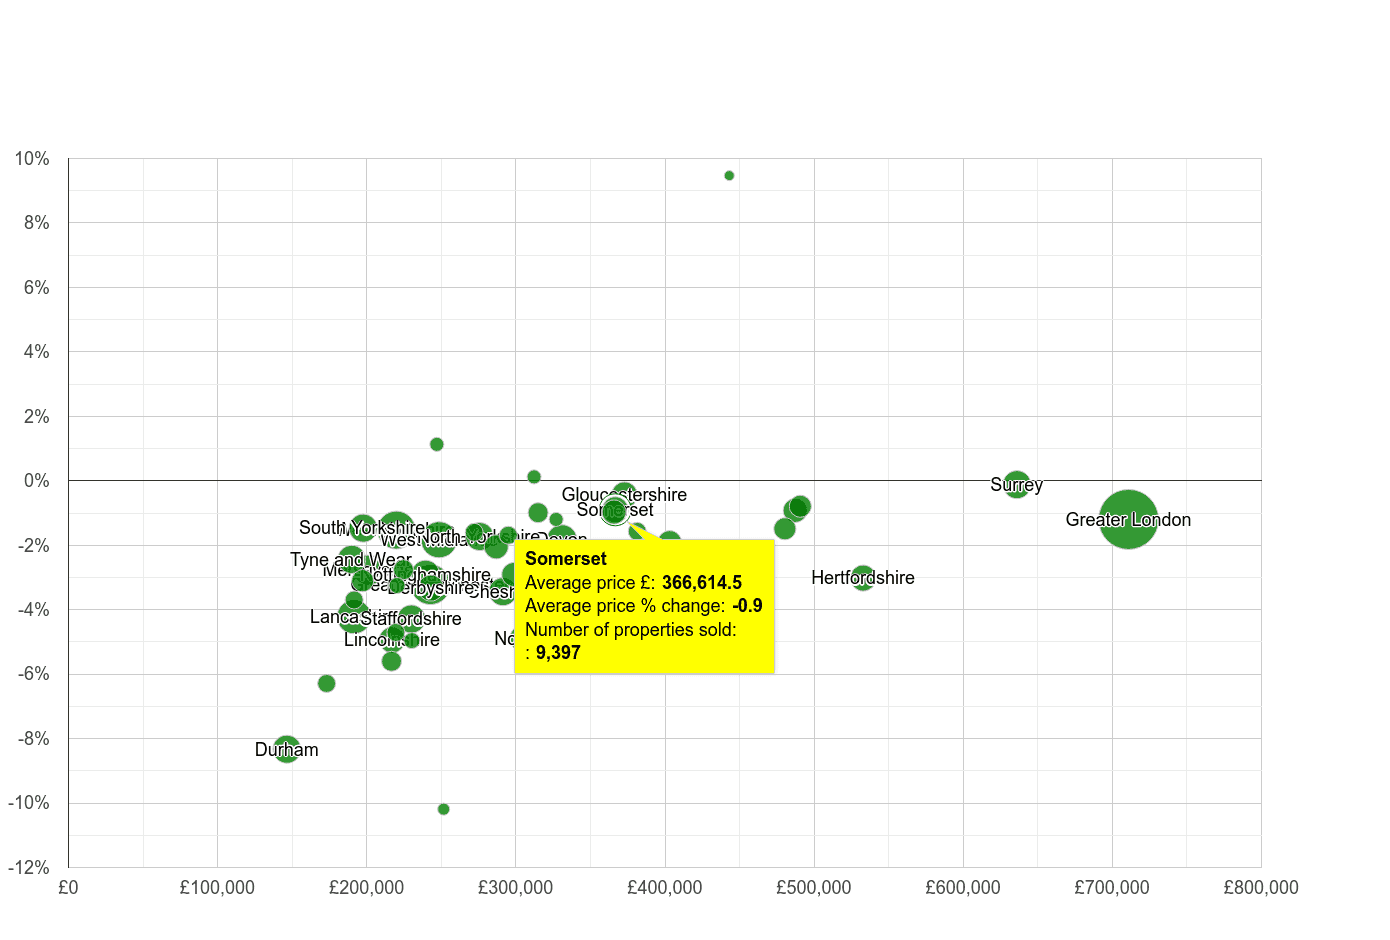 Average price percentage change
With the average price of £356k, Somerset is the 18. most pricey county out of 55 England and Wales' counties.
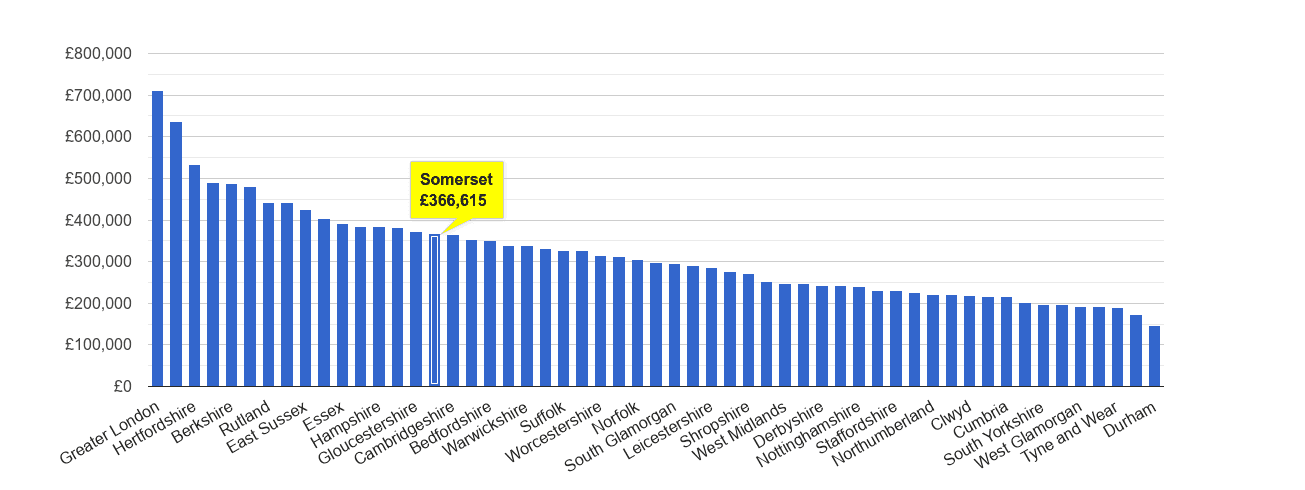
| Rank | county | Average price |
|---|---|---|
| 1. | Greater London | £653k |
| 2. | Surrey | £602k |
| 3. | Hertfordshire | £538k |
| 4. | Berkshire | £484k |
| 5. | Buckinghamshire | £482k |
| 6. | Oxfordshire | £479k |
| 7. | West Sussex | £432k |
| 8. | East Sussex | £412k |
| 9. | Essex | £405k |
| 10. | Rutland | £393k |
| ... | ||
| 18. | Somerset | £356k |
| ... | ||
| 45. | Clwyd | £236k |
| 46. | Cumbria | £228k |
| 47. | Lincolnshire | £224k |
| 48. | Merseyside | £224k |
| 49. | South Yorkshire | £213k |
| 50. | Lancashire | £213k |
| 51. | West Glamorgan | £208k |
| 52. | East Riding of Yorkshire | £206k |
| 53. | Tyne and Wear | £202k |
| 54. | Mid Glamorgan | £195k |
| 55. | Durham | £165k |
Yearly average nominal house prices adjusted for inflation.
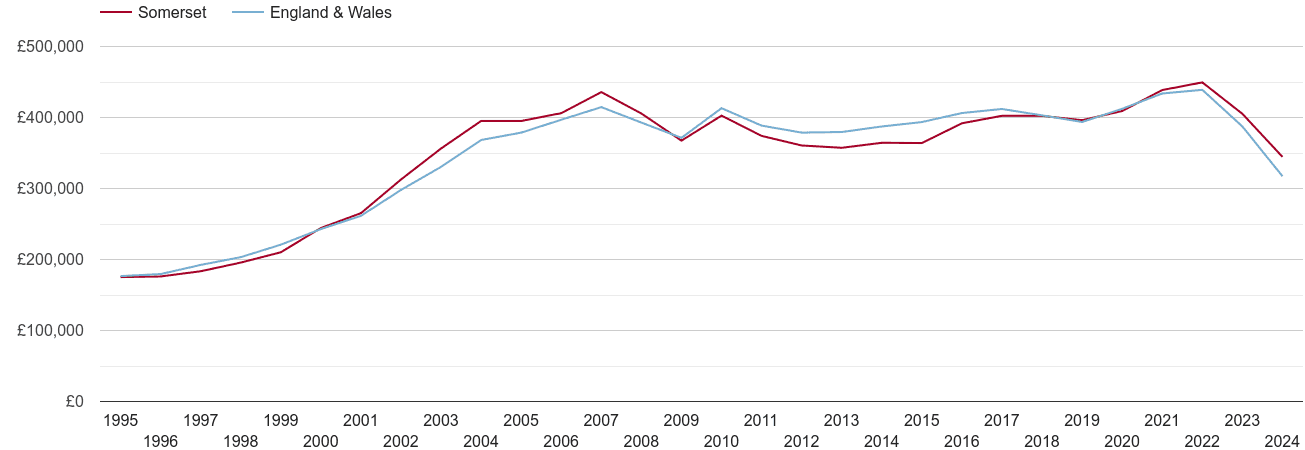
| Year | Somerset county | England & Wales |
|---|---|---|
| 2026 | £344k | £337k |
| 2025 | £377k | £373k |
| 2024 | £389k | £386k |
| 2023 | £431k | £421k |
| 2022 | £485k | £476k |
| 2021 | £473k | £468k |
| 2020 | £444k | £448k |
| 2019 | £426k | £423k |
| 2018 | £435k | £435k |
| 2017 | £434k | £444k |
| 2016 | £422k | £437k |
| 2015 | £392k | £423k |
| 2014 | £391k | £416k |
| 2013 | £385k | £409k |
| 2012 | £388k | £407k |
| 2011 | £403k | £419k |
| 2010 | £435k | £446k |
| 2009 | £397k | £401k |
| 2008 | £437k | £423k |
| 2007 | £470k | £448k |
| 2006 | £437k | £427k |
| 2005 | £427k | £409k |
| 2004 | £426k | £397k |
| 2003 | £385k | £357k |
| 2002 | £337k | £321k |
| 2001 | £286k | £282k |
| 2000 | £264k | £262k |
| 1999 | £227k | £238k |
| 1998 | £211k | £219k |
| 1997 | £198k | £207k |
| 1996 | £190k | £193k |
| 1995 | £189k | £190k |
Yearly average nominal prices compared to England & Wales' house prices
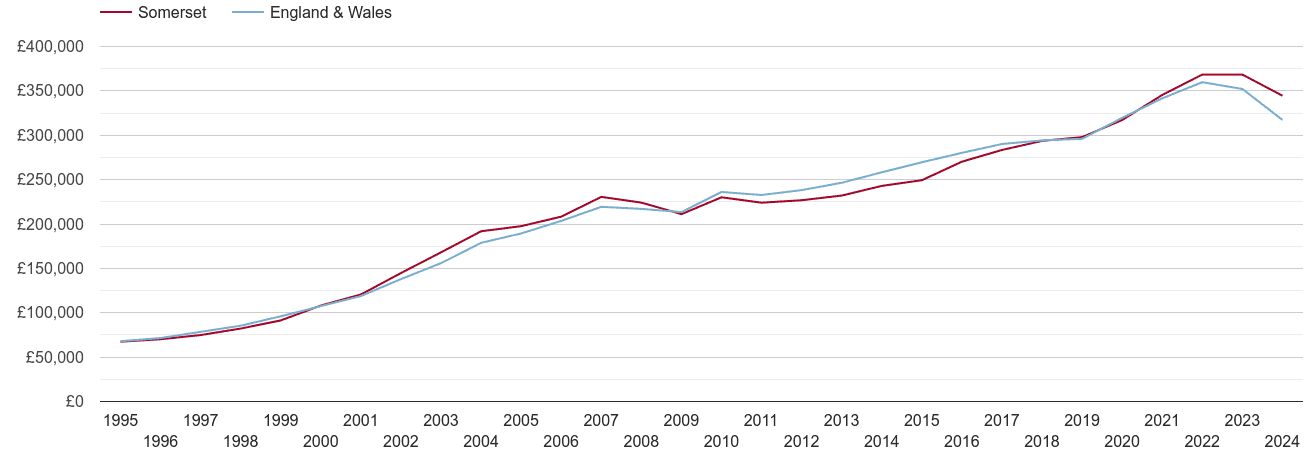
Yearly average nominal prices
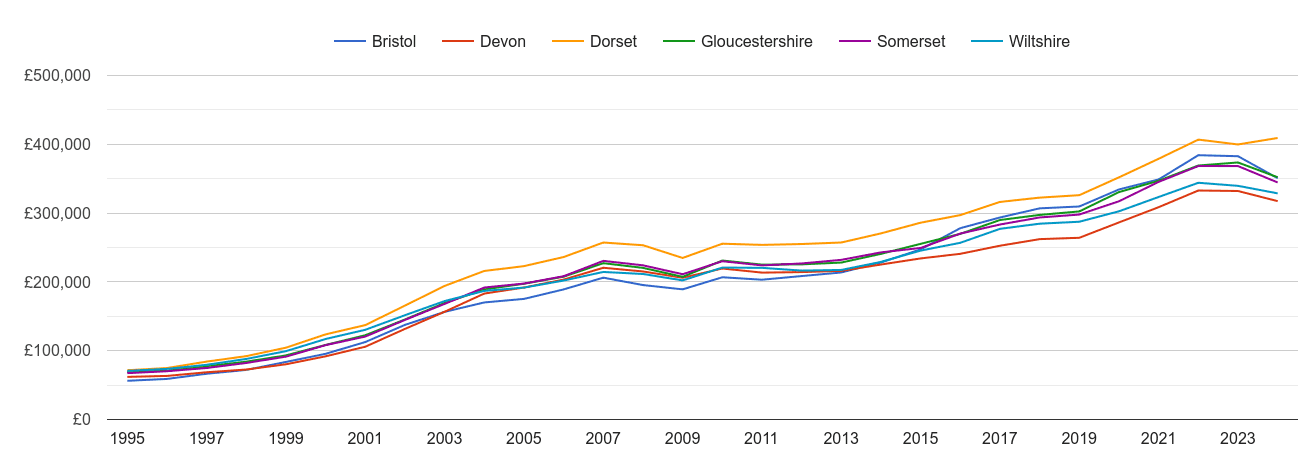
Yearly average nominal prices
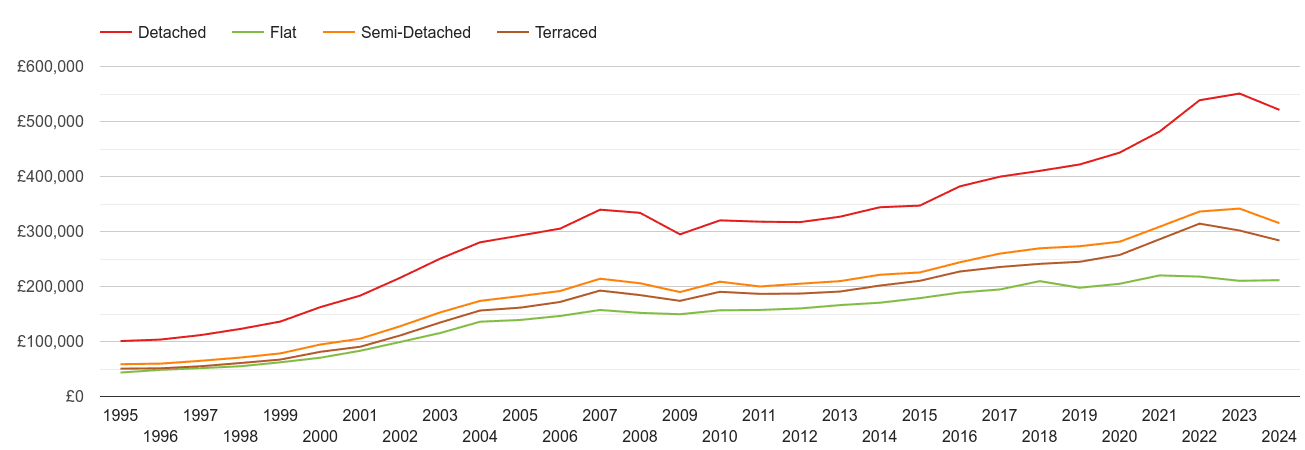
| Property type | Current average price |
|---|---|
| █ Detached | £514k |
| █ Flat | £213k |
| █ Semi-Detached | £332k |
| █ Terraced | £296k |
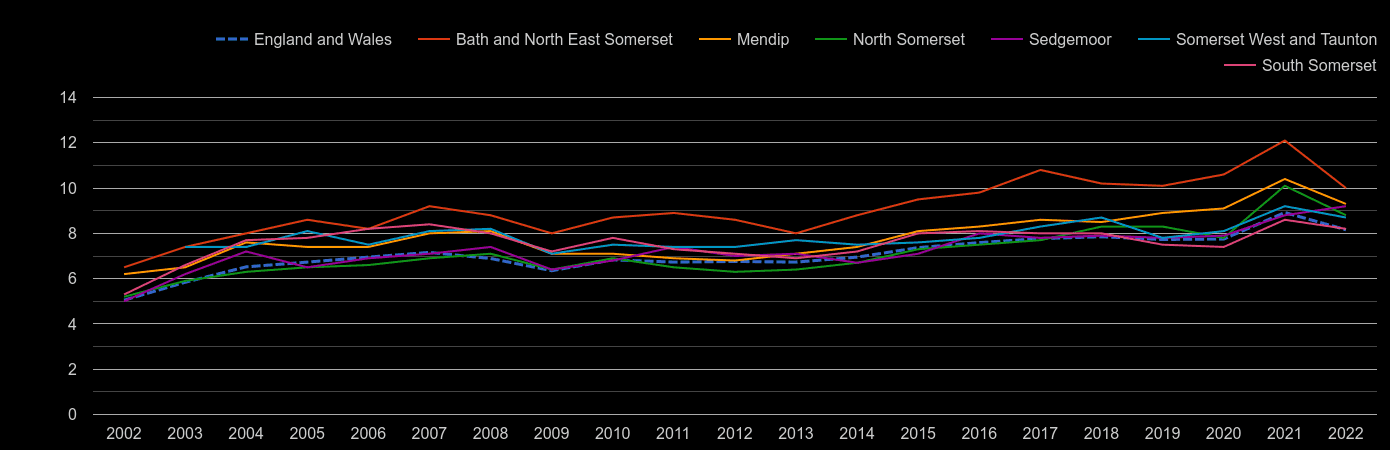
| Local authority | Ratio in 2024 |
|---|---|
| England and Wales | 7.54 |
| Somerset | 7.8 |
| North Somerset | 8.2 |
| Bath and North East Somerset | 9.7 |
 login →