| County | Crime rate vs. ENG & WLS rate | Crime rate per 1000 workday people | Total number of crimes | |
|---|---|---|---|---|
| Cheshire | 86% | 2 | 1525 | |
| Cumbria | 84% | 1 | 726 | |
| Greater Manchester | 167% | 3 | 7937 | |
| Lancashire | 119% | 2 | 3061 | |
| Merseyside | 116% | 2 | 2788 | |
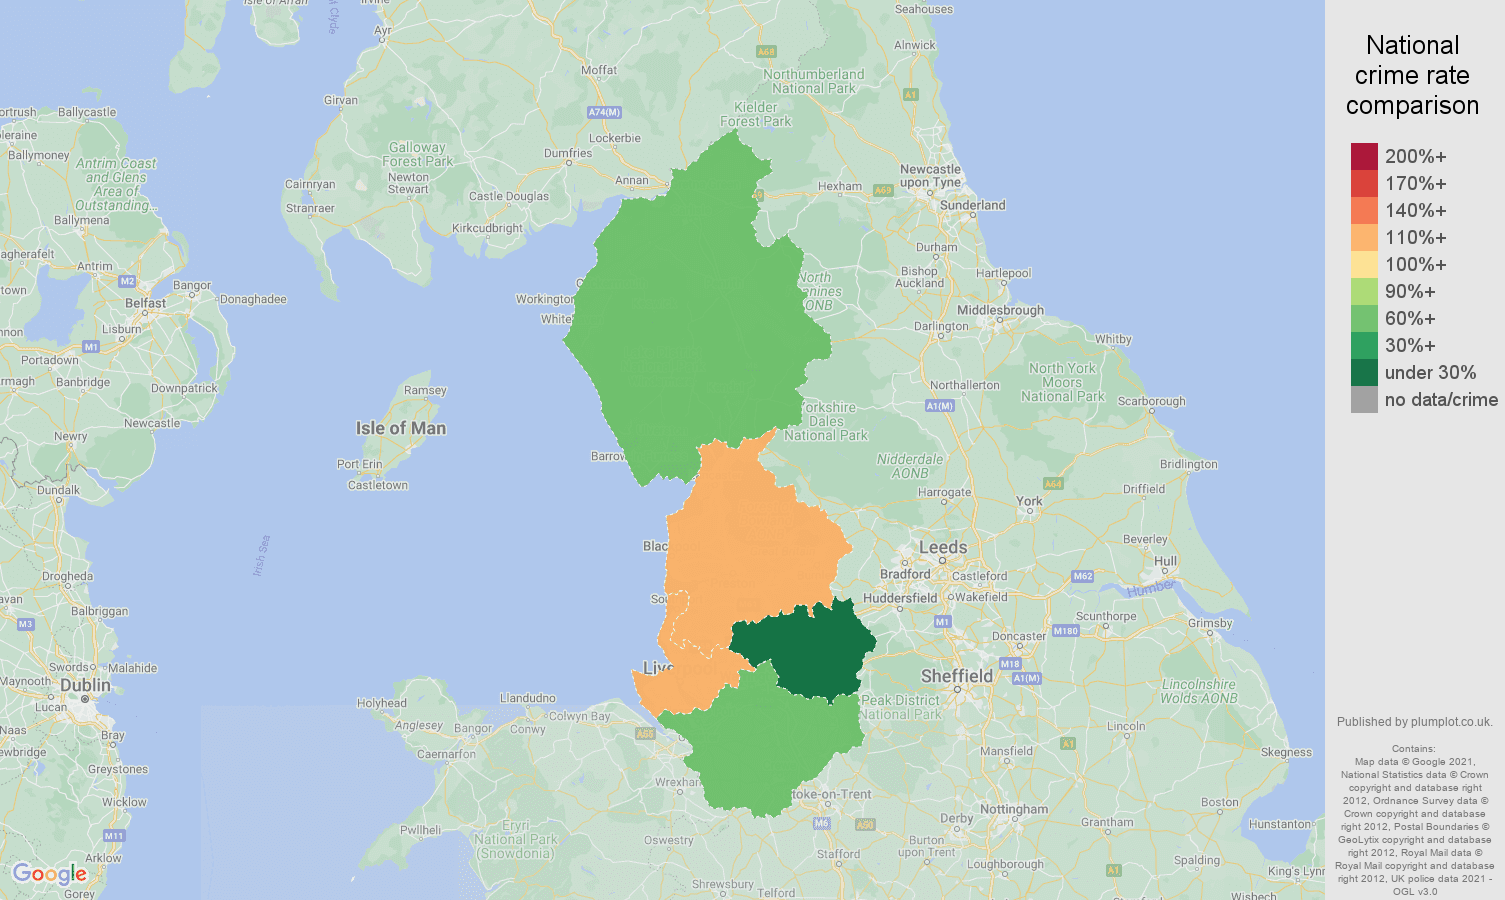
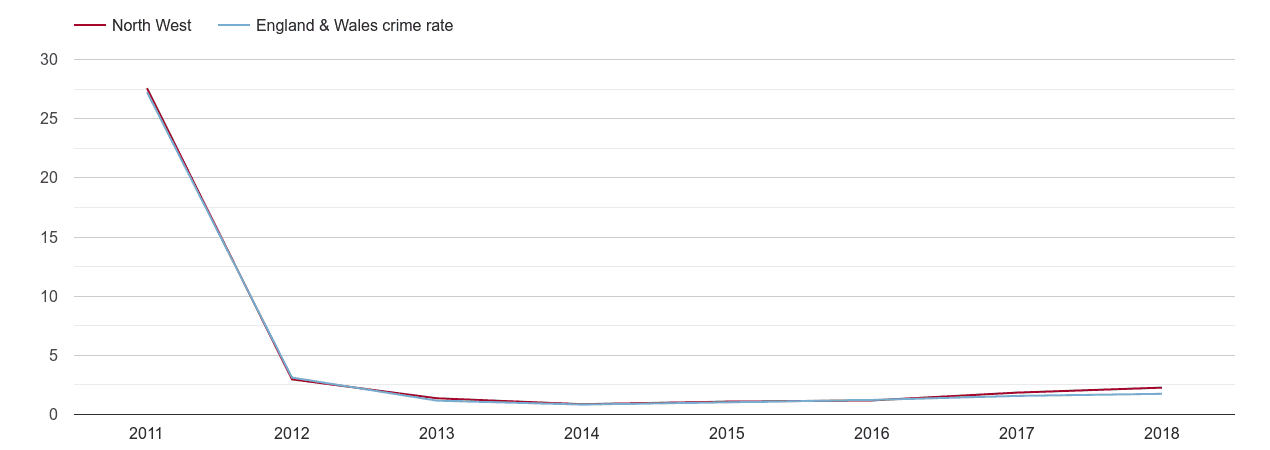
Annual crime rate in North West region is 2.3, i.e. 2.3 crimes reported per annum per 1000 workday people. Compared to the national crime rate, North West's crime rate is at 130%. Other crime makes up 1.7% of all crimes reported in the region. The total number of "other crime" is 16.0k, and this number has increased by 22.9% when compared year-over-year in the period of January 2018 - December 2018.
| County | Crime rate vs. ENG & WLS rate | Crime rate per 1000 workday people | Total number of crimes | |
|---|---|---|---|---|
| Cheshire | 86% | 2 | 1525 | |
| Cumbria | 84% | 1 | 726 | |
| Greater Manchester | 167% | 3 | 7937 | |
| Lancashire | 119% | 2 | 3061 | |
| Merseyside | 116% | 2 | 2788 | |
Other crime rate is 2.3 crimes reported per 1,000 working people per annum. It's the 3. highest crime rate out of 10 England and Wales' regions.
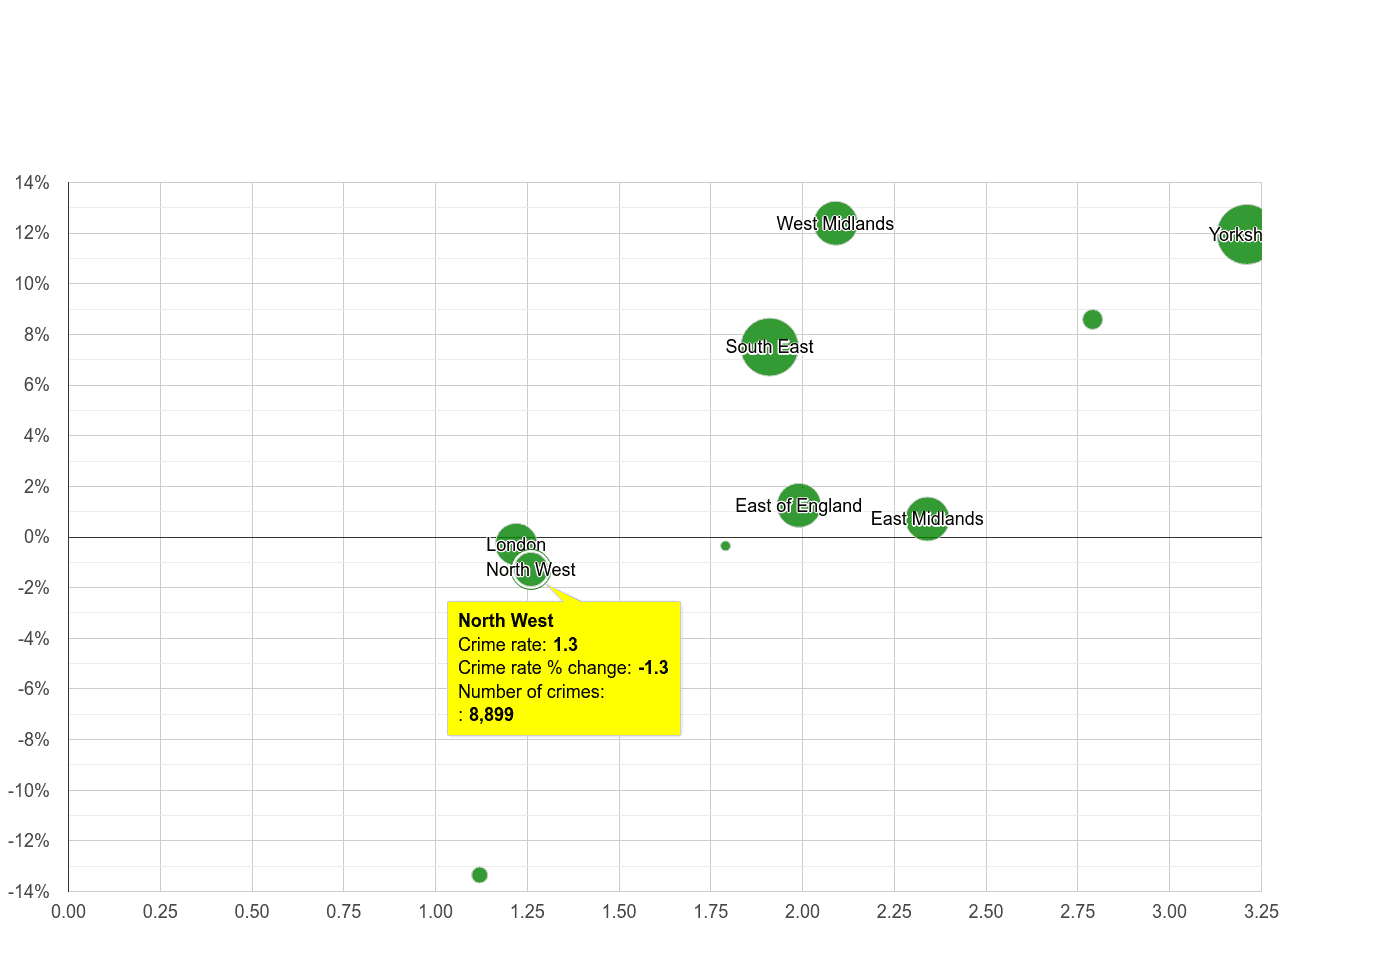
The total number of "other crime" is 16.0k, and this number has increased by 22.9% when compared year-over-year in the period of January 2018 - December 2018. In the graph below, region are compared by crime rate and crime rate percentage change. Crime rate percentage change compares the region crime rate between January 2018 - December 2018 to the region crime rate in the previous 12 months. The size of the circle reflects the number of total crimes reported. The bigger the circle, the higher the number of crimes reported in the region.
 Crime rate percentage change
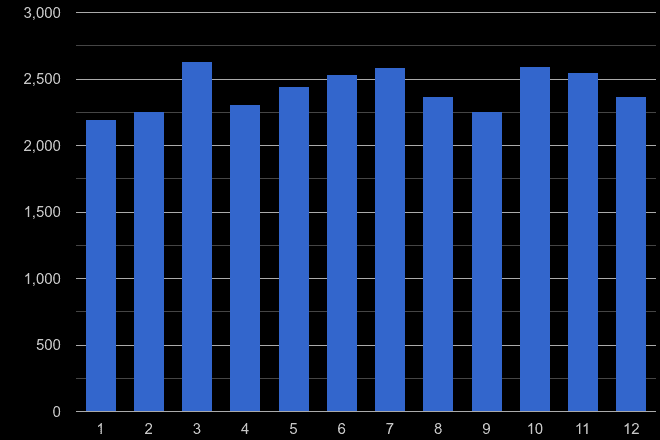
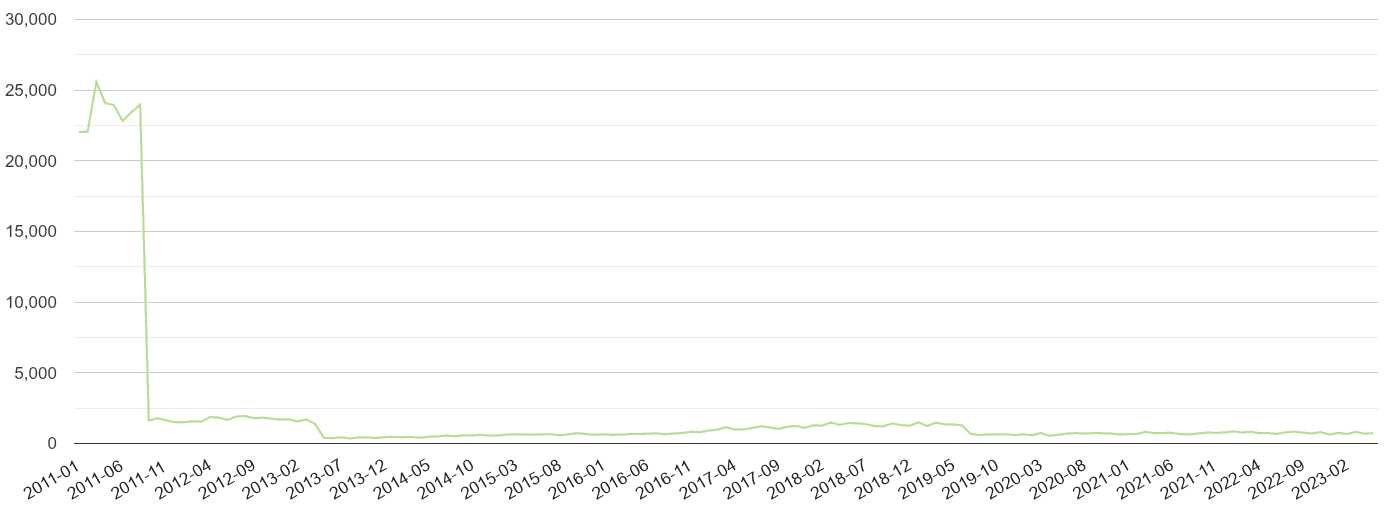
Crime volume by month.
Annual crime rate per 1000 workday people
Total number of crimes reported in a given calendar month (1 = January … 12 = December) 2016 till 2018.