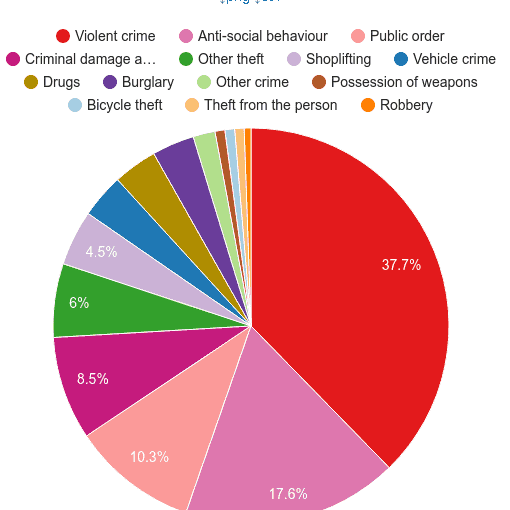
The category of "public order crime" is the highest ranking crime category when category crime rate is compared to the national average. "Public order crime" rate is at 170% of national crime rate which puts North West on 2. position out of 10 England's and Wales' regions in this crime category. "Public order crime" makes up 9.8% of all crimes committed in the area. The total number of "public order crime" is 90.8k cases and has increased by 17.3% when compared year-over-year in the period of January 2018 - December 2018.
For details,
click on the crime name with '→'
170%
of national crime rate2.
highest crime rate out of 10 regions9.8%
of all crimes90.8k
crimes committed17.3%
annual change130%
of national crime rate3.
highest crime rate out of 10 regions1.7%
of all crimes16.0k
crimes committed22.9%
annual change125%
of national crime rate3.
highest crime rate out of 10 regions9.4%
of all crimes86.5k
crimes committed-7.1%
annual change123%
of national crime rate3.
highest crime rate out of 10 regions28.7%
of all crimes265k
crimes committed25.5%
annual change116%
of national crime rate3.
highest crime rate out of 10 regions6.6%
of all crimes60.8k
crimes committed-6.7%
annual change109%
of national crime rate2.
highest crime rate out of 10 regions0.7%
of all crimes6.0k
crimes committed34.6%
annual change106%
of national crime rate3.
highest crime rate out of 10 regions2.0%
of all crimes18.4k
crimes committed14.1%
annual change105%
of national crime rate5.
highest crime rate out of 10 regions19.6%
of all crimes181k
crimes committed-26.5%
annual change105%
of national crime rate2.
highest crime rate out of 10 regions1.1%
of all crimes10.5k
crimes committed16.2%
annual change99%
of national crime rate3.
highest crime rate out of 10 regions6.2%
of all crimes56.9k
crimes committed-0.8%
annual change99%
of national crime rate2.
highest crime rate out of 10 regions1.3%
of all crimes12.2k
crimes committed16.7%
annual change98%
of national crime rate4.
lowest crime rate out of 10 regions4.9%
of all crimes44.8k
crimes committed-3.9%
annual change96%
of national crime rate4.
highest crime rate out of 10 regions6.9%
of all crimes63.6k
crimes committed5.8%
annual change80%
of national crime rate4.
lowest crime rate out of 10 regions1.0%
of all crimes9.5k
crimes committed-4.5%
annual change