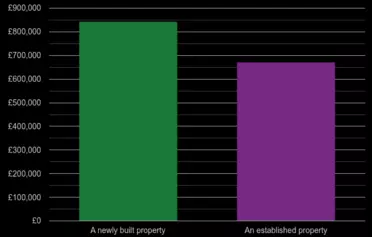
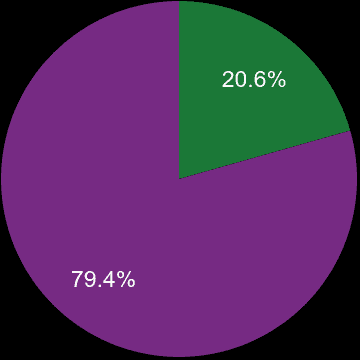
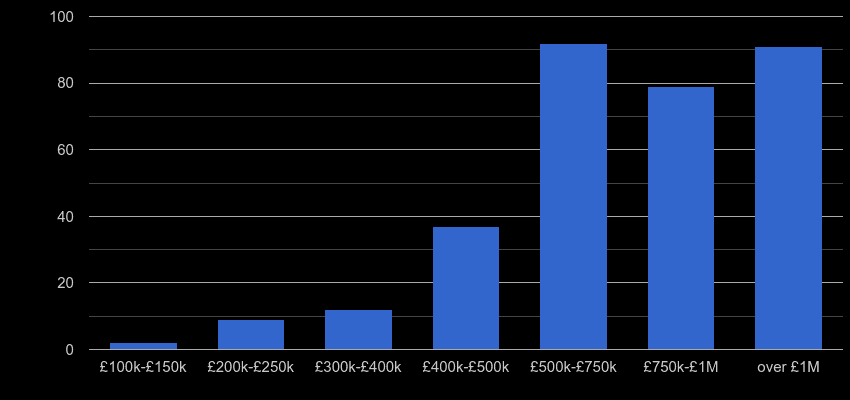
There were 312 property sales in East Central London postcode area in the previous twelve months and sales dropped by 56.7% (-431 transactions). 6 properties, 1.9% were sales of a newly built property. Most properties were sold in the £500k-£750k price range with 98 (31.4%) properties sold, followed by over £1M price range with 65 (20.8%) properties sold.
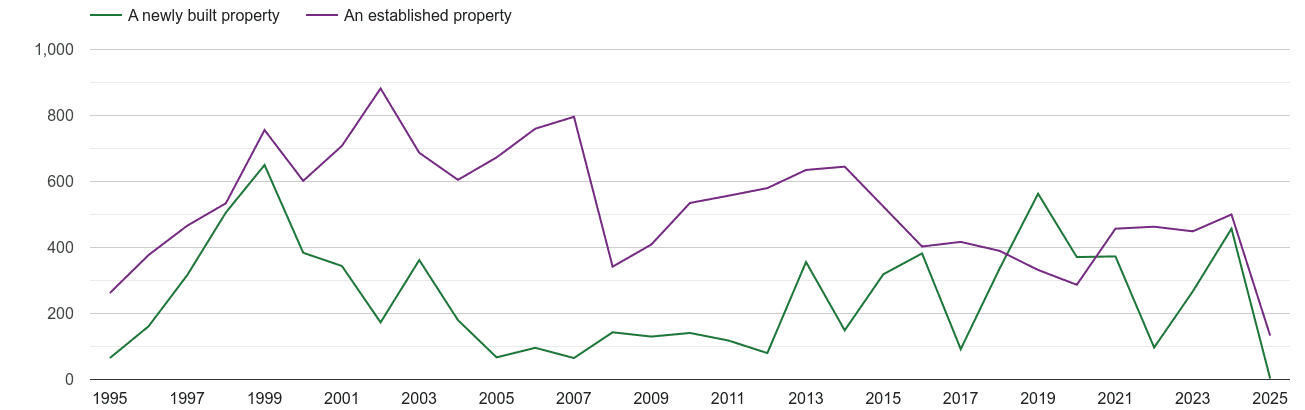
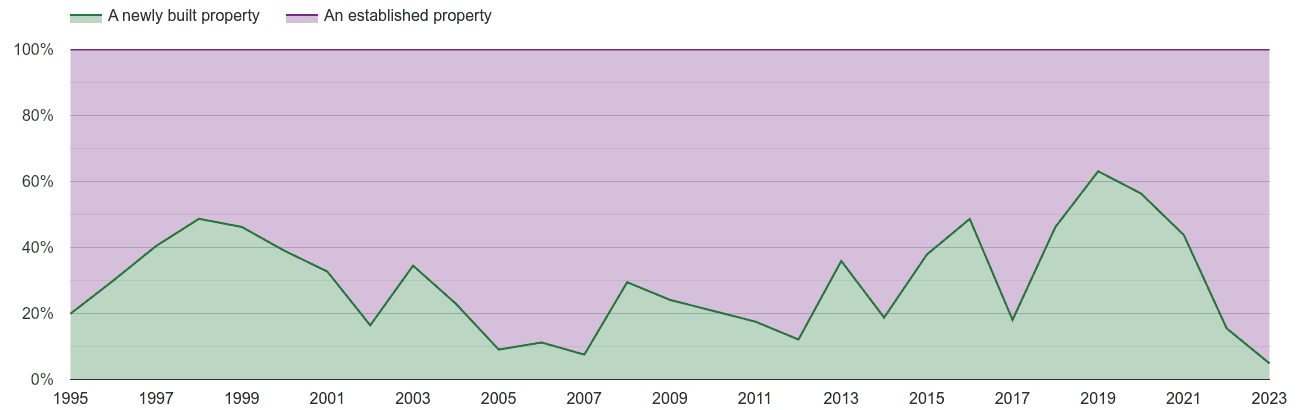
| New or established | Percentage share | Sales volume |
|---|---|---|
| █ A newly built property | 1.9% | 6 |
| █ An established property | 98.1% | 306 |
| All properties | 100% | 312 |
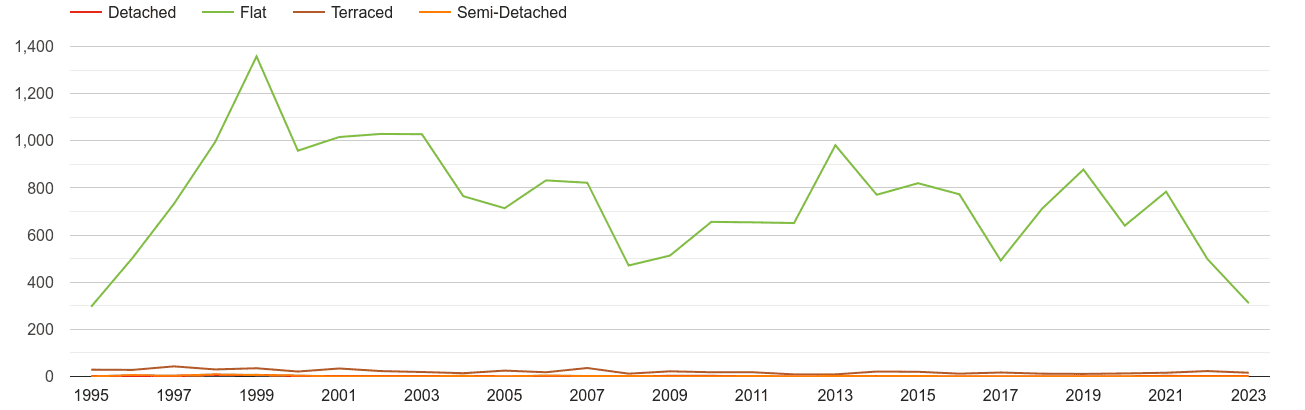
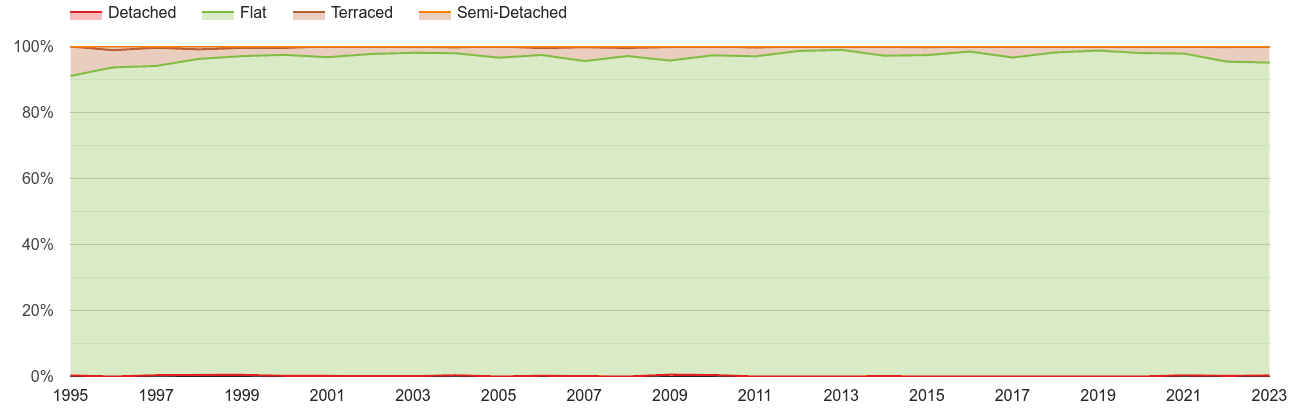
| House Type | Percentage share | Sales volume |
|---|---|---|
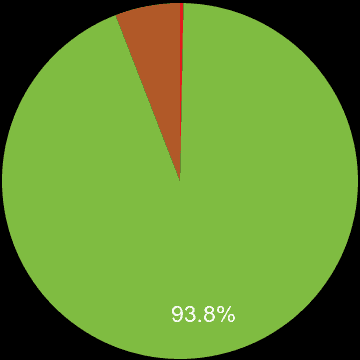
| █ Detached | 0.6% | 2 |
| █ Flat | 95.8% | 299 |
| █ Semi-Detached | 0.3% | 1 |
| █ Terraced | 3.2% | 10 |
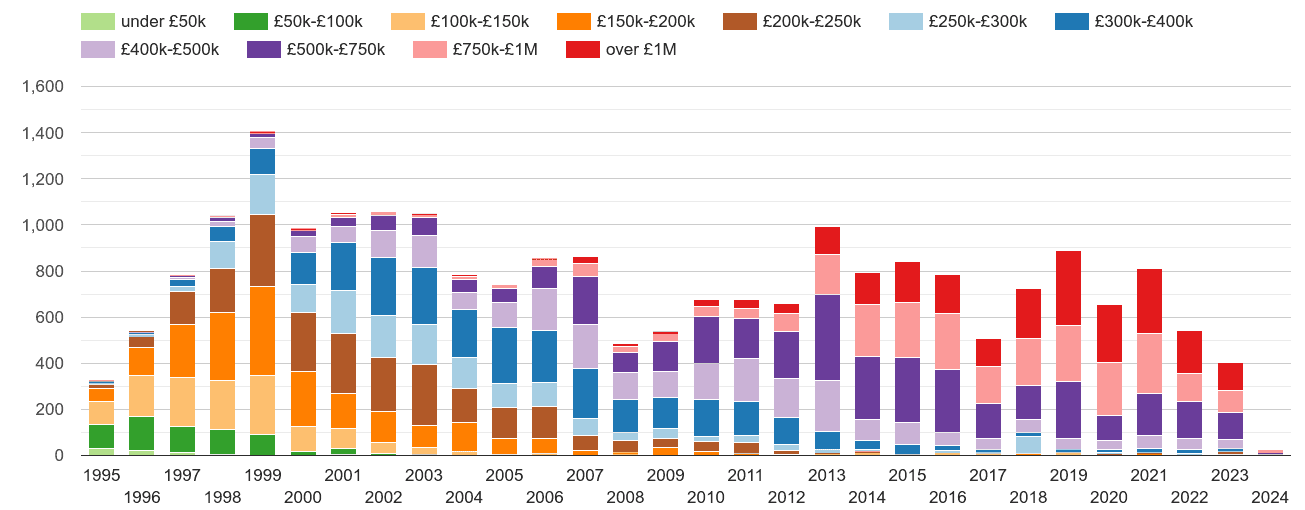
| Property price range | Market share | Sales volume |
|---|---|---|
| £150k-£200k | 0.6% | 2 |
| £200k-£250k | 2.2% | 7 |
| £250k-£300k | 0.6% | 2 |
| £300k-£400k | 6.7% | 21 |
| £400k-£500k | 16.7% | 52 |
| £500k-£750k | 31.4% | 98 |
| £750k-£1M | 20.8% | 65 |
| over £1M | 20.8% | 65 |
Yearly property sales volume by nominal price ranges
Total sales volume by year
Market share by year
Total sales volumes by year
Market share by year
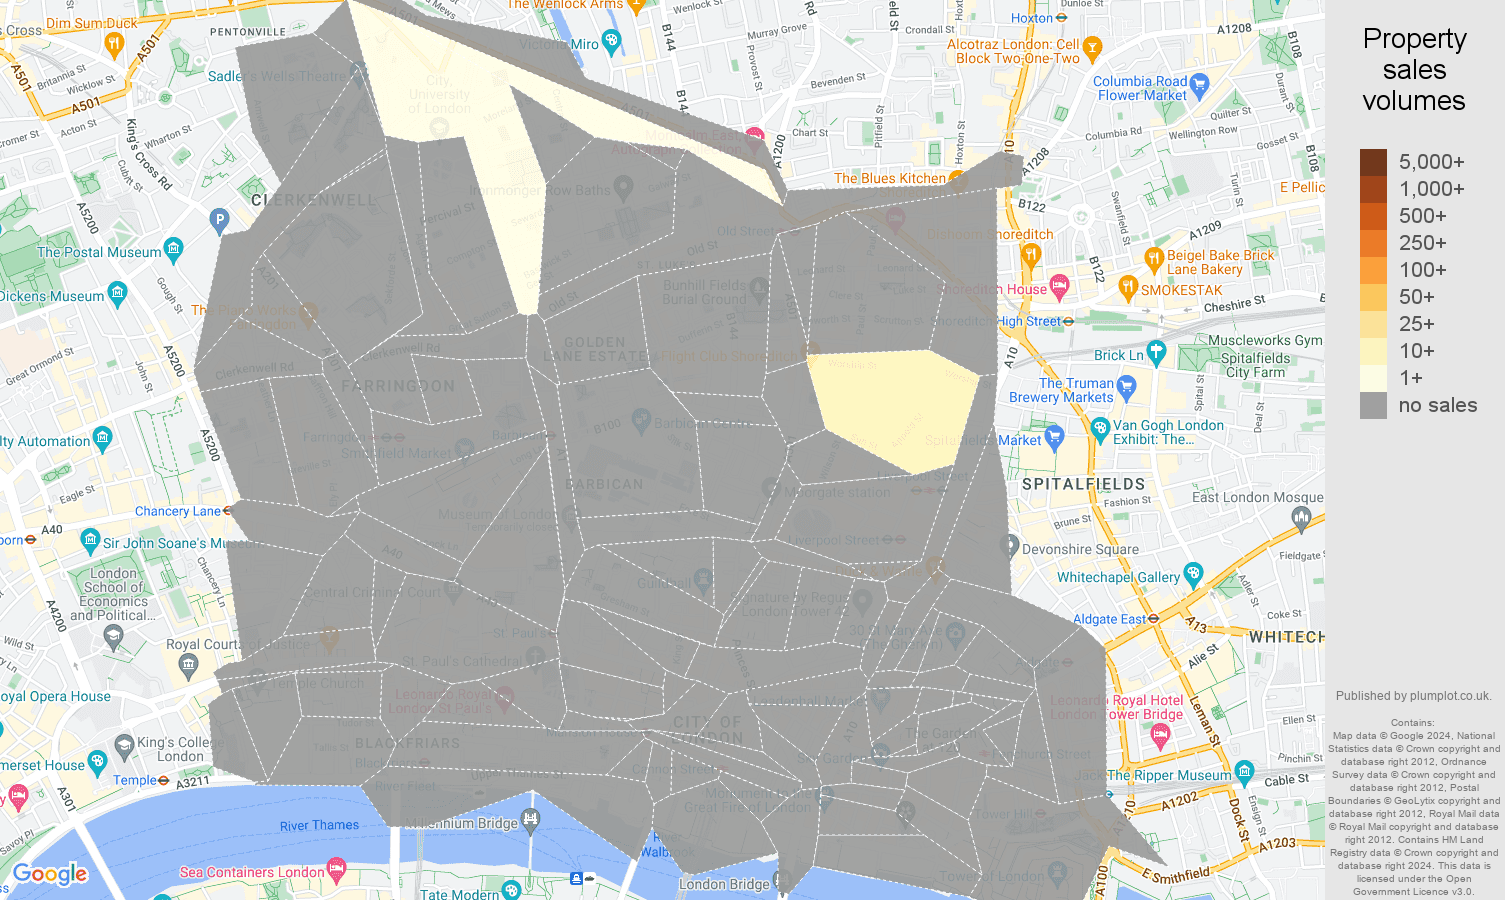
shows the total volume of new properties sold a given postcode sector.


 login →