Maps and Dashboards
allows you to explore the house market development in a much greater detail.
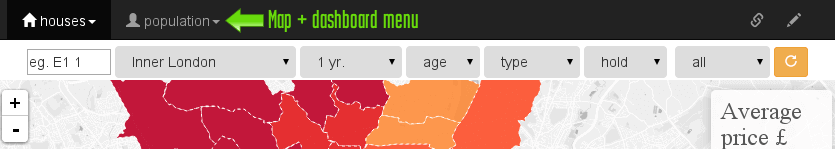
To change a map/dashboard select an item from the top left menu - houses ▾ or population ▾. These two menus include 8 map reports and 12 dashboards with more than 30 reports available.
You can:
- See average price in selected area
houses ▾»average price. - See year over year average price change
houses ▾»avg. price % change. - See price development over the time in selected area
houses ▾»history. - Find areas with most sold new properties
houses ▾»transaction volumes. - See crime rate in selected area,
population ▾»crime. - See residential and business areas,
population ▾»residential areas. - See population density,
population ▾»density.