South West London antisocial behaviour crime statistics
Annual crime rate in South West London postcode area is 26.4, i.e. 26.4 crimes committed per annum per 1000 workday people. Compared to the national crime rate, South West London's crime rate is at 116%. Antisocial behaviour crime makes up 20.8% of all crimes committed in the postcode area. The total number of "antisocial behaviour crime" is 24.3k, and this number has increased by 12.4% when compared year-over-year in the period of November 2018 - October 2019.
26.4
annual crime rate per 1k workday people
116%
of national crime rate
20.8%
of all crimes
24.3k
crimes committed
12.4%
annual change
South West London antisocial behaviour crime rate comparison map
November 2018 - October 2019
Postcode sector
Crime rate vs. ENG & WLS rate
Crime rate per 1000 workday people
Total number of crimes
SW10 0
82%
19
235
SW10 9
131%
30
247
SW11 1
182%
41
315
SW11 2
219%
50
434
SW11 3
116%
26
274
SW11 4
116%
26
188
SW11 5
147%
33
362
SW11 6
177%
40
288
SW12 0
108%
25
121
SW12 8
117%
27
235
SW12 9
185%
42
274
SW13 0
70%
16
84
SW13 8
20%
5
5
SW13 9
98%
22
144
SW14 7
104%
24
139
SW14 8
54%
12
95
SW15 1
106%
24
202
SW15 2
93%
21
192
SW15 3
112%
26
196
SW15 4
138%
31
272
SW15 5
81%
18
165
SW15 6
101%
23
148
SW16 1
162%
37
294
SW16 2
198%
45
521
SW16 3
198%
45
300
SW16 4
112%
26
256
SW16 5
108%
25
291
SW16 6
148%
34
357
SW17 0
106%
24
473
SW17 6
63%
14
12
SW17 7
99%
23
246
SW17 8
155%
35
409
SW17 9
142%
32
380
SW18 1
97%
22
233
SW18 2
104%
24
177
SW18 3
80%
18
170
SW18 4
170%
39
445
SW18 5
70%
16
151
SW19 1
103%
23
233
SW19 2
93%
21
223
SW19 3
71%
16
185
SW19 4
52%
12
105
SW19 5
51%
12
59
SW19 6
123%
28
212
SW19 7
76%
17
109
SW19 8
131%
30
373
SW1A 0
2656%
603
289
SW1A 1
18%
4
28
SW1A 2
41%
9
130
SW1E 5
15%
3
24
SW1E 6
10%
2
20
SW1H 0
63%
14
138
SW1H 9
8%
2
27
SW1P 1
66%
15
186
SW1P 2
66%
15
285
SW1P 3
18%
4
74
SW1P 4
78%
18
220
SW1V 1
276%
63
476
SW1V 2
346%
79
396
SW1V 3
199%
45
279
SW1V 4
270%
61
233
SW1W 0
15%
3
36
SW1W 8
136%
31
179
SW1W 9
103%
23
237
SW1X 0
215%
49
122
SW1X 7
35%
8
67
SW1X 8
43%
10
43
SW1X 9
70%
16
86
SW1Y 4
71%
16
119
SW1Y 5
69%
16
128
SW1Y 6
57%
13
80
SW2 1
239%
54
325
SW2 2
195%
44
327
SW2 3
211%
48
430
SW2 4
135%
31
203
SW2 5
175%
40
336
SW20 0
81%
19
132
SW20 8
49%
11
85
SW20 9
89%
20
114
SW3 1
44%
10
90
SW3 2
87%
20
127
SW3 3
123%
28
168
SW3 4
81%
18
106
SW3 5
89%
20
105
SW3 6
87%
20
134
SW4 0
159%
36
199
SW4 6
174%
39
258
SW4 7
315%
72
390
SW4 8
104%
24
113
SW4 9
127%
29
188
SW5 0
182%
41
263
SW5 9
208%
47
331
SW6 1
167%
38
305
SW6 2
139%
31
357
SW6 3
107%
24
208
SW6 4
102%
23
171
SW6 5
194%
44
257
SW6 6
94%
21
169
SW6 7
99%
23
176
SW7 1
63%
14
73
SW7 2
58%
13
138
SW7 3
63%
14
64
SW7 4
145%
33
189
SW7 5
54%
12
98
SW8 1
181%
41
416
SW8 2
164%
37
342
SW8 3
145%
33
188
SW8 4
103%
23
188
SW8 5
53%
12
59
SW9 0
207%
47
317
SW9 6
159%
36
223
SW9 7
146%
33
270
SW9 8
351%
80
464
SW9 9
229%
52
436
South West London antisocial behaviour crime rate rank
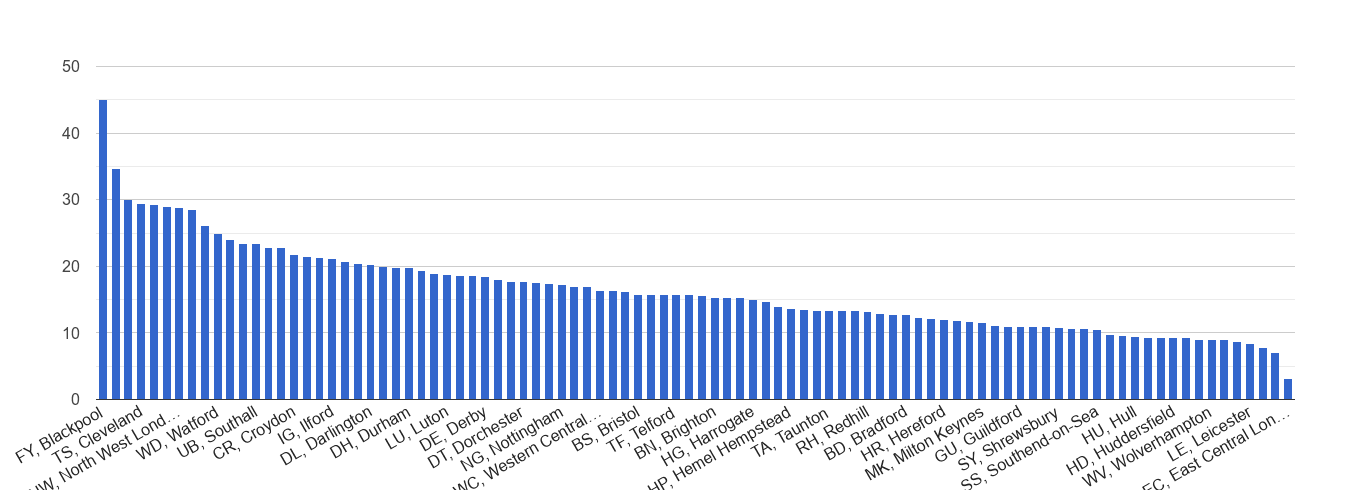
Antisocial behaviour crime rate is 26.4 crimes committed per 1,000 working people per annum. It's the 31. highest crime rate out of 104 England and Wales' postcode areas.
31.
highest crime rate out of 104 postcode areas
26.4
annual crime rate per 1k workday people
South West London antisocial behaviour crime rate compared to other areas
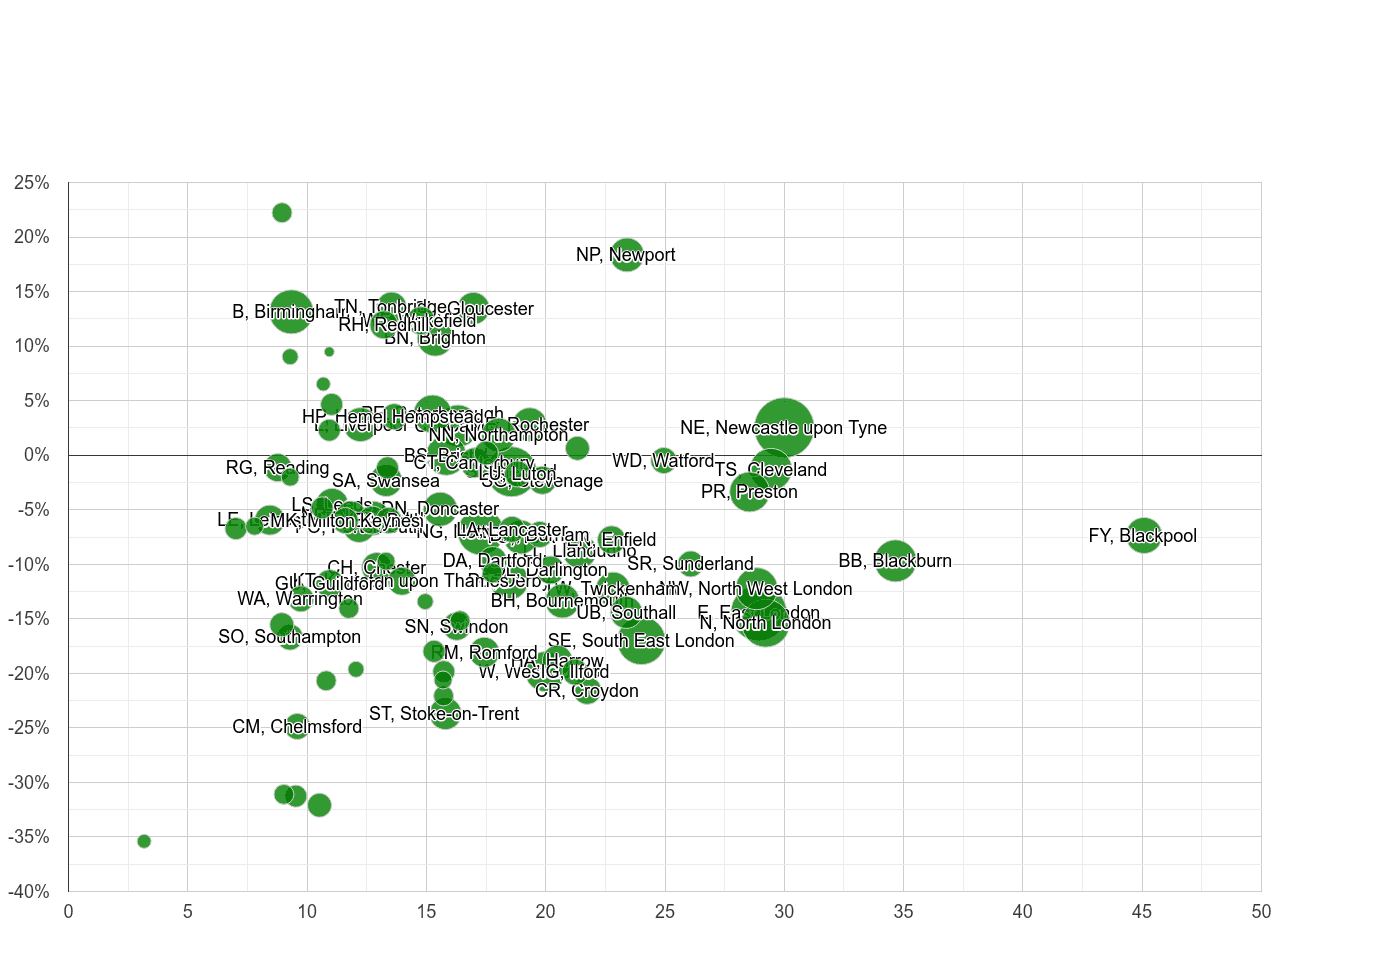
The total number of "antisocial behaviour crime" is 24.3k, and this number has increased by 12.4% when compared year-over-year in the period of November 2018 - October 2019. In the graph below, postcode area are compared by crime rate and crime rate percentage change. Crime rate percentage change compares the postcode area crime rate between November 2018 - October 2019 to the postcode area crime rate in the previous 12 months. The size of the circle reflects the number of total crimes committed. The bigger the circle, the higher the number of crimes committed in the postcode area.
12.4%
annual change
26.4
annual crime rate per 1k workday people
24.3k
crimes committed
Crime rate percentage changeCrime rate per 1000 workday people
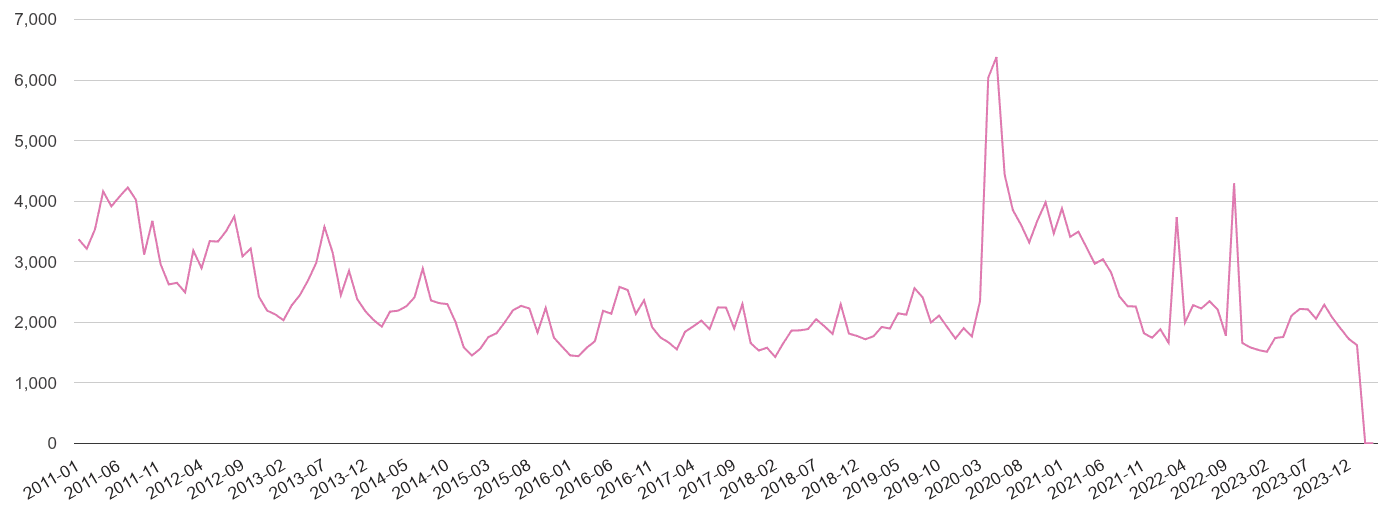
South West London antisocial behaviour crime rate
Annual crime rate per 1000 workday people
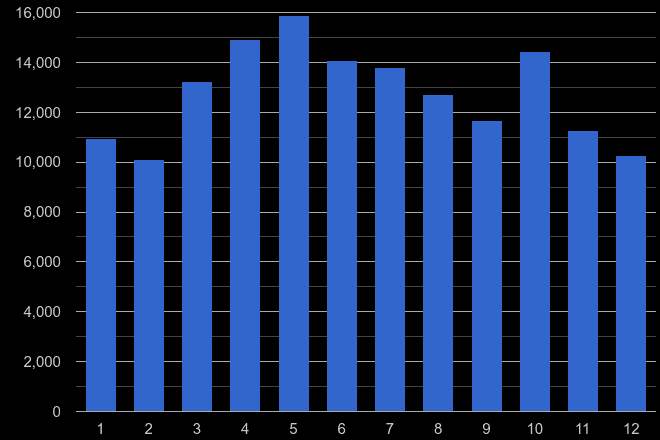
South West London antisocial behaviour crime seasonality
Total number of crimes committed in a given calendar month (1 = January … 12 = December) in the previous five years.