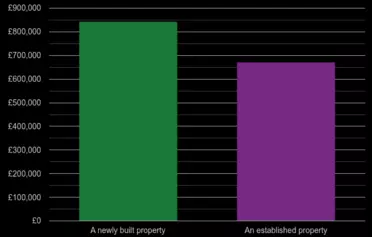
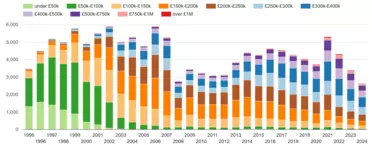
The average house price in East London postcode area is £539k, down by -£18.6k (-3%) over the last 12 months, while the median is £476k. New homes cost £687k, while established homes average £536k. Most homes were sold in the £500k-£750k price range with 2041 (27.2%) properties sold, followed by £400k-£500k price range with 1770 (23.6%) properties sold. There were 7.5k residential property sales and sales dropped by 30.8% (-3.7k transactions).
| October 2025 - September 2026 | East London postcode area | England & Wales |
|---|---|---|
| Median house price | £476k | £280k |
| Average house price | £539k | £349k |
shows a number of properties sold in a given price range between October 2025 - September 2026.

| House price range | Market share | Sales volume |
|---|---|---|
| █ £50k-£100k | 0.1% | 7 |
| █ £100k-£150k | 1.2% | 87 |
| █ £150k-£200k | 2.0% | 153 |
| █ £200k-£250k | 3.7% | 281 |
| █ £250k-£300k | 6.4% | 483 |
| █ £300k-£400k | 19.7% | 1.5k |
| █ £400k-£500k | 23.6% | 1.8k |
| █ £500k-£750k | 27.2% | 2.0k |
| █ £750k-£1M | 11.2% | 838 |
| █ over £1M | 5.0% | 373 |
This price map shows the average house price in a given postcode sector. The most affordable place is 'E6 7' with the average price of £343k. The most expensive place is 'E1W 1', £798k.

Comparison of the average house price and an average price percentage change by postcode area. Price % change compares the average house price between October 2025 - September 2026 to the average price in the previous 12 months. The size of the circle shows the number of property transactions. The bigger the circle the higher the sales volumes in postcode area.
 Average price percentage change
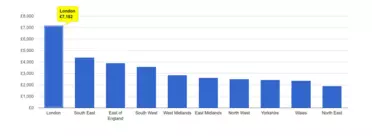
With the average price of £539k, East London is the 15. most pricey postcode area out of 105 England and Wales' postcode areas.

| Rank | postcode area | Average price |
|---|---|---|
| 1. | WC, Western Central London | £1.0M |
| 2. | W, West London | £1.0M |
| 3. | SW, South West London | £908k |
| 4. | NW, North West London | £900k |
| 5. | EC, East Central London | £767k |
| 6. | N, North London | £705k |
| 7. | KT, Kingston upon Thames | £662k |
| 8. | AL, St Albans | £622k |
| 9. | TW, Twickenham | £604k |
| 10. | SL, Slough | £597k |
| ... | ||
| 15. | E, East London | £539k |
| ... | ||
| 95. | CA, Carlisle | £215k |
| 96. | BD, Bradford | £215k |
| 97. | WN, Wigan | £203k |
| 98. | HU, Hull | £196k |
| 99. | DN, Doncaster | £193k |
| 100. | FY, Blackpool | £189k |
| 101. | DL, Darlington | £187k |
| 102. | BB, Blackburn | £184k |
| 103. | TS, Cleveland | £176k |
| 104. | DH, Durham | £170k |
| 105. | SR, Sunderland | £149k |
Yearly average nominal house prices adjusted for inflation.

| Year | East London postcode area | England & Wales |
|---|---|---|
| 2026 | £533k | £345k |
| 2025 | £578k | £374k |
| 2024 | £594k | £386k |
| 2023 | £638k | £421k |
| 2022 | £743k | £476k |
| 2021 | £755k | £468k |
| 2020 | £736k | £448k |
| 2019 | £714k | £423k |
| 2018 | £731k | £435k |
| 2017 | £735k | £444k |
| 2016 | £721k | £437k |
| 2015 | £650k | £423k |
| 2014 | £605k | £416k |
| 2013 | £547k | £409k |
| 2012 | £525k | £407k |
| 2011 | £531k | £419k |
| 2010 | £557k | £446k |
| 2009 | £512k | £401k |
| 2008 | £538k | £423k |
| 2007 | £568k | £448k |
| 2006 | £513k | £427k |
| 2005 | £495k | £409k |
| 2004 | £492k | £397k |
| 2003 | £454k | £357k |
| 2002 | £410k | £321k |
| 2001 | £359k | £282k |
| 2000 | £326k | £262k |
| 1999 | £277k | £238k |
| 1998 | £237k | £219k |
| 1997 | £209k | £207k |
| 1996 | £178k | £193k |
| 1995 | £171k | £190k |
Yearly average nominal prices and CAGR compared to England & Wales' house prices

| Year | East London postcode area average price CAGR | England & Wales average price CAGR |
|---|---|---|
| 2026 | £533k 7.24% | £345k 5.38% |
| 2025 | £556k 7.63% | £360k 5.71% |
| 2024 | £550k 7.87% | £358k 5.89% |
| 2023 | £541k 8.10% | £357k 6.11% |
| 2022 | £563k 8.57% | £361k 6.38% |
| 2021 | £551k 8.83% | £342k 6.41% |
| 2020 | £526k 8.99% | £320k 6.39% |
| 2019 | £499k 9.15% | £296k 6.32% |
| 2018 | £494k 9.51% | £294k 6.58% |
| 2017 | £481k 9.83% | £290k 6.82% |
| 2016 | £462k 10.11% | £280k 6.98% |
| 2015 | £414k 10.04% | £270k 7.14% |
| 2014 | £376k 10.03% | £258k 7.28% |
| 2013 | £329k 9.81% | £247k 7.42% |
| 2012 | £307k 9.96% | £238k 7.66% |
| 2011 | £295k 10.34% | £233k 8.00% |
| 2010 | £295k 11.06% | £236k 8.66% |
| 2009 | £272k 11.26% | £213k 8.52% |
| 2008 | £276k 12.29% | £217k 9.35% |
| 2007 | £278k 13.47% | £219k 10.26% |
| 2006 | £244k 13.42% | £204k 10.49% |
| 2005 | £229k 14.14% | £189k 10.80% |
| 2004 | £222k 15.39% | £179k 11.35% |
| 2003 | £198k 15.86% | £156k 10.94% |
| 2002 | £176k 16.31% | £138k 10.65% |
| 2001 | £151k 16.31% | £119k 9.77% |
| 2000 | £133k 16.89% | £108k 9.61% |
| 1999 | £112k 16.31% | £96.0k 9.04% |
| 1998 | £92.5k 14.79% | £85.4k 7.94% |
| 1997 | £79.2k 13.80% | £78.5k 7.51% |
| 1996 | £65.9k 7.89% | £71.5k 5.26% |
| 1995 | £61.1k | £67.9k |
Yearly average nominal prices

| postcode area | 5Y Change | 10Y Change | 20Y Change | 30Y Change |
|---|---|---|---|---|
| E, East London | -3.3% | 15% | 118% | 708% |
| EC, East Central London | -28.0% | -14.9% | 98% | 454% |
| EN, Enfield | -1.6% | 17% | 98% | 454% |
| IG, Ilford | 3.7% | 24% | 98% | 498% |
| N, North London | 0.6% | 13% | 120% | 570% |
| SE, South East London | -0.7% | 12% | 123% | 629% |
Yearly average nominal prices

| October 2025 - September 2026 | East London postcode area | England & Wales |
|---|---|---|
| Detached | £1.1M | £506k |
| Flat | £442k | £289k |
| Semi-Detached | £798k | £322k |
| Terraced | £670k | £287k |
| Property type | 5Y Change | 10Y Change | 20Y Change | 30Y Change |
|---|---|---|---|---|
| Detached | -3.7% | 23% | 113% | 638% |
| Flat | -14.8% | 0.2% | 89% | 624% |
| Semi-Detached | 12% | 37% | 158% | 755% |
| Terraced | 6.6% | 25% | 162% | 919% |
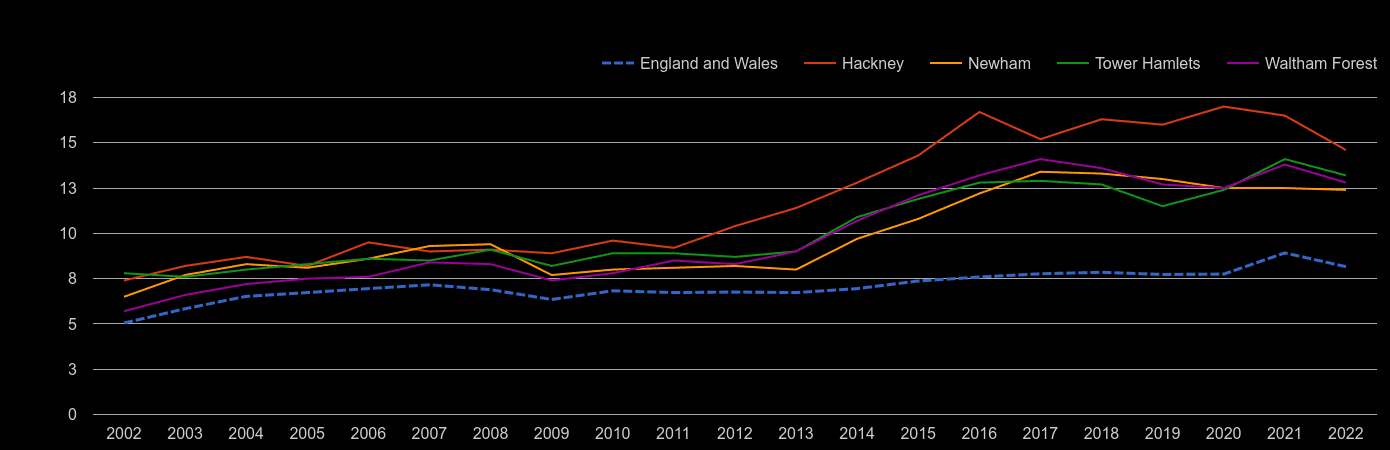
| Local authority | Ratio in 2024 |
|---|---|
| England and Wales | 7.54 |
| Tower Hamlets | 10.2 |
| Newham | 11.2 |
| Waltham Forest | 11.6 |
| Hackney | 12.6 |
 login →