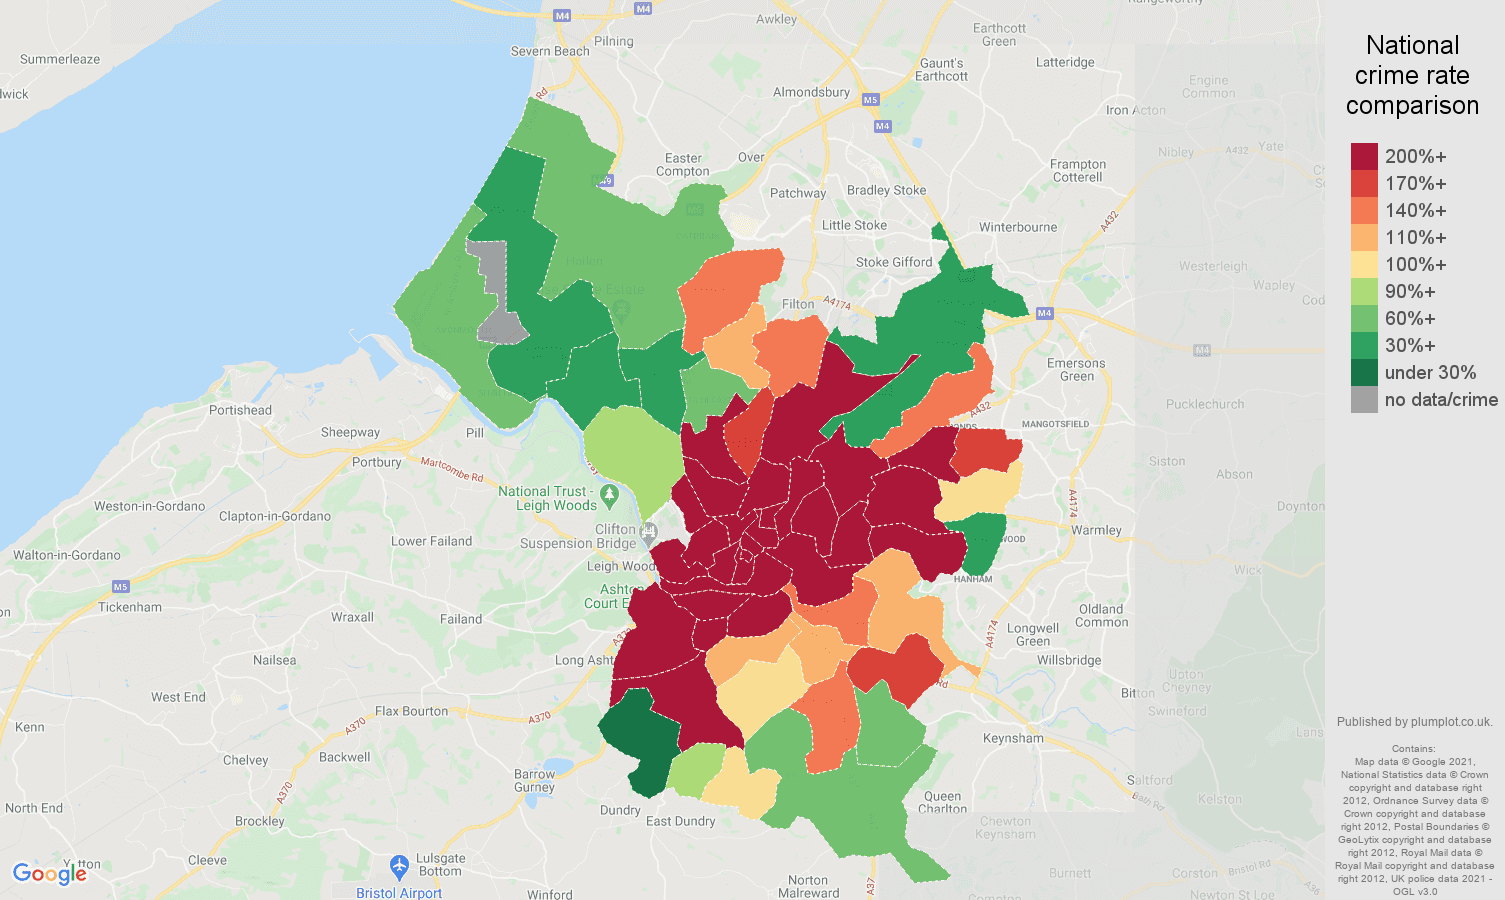
As of June 2026, the annual crime rate in Bristol county county stands at 1.9 crimes per 1000 people. Bristol county's current crime levels are at 225% of the national crime rate. Bicycle theft crime makes up 1.3% of all crimes reported in the county. Bicycle theft crime totalled 951 representing a decrease 18.6% year-over-year.
| Bristol county county | crime statistic | England & Wales |
|---|---|---|
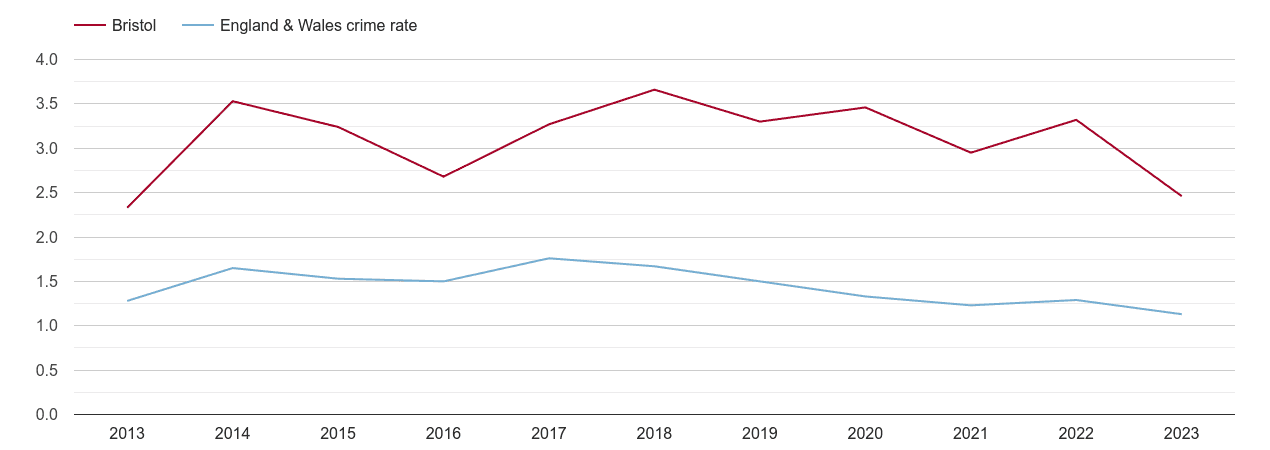
| 1.9 | annual crime rate per 1k workday people | 0.9 |
| 225% | ratio of national crime rate | 100% |
| 1.3% | share of all crimes | 0.8% |
| 951 | crimes reported | 47.7k |
| -18.6% | annual change | -9.6% |
| Postcode sector | Crime rate vs. ENG & WLS rate | Crime rate per 1000 workday people | Total number of crimes | |
|---|---|---|---|---|
| BS1 1 | 535% | 5 | 26 | |
| BS1 2 | 1704% | 15 | 43 | |
| BS1 3 | 942% | 8 | 74 | |
| BS1 4 | 904% | 8 | 49 | |
| BS1 5 | 462% | 4 | 64 | |
| BS1 6 | 397% | 3 | 78 | |
| BS10 5 | 57% | 0 | 5 | |
| BS10 6 | 51% | 0 | 4 | |
| BS10 7 | 42% | 0 | 4 | |
| BS11 0 | 31% | 0 | 3 | |
| BS11 9 | 29% | 0 | 3 | |
| BS13 0 | 30% | 0 | 2 | |
| BS13 7 | 15% | 0 | 1 | |
| BS13 8 | 38% | 0 | 2 | |
| BS13 9 | 92% | 1 | 4 | |
| BS14 0 | 139% | 1 | 9 | |
| BS14 8 | 21% | 0 | 1 | |
| BS14 9 | 42% | 0 | 3 | |
| BS15 1 | 97% | 1 | 7 | |
| BS15 8 | 72% | 1 | 4 | |
| BS16 1 | 47% | 0 | 11 | |
| BS16 2 | 98% | 1 | 7 | |
| BS16 3 | 212% | 2 | 14 | |
| BS16 4 | 49% | 0 | 3 | |
| BS2 0 | 495% | 4 | 44 | |
| BS2 8 | 302% | 3 | 42 | |
| BS2 9 | 350% | 3 | 24 | |
| BS3 1 | 380% | 3 | 22 | |
| BS3 2 | 84% | 1 | 6 | |
| BS3 3 | 121% | 1 | 4 | |
| BS3 4 | 442% | 4 | 26 | |
| BS3 5 | 105% | 1 | 5 | |
| BS4 1 | 84% | 1 | 8 | |
| BS4 2 | 77% | 1 | 5 | |
| BS4 3 | 178% | 2 | 11 | |
| BS4 4 | 156% | 1 | 13 | |
| BS4 5 | 160% | 1 | 8 | |
| BS5 0 | 378% | 3 | 32 | |
| BS5 6 | 423% | 4 | 39 | |
| BS5 7 | 188% | 2 | 14 | |
| BS5 8 | 149% | 1 | 8 | |
| BS5 9 | 204% | 2 | 20 | |
| BS6 5 | 290% | 2 | 19 | |
| BS6 6 | 183% | 2 | 15 | |
| BS6 7 | 59% | 1 | 4 | |
| BS7 0 | 257% | 2 | 26 | |
| BS7 8 | 113% | 1 | 8 | |
| BS7 9 | 213% | 2 | 23 | |
| BS8 1 | 649% | 6 | 59 | |
| BS8 2 | 377% | 3 | 24 | |
| BS8 4 | 122% | 1 | 7 | |
| BS9 1 | 44% | 0 | 3 | |
| BS9 2 | 100% | 1 | 4 | |
| BS9 3 | 78% | 1 | 5 | |
| BS9 4 | 38% | 0 | 2 | |
Crime rate ranking : Bristol county county has the 1. highest crime rate out of 54 counties
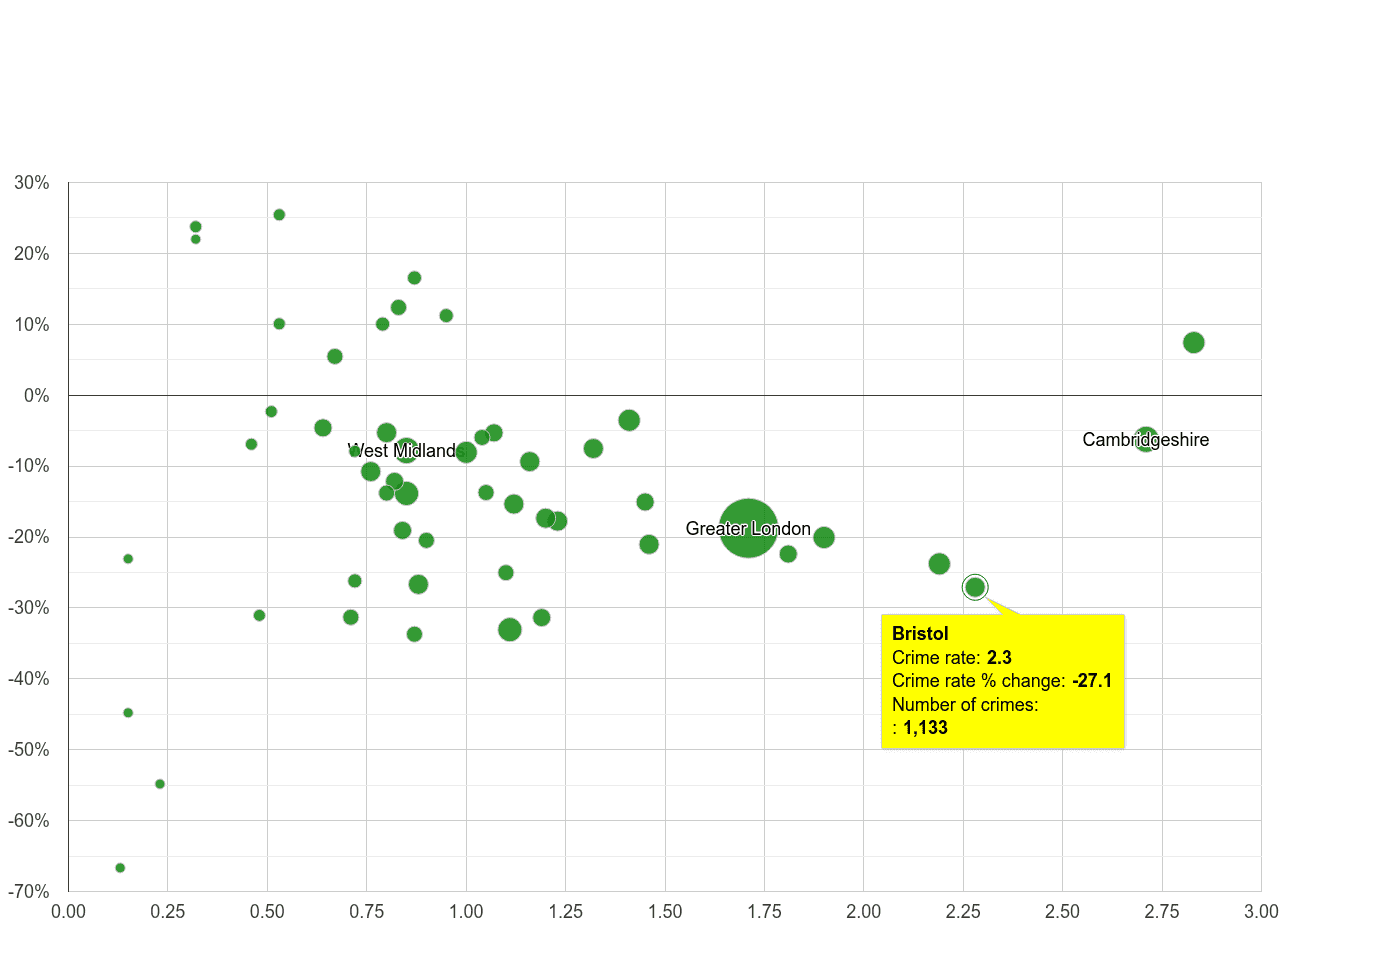
Bicycle theft crime totalled 951 representing a decrease 18.6% year-over-year. In the graph below, county are compared by crime rate and crime rate percentage change. Crime rate percentage change compares the county crime rate between June 2025 - May 2026 to the county crime rate in the previous 12 months. The size of the circle reflects the number of total crimes reported. The bigger the circle, the higher the number of crimes reported in the county.
-18.6% annual change, crime is declining
951 crimes reported
 Crime rate percentage change
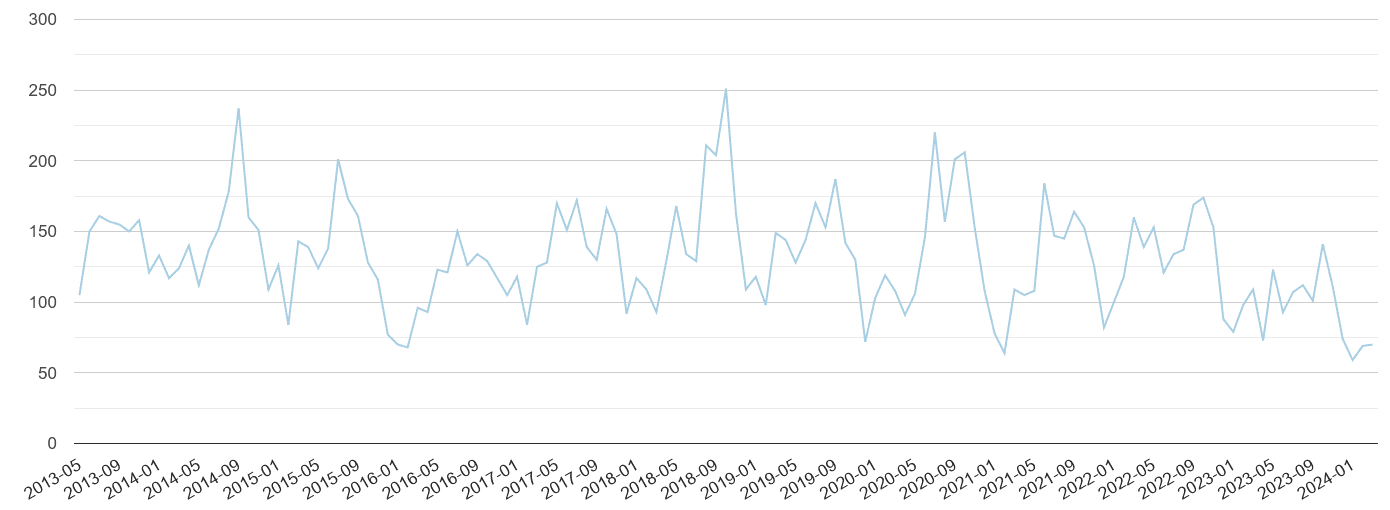
Number of crime incidents by month from January 2014 to May 2026.
Crime rate per 1000 workday people compared to the national crime rate by year.
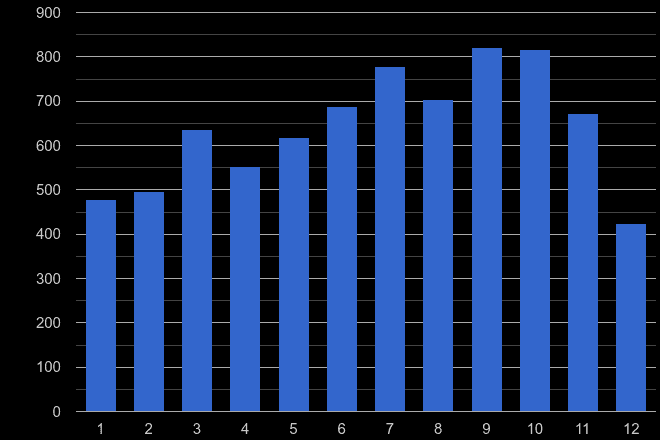
Total number of crimes reported in a given calendar month (1 = January … 12 = December) in the previous five years, i.e. from 2020 till 2024.
For details, click on the crime name with '→'
 login →


