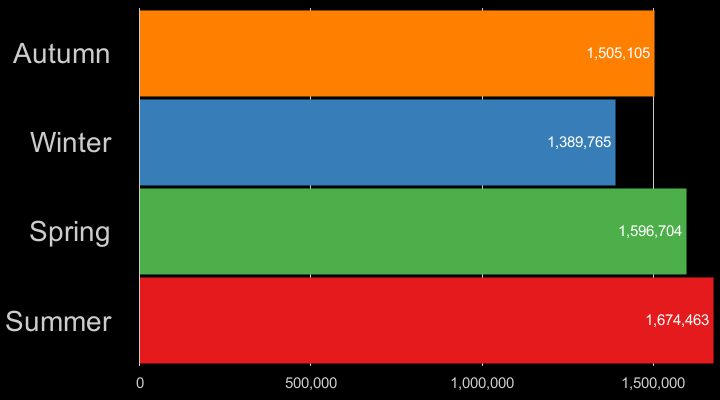
Violent crime seasonality
From September 2011 till August 2017, there were
5.4 million
violent crimes committed in England and Wales.
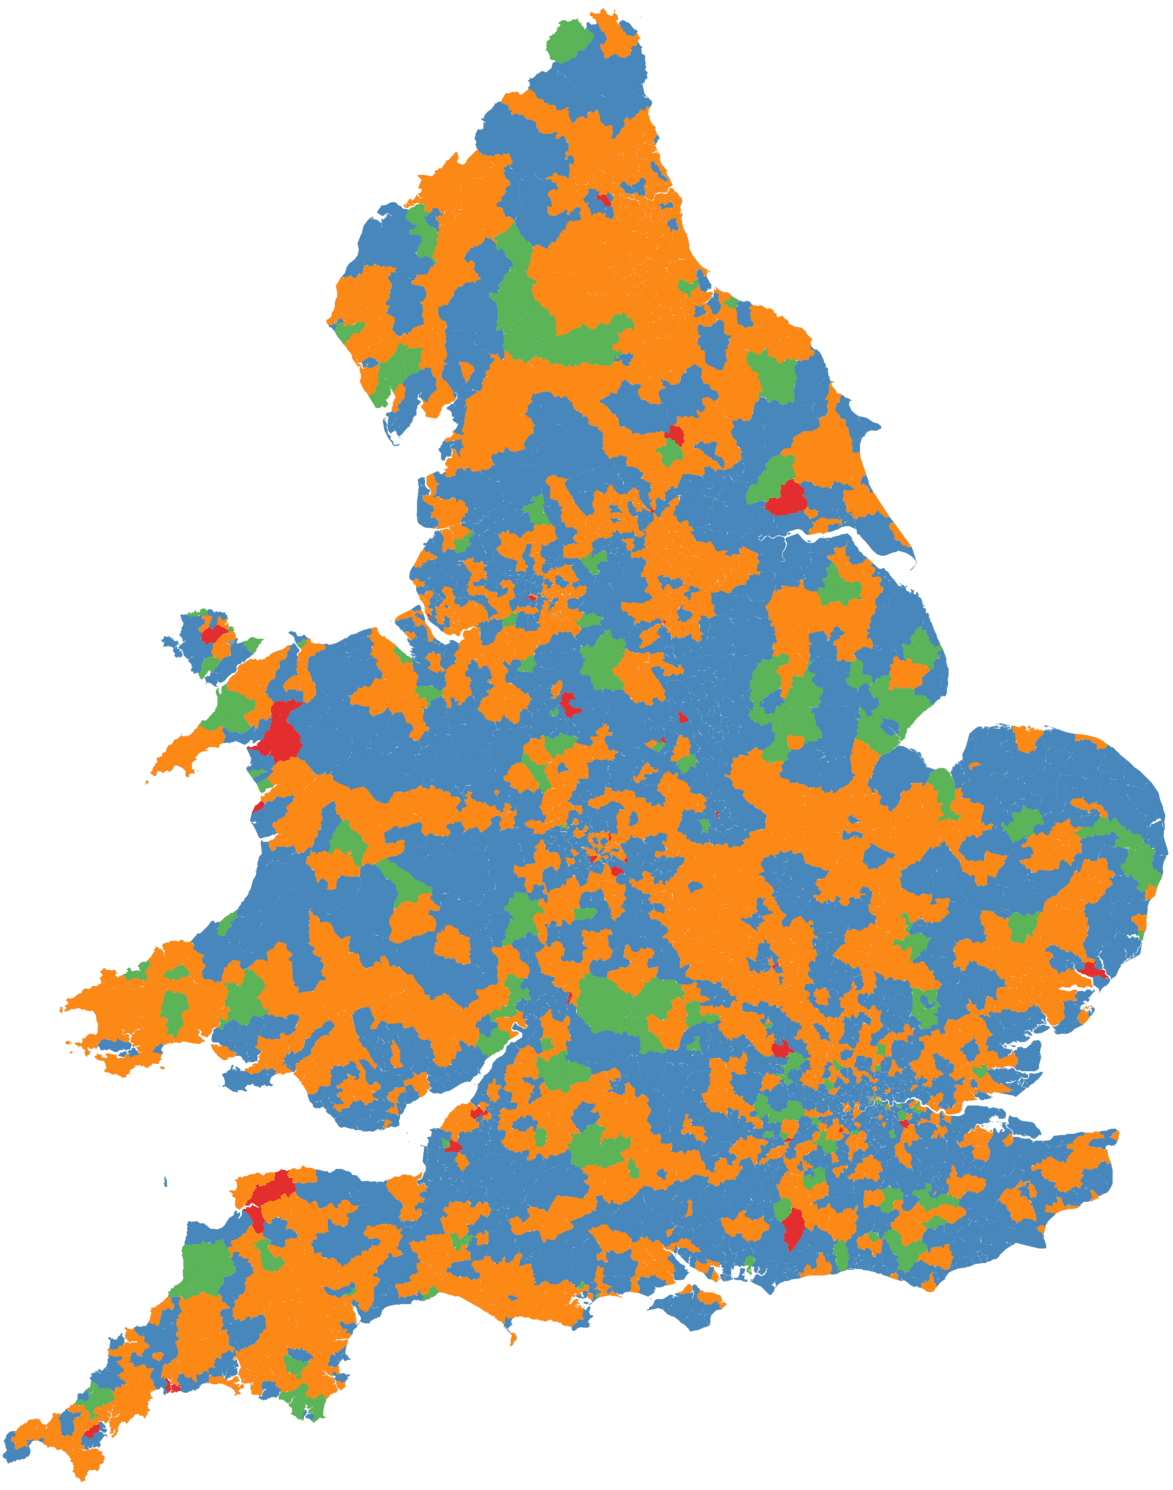
Violent crime low season
For every postcode district, the map shows a season with the lowest average of committed crimes in the period of six years, from September 2011 till August 2017.
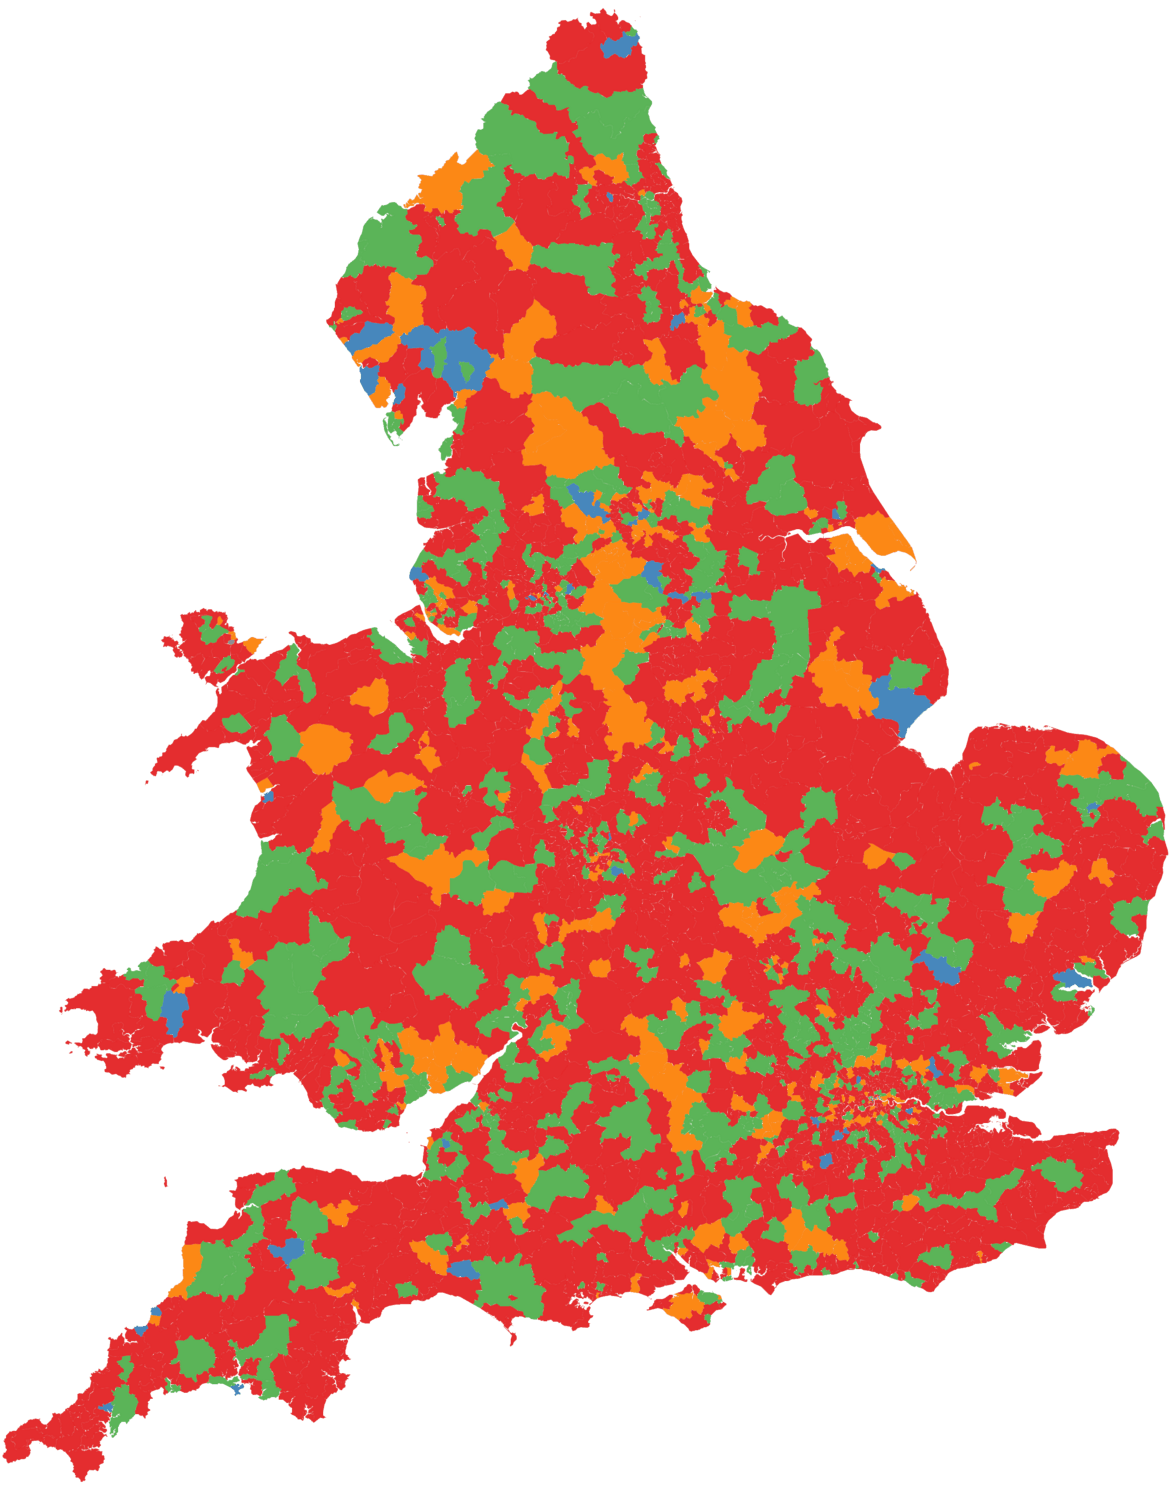
Violent crime high season
For every postcode district, the map shows a season with the highest average of committed crimes in the period of six years, from September 2011 till August 2017.
Month is the smallest time unit in the source data. Thus we took Winter as period of December, January and February. Spring = March - May, Summer = Jun - Aug, Autumn = Sep - Nov. Violent crime includes offences against the person such as common assaults, grievous bodily harm and sexual offences.