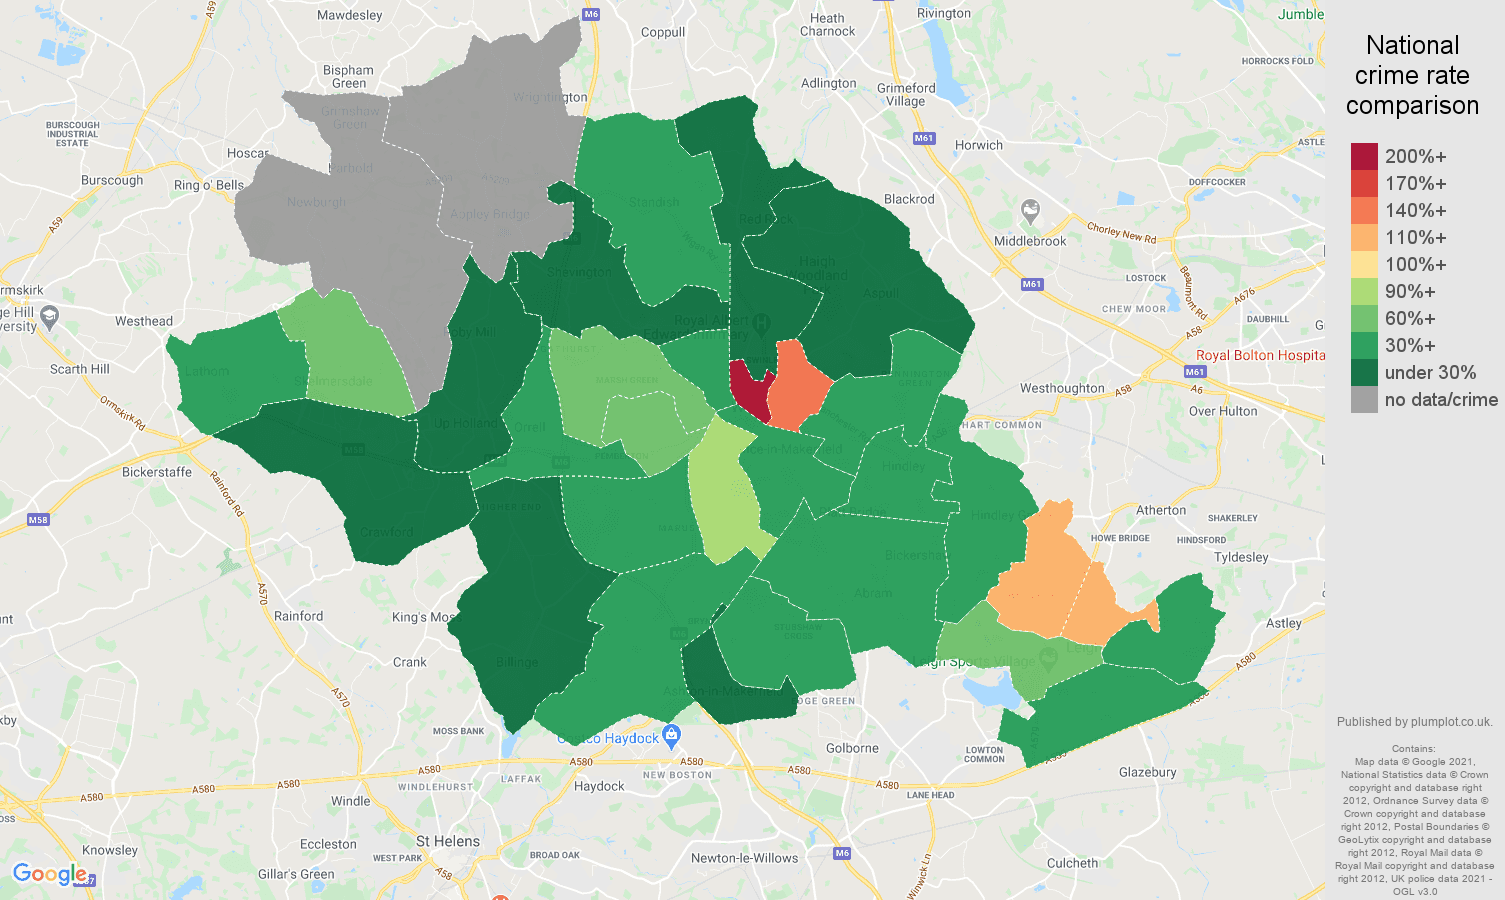
Annual crime rate in Wigan postcode area is 1, i.e. 1 crimes reported per annum per 1000 workday people. Compared to the national crime rate, Wigan's crime rate is at 59%. Bicycle theft crime makes up 0.8% of all crimes reported in the postcode area. The total number of "bicycle theft crime" is 285, and this number has decreased by 1.4% when compared year-over-year in the period of January 2018 - December 2018.
January 2018 - December 2018
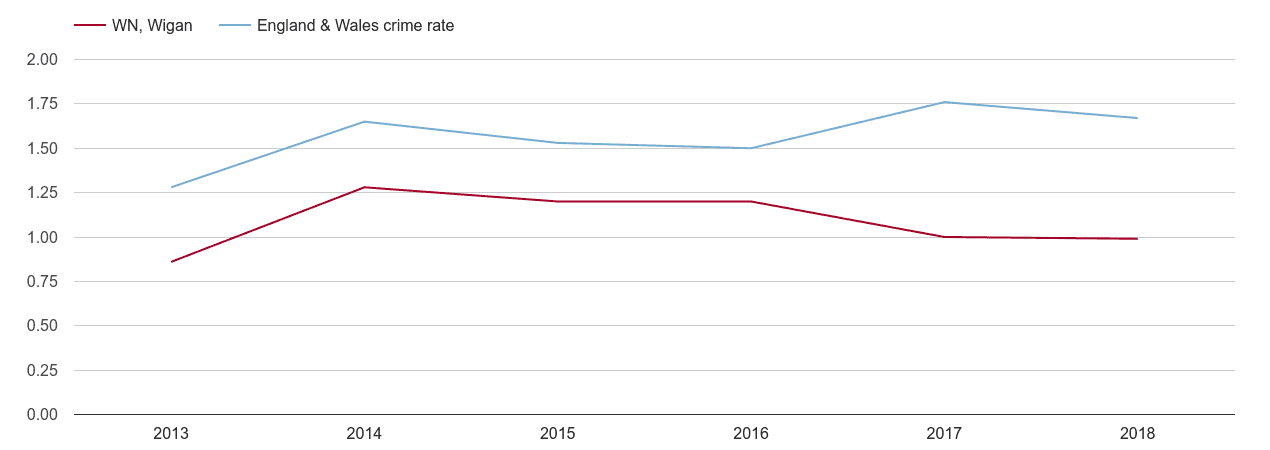
Bicycle theft crime rate is 1 crimes reported per 1,000 working people per annum. It's the 33. lowest crime rate out of 104 England and Wales' postcode areas.
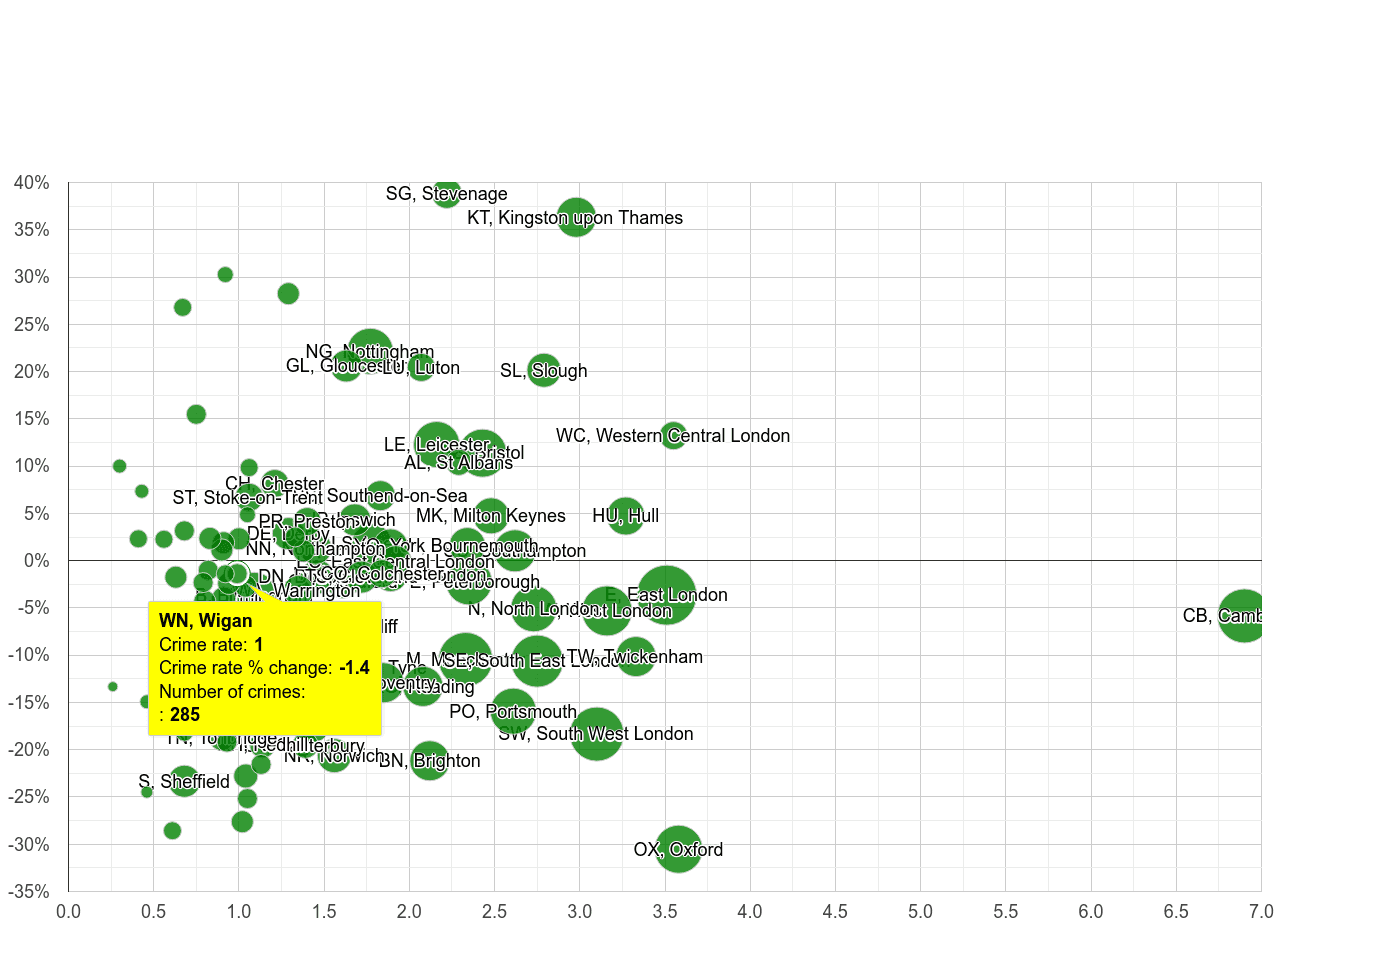
The total number of "bicycle theft crime" is 285, and this number has decreased by 1.4% when compared year-over-year in the period of January 2018 - December 2018. In the graph below, postcode area are compared by crime rate and crime rate percentage change. Crime rate percentage change compares the postcode area crime rate between January 2018 - December 2018 to the postcode area crime rate in the previous 12 months. The size of the circle reflects the number of total crimes reported. The bigger the circle, the higher the number of crimes reported in the postcode area.
 Crime rate percentage change
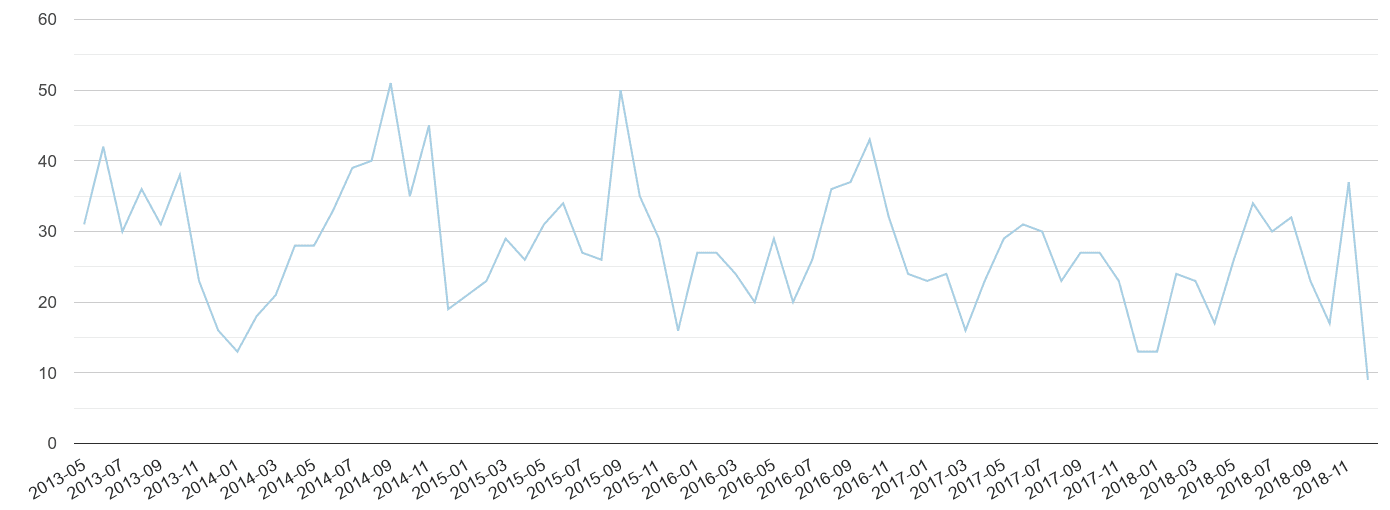
Monthly crime volumes till December 2018.
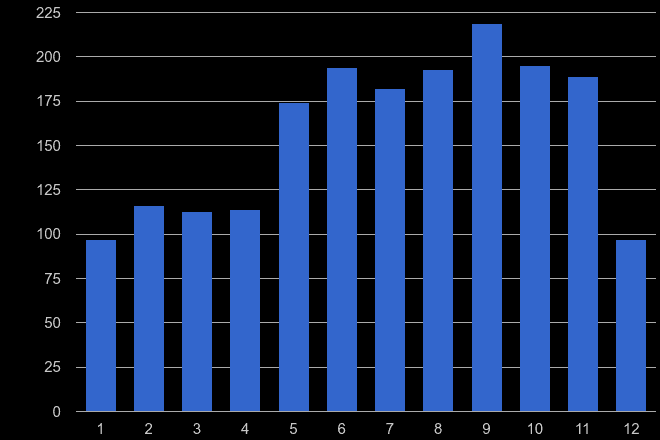
Annual crime rate per 1000 workday people
Total number of crimes reported in a given calendar month (1 = January … 12 = December) from 2011 till 2018.