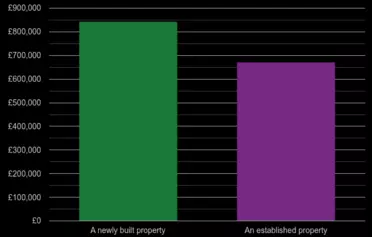
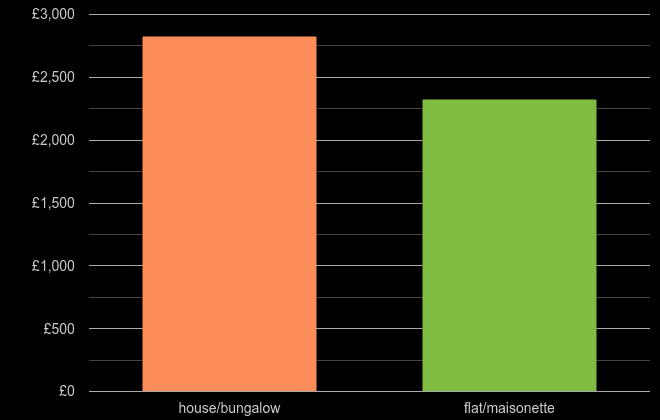
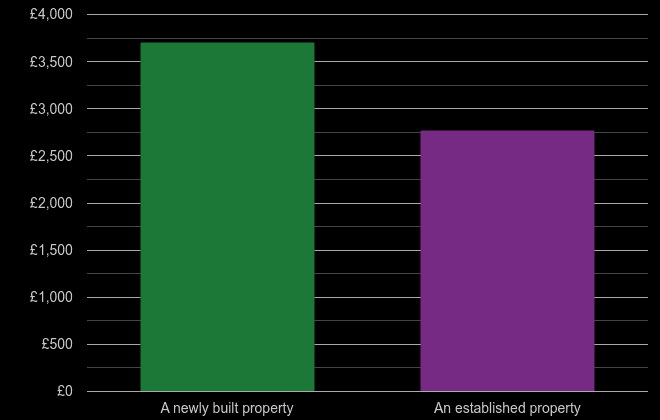
In West Midlands county county, the average price per square metre of a house is £2.9k, a flat is £2.4k, a newly build property is £3.8k and an older property is £2.9k.
June 2025 - May 2026
June 2025 - May 2026
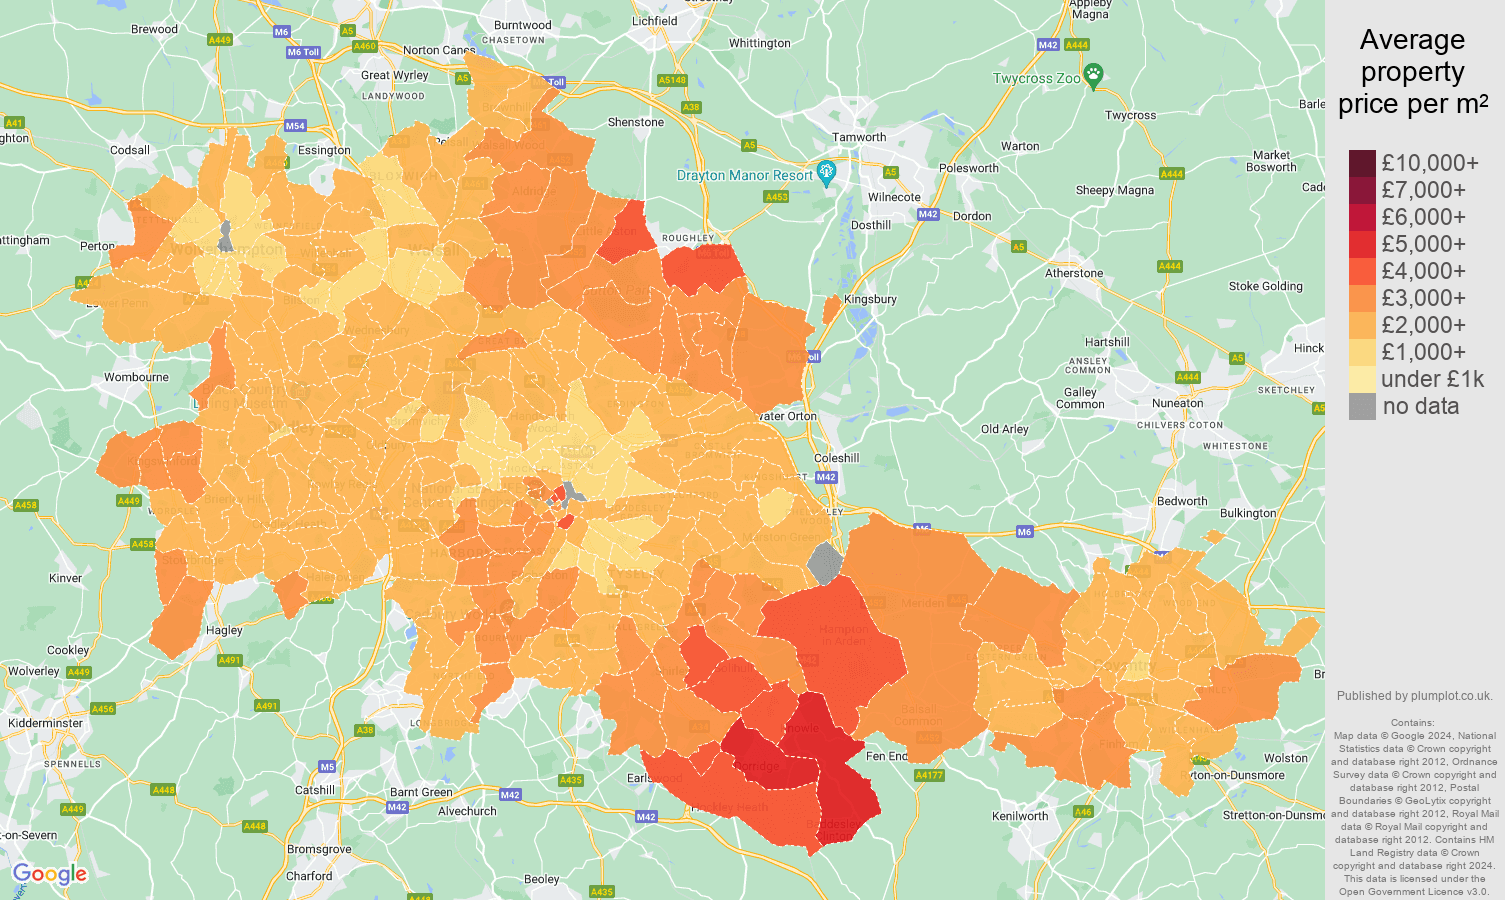
Comparison of the average property price per square metre and an average floor area size by county in the previous 12 months. The size of the circle shows the number of property transactions with known floor area size. The bigger the circle the higher the sales volumes in county.
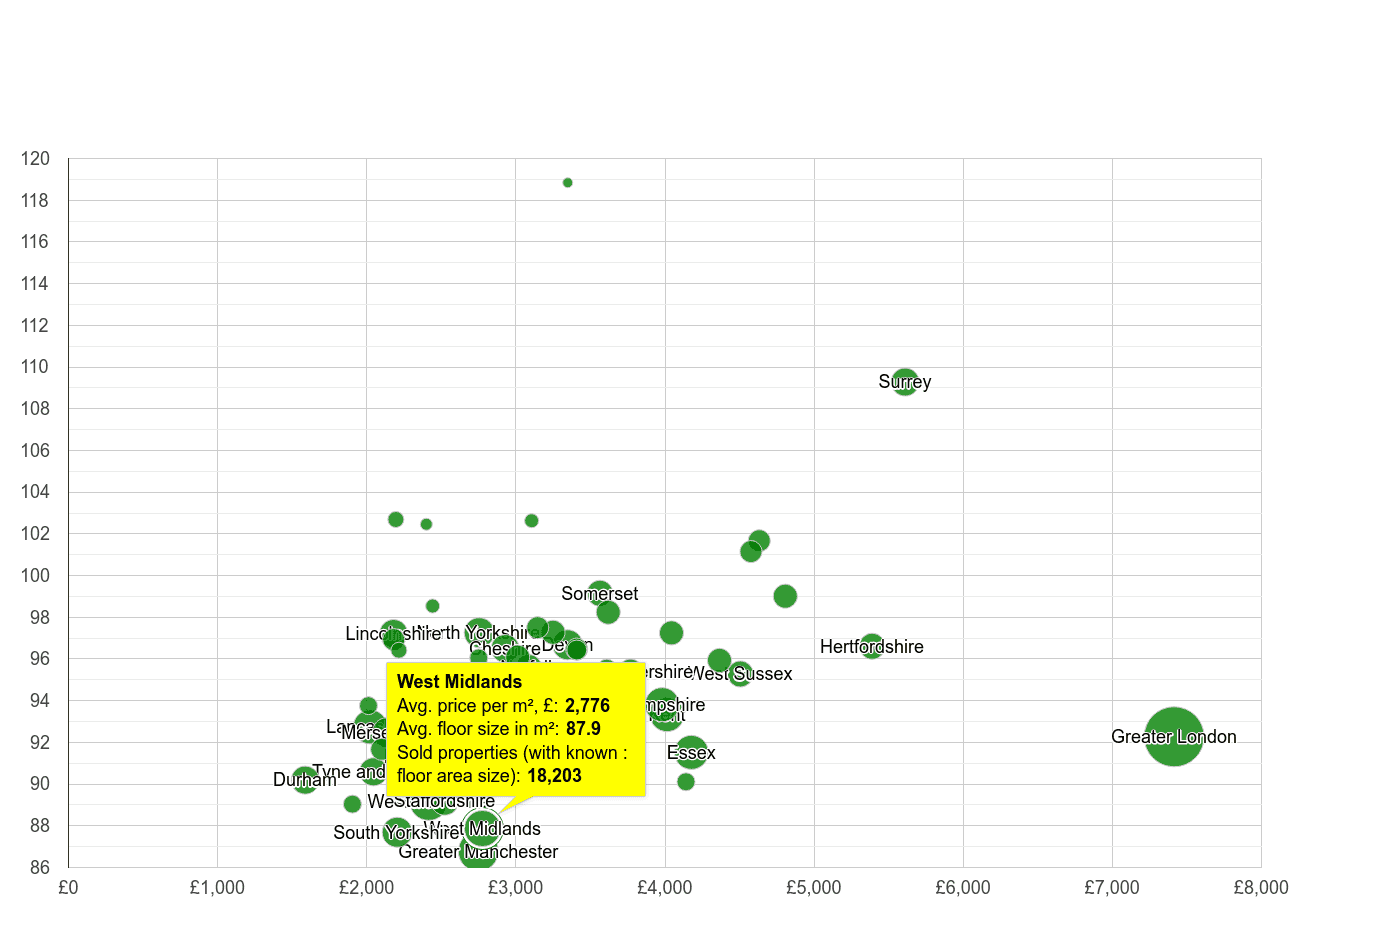 Average floor area size in square metre
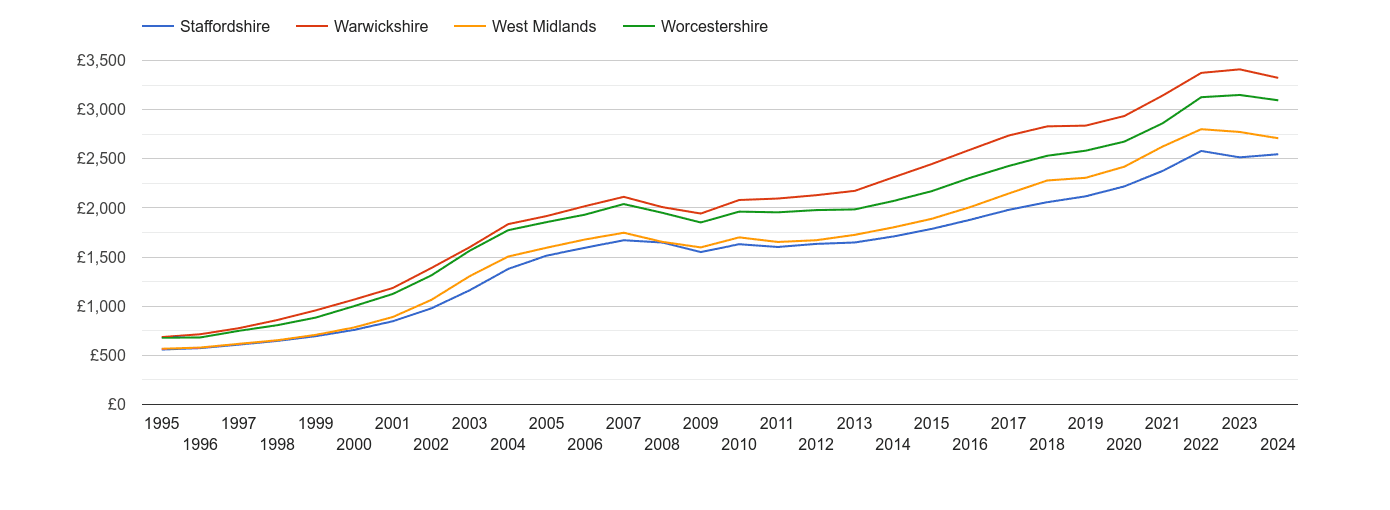
Yearly average nominal price per square metre compared to England & Wales' house prices
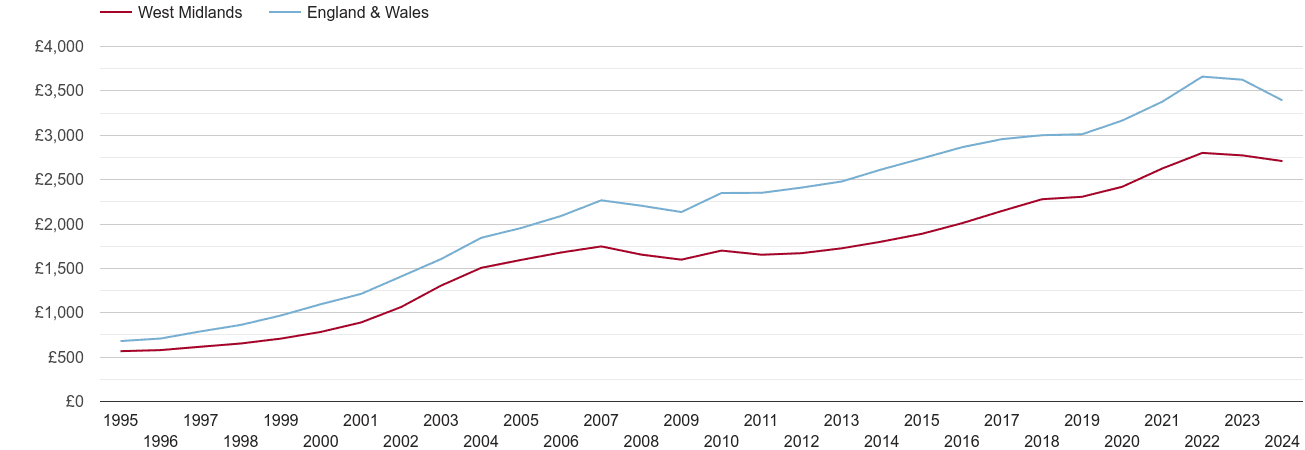
| Nominal average price per m2 | ||
|---|---|---|
| Year | West Midlands county county | England & Wales |
| 2025 | £2.9k | £3.6k |
| 2024 | £2.8k | £3.6k |
| 2023 | £2.8k | £3.6k |
| 2022 | £2.8k | £3.7k |
| 2021 | £2.6k | £3.4k |
| 2020 | £2.4k | £3.2k |
| 2019 | £2.3k | £3.0k |
| 2018 | £2.3k | £3.0k |
| 2017 | £2.1k | £3.0k |
| 2016 | £2.0k | £2.9k |
| 2015 | £1.9k | £2.7k |
| 2014 | £1.8k | £2.6k |
| 2013 | £1.7k | £2.5k |
| 2012 | £1.7k | £2.4k |
| 2011 | £1.6k | £2.3k |
| 2010 | £1.7k | £2.3k |
| 2009 | £1.6k | £2.1k |
| 2008 | £1.7k | £2.2k |
| 2007 | £1.7k | £2.3k |
| 2006 | £1.7k | £2.1k |
| 2005 | £1.6k | £2.0k |
| 2004 | £1.5k | £1.8k |
| 2003 | £1.3k | £1.6k |
| 2002 | £1.1k | £1.4k |
| 2001 | £891 | £1.2k |
| 2000 | £784 | £1.1k |
| 1999 | £709 | £968 |
| 1998 | £654 | £863 |
| 1997 | £617 | £790 |
| 1996 | £579 | £710 |
| 1995 | £567 | £681 |
Yearly average nominal prices


 login →