| Population Estimates, 2024 | Swindon postcode area | England + Wales |
|---|---|---|
| Total residents | 525k | 0.9% of Eng+Wls |
| Average age | 42 | 40.8 |
| Population density | 238 | 409 |
shows a number of residents per square kilometer(km2), estimates from 2020.

Population average age by LSOA (County) in 2018.

Total population per year outlines headcount differences.

| Year | Total population | CAGR | CAGR ENG+WLS |
|---|---|---|---|
| 2024 | 525k | 1.08% | 0.74% |
| 2023 | 519k | 1.08% | 0.72% |
| 2022 | 513k | 1.07% | 0.68% |
| 2021 | 508k | 1.07% | 0.66% |
| 2020 | 503k | 1.08% | 0.68% |
| 2019 | 501k | 1.12% | 0.71% |
| 2018 | 497k | 1.14% | 0.72% |
| 2017 | 494k | 1.17% | 0.73% |
| 2016 | 488k | 1.18% | 0.75% |
| 2015 | 483k | 1.18% | 0.74% |
| 2014 | 477k | 1.18% | 0.74% |
| 2013 | 472k | 1.19% | 0.73% |
| 2012 | 467k | 1.21% | 0.73% |
| 2011 | 462k | 1.22% | 0.73% |
| 2010 | 457k | 1.23% | 0.72% |
| 2009 | 453k | 1.27% | 0.70% |
| 2008 | 449k | 1.32% | 0.70% |
| 2007 | 441k | 1.25% | 0.67% |
| 2006 | 434k | 1.12% | 0.63% |
| 2005 | 429k | 1.11% | 0.61% |
| 2004 | 422k | 0.95% | 0.52% |
| 2003 | 419k | 1.11% | 0.50% |
| 2002 | 415k | - | - |
shows the distribution of various age groups in a population in 2024. Females are shown on the left, males are shown on the right.

Shares of population age groups compared to corresponding shares of population groups in England & Wales, 2024.

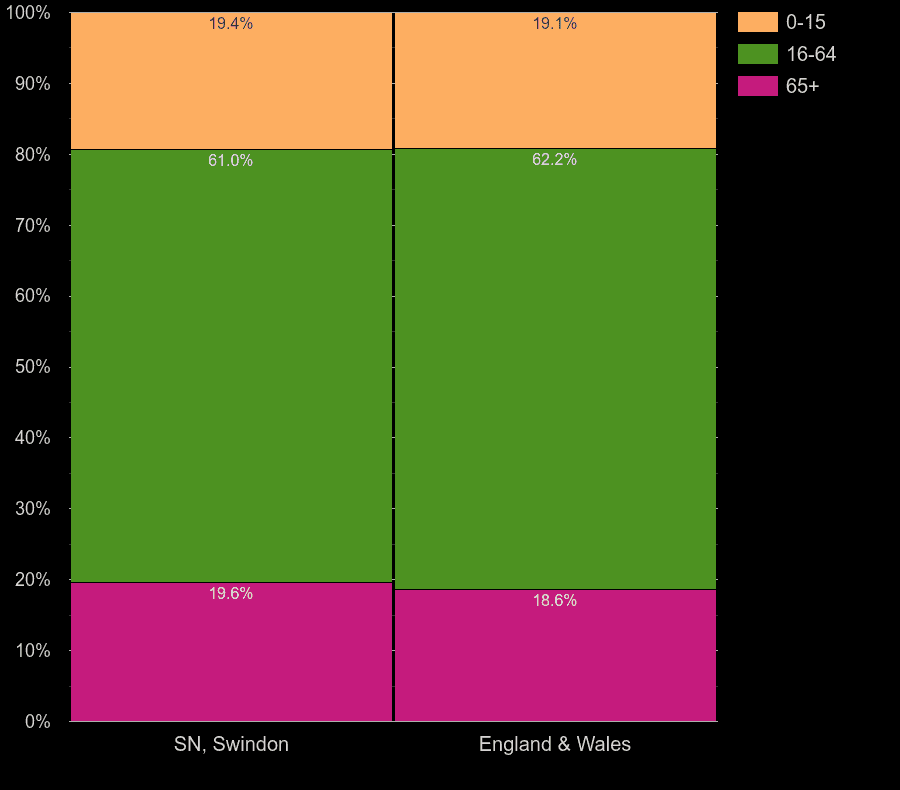
| age group | head-count | % share of population | % for Eng & Wales |
|---|---|---|---|
| 0-15 | 96.6k | 18.4% | 18.3% |
| 16-64 | 324k | 61.6% | 62.8% |
| 65+ | 105k | 20.0% | 18.9% |
Comparison of postcode areas average ages, 2024 population estimates.

| postcode area | Average age in 2024 |
|---|---|
| Swindon | 42 |
| England & Wales | 40.8 |
Annual area statistics of Swindon's population average age compared to country statistics.

| Year | Swindon postcode area | England and Wales |
|---|---|---|
| 2024 | 42.0 | 40.8 |
| 2023 | 41.8 | 40.7 |
| 2022 | 41.8 | 40.7 |
| 2021 | 41.6 | 40.7 |
| 2020 | 41.4 | 40.5 |
| 2019 | 41.2 | 40.4 |
| 2018 | 40.9 | 40.2 |
| 2017 | 40.7 | 40.1 |
| 2016 | 40.5 | 39.9 |
| 2015 | 40.4 | 39.8 |
| 2014 | 40.2 | 39.7 |
| 2013 | 40.0 | 39.6 |
| 2012 | 39.8 | 39.5 |
| 2011 | 39.6 | 39.4 |
| 2010 | 39.5 | 39.3 |
| 2009 | 39.3 | 39.2 |
| 2008 | 39.1 | 39.2 |
| 2007 | 39.0 | 39.1 |
| 2006 | 38.9 | 39.0 |
| 2005 | 38.7 | 39.0 |
| 2004 | 38.6 | 38.9 |
| 2003 | 38.4 | 38.8 |
| 2002 | 38.3 | 38.7 |
Purple-colored areas are business or industrial areas. Green-colored areas provide quieter surroundings and better living. Map is based on a UK Census 2011 data. Colors calculated from the ratio of number of residents divided by a number of workday people.

 login →