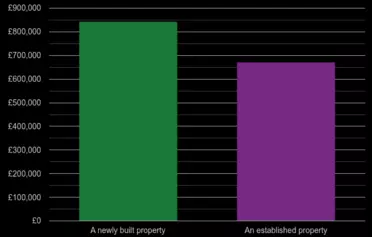
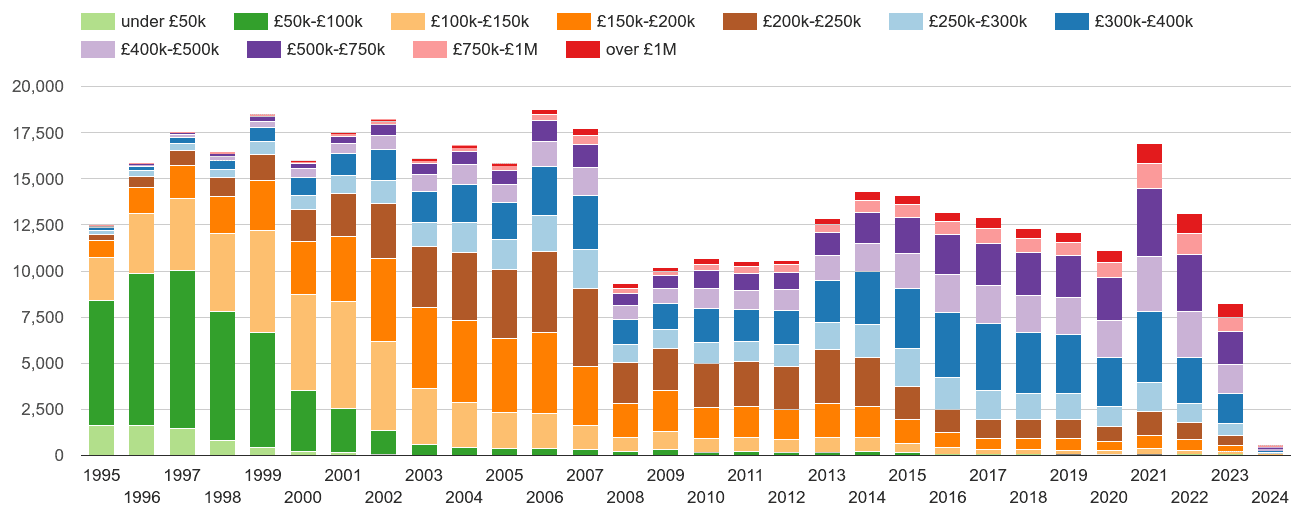
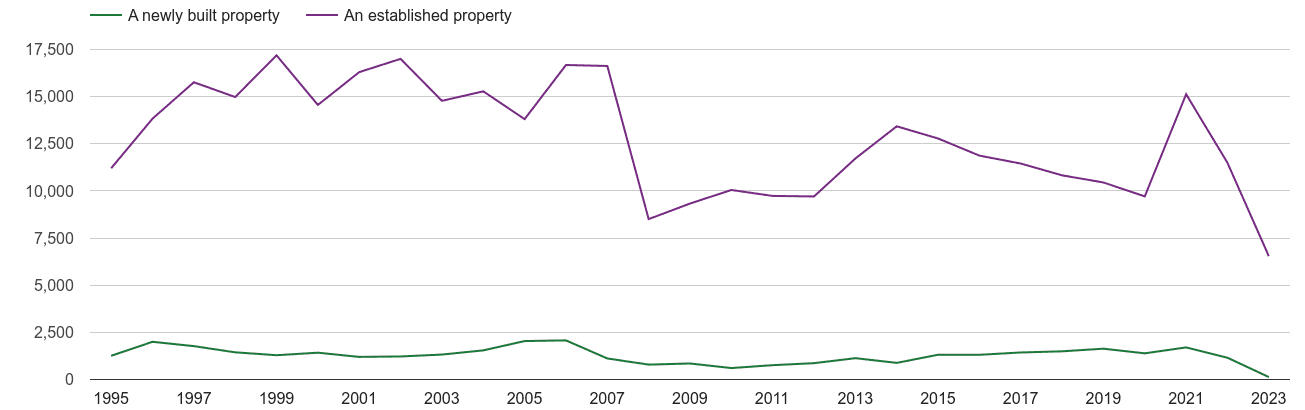
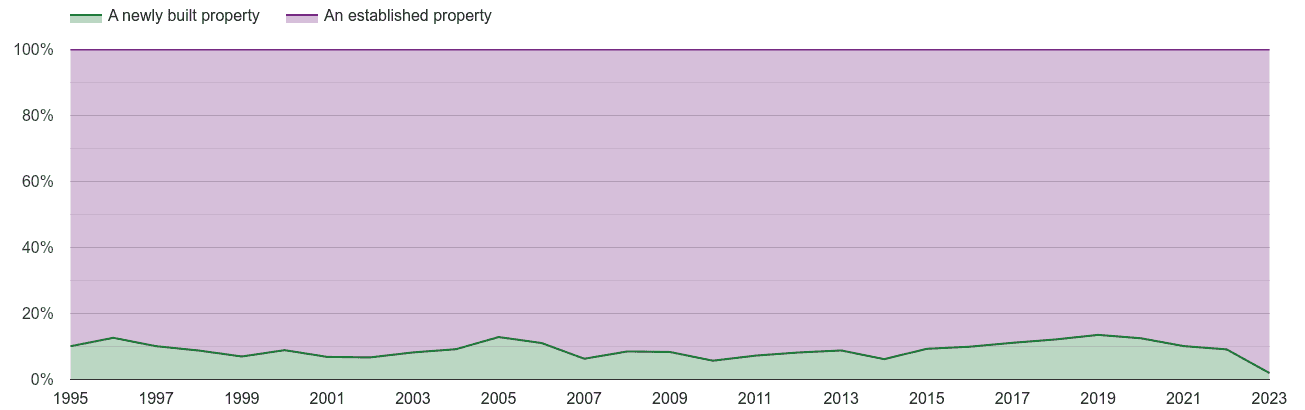
There were 9.3k property sales in Guildford postcode area in the previous 12 months and sales dropped by 18.6% (-2.3k transactions). 208 properties, 2.2% were sales of a newly built property. Most homes were sold in the £500k-£750k price range with 2205 (23.7%) properties sold, followed by £400k-£500k price range with 1870 (20.1%) properties sold.
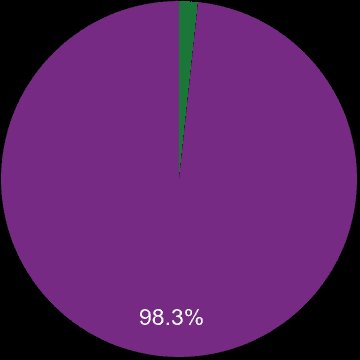
| New or established | Percentage share | Sales volume |
|---|---|---|
| █ A newly built property | 2.2% | 208 |
| █ An established property | 97.8% | 9.1k |
| All properties | 100% | 9.3k |
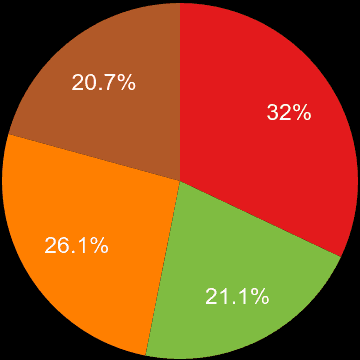
| House Type | Percentage share | Sales volume |
|---|---|---|
| █ Detached | 30.5% | 2.8k |
| █ Flat | 20.7% | 1.9k |
| █ Semi-Detached | 27.3% | 2.5k |
| █ Terraced | 21.5% | 2.0k |
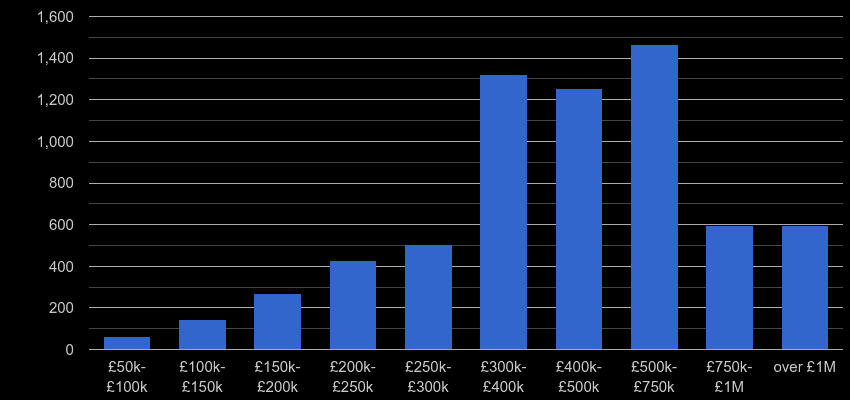
| Property price range | Market share | Sales volume |
|---|---|---|
| £50k-£100k | 0.9% | 84 |
| £100k-£150k | 2.0% | 185 |
| £150k-£200k | 4.8% | 445 |
| £200k-£250k | 6.5% | 609 |
| £250k-£300k | 6.8% | 637 |
| £300k-£400k | 19.4% | 1.8k |
| £400k-£500k | 20.1% | 1.9k |
| £500k-£750k | 23.7% | 2.2k |
| £750k-£1M | 8.9% | 832 |
| over £1M | 6.8% | 633 |
Yearly property sales volume by nominal price ranges
Total sales volume by year
Market share by year
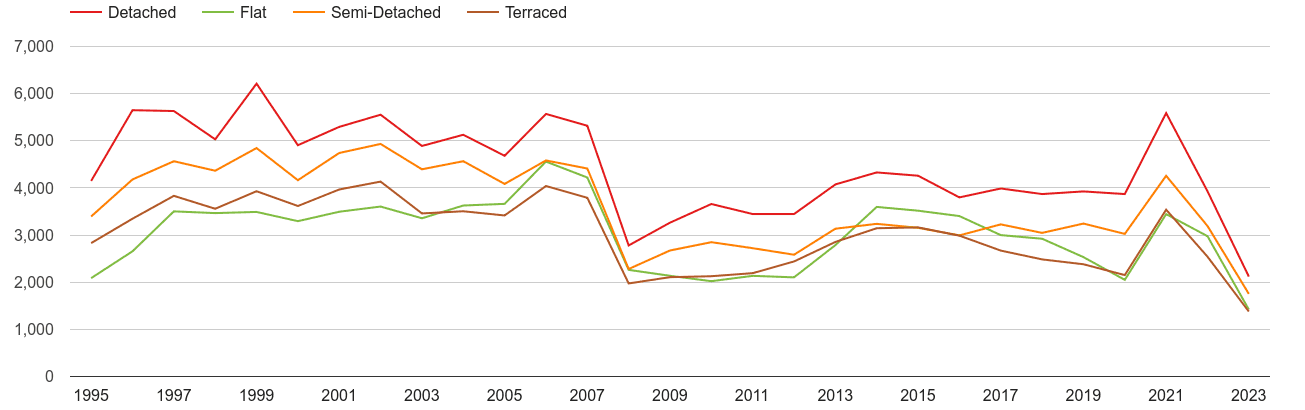
Total sales volumes by year
Market share by year
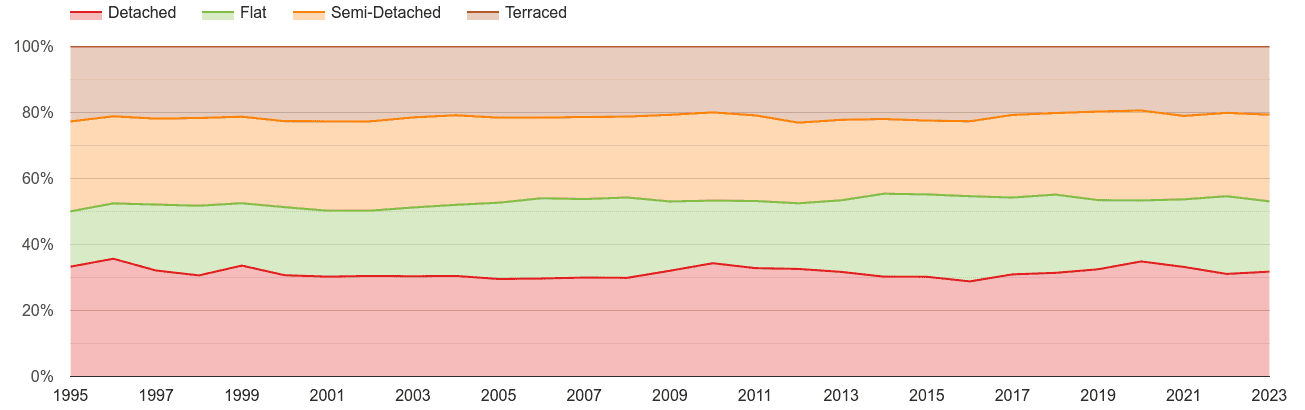
| Year | Flat | Detached | Semi-Detached | Terraced | Total sales |
|---|---|---|---|---|---|
| 2026 | 1.3k (21.2%) | 1.8k (30.1%) | 1.6k (27.2%) | 1.3k (21.5%) | 6.0k |
| 2025 | 2.6k (20.5%) | 4.0k (32.0%) | 3.3k (26.8%) | 2.6k (20.6%) | 12.4k |
| 2024 | 2.5k (22.1%) | 3.6k (31.6%) | 2.9k (25.8%) | 2.3k (20.5%) | 11.3k |
| 2023 | 2.5k (23.6%) | 3.3k (30.7%) | 2.7k (25.5%) | 2.1k (20.2%) | 10.6k |
| 2022 | 3.5k (25.2%) | 4.2k (30.5%) | 3.4k (24.6%) | 2.7k (19.7%) | 13.9k |
| 2021 | 3.6k (20.8%) | 5.7k (33.1%) | 4.3k (25.2%) | 3.6k (20.9%) | 17.1k |
| 2020 | 2.1k (18.6%) | 3.9k (34.8%) | 3.0k (27.2%) | 2.2k (19.4%) | 11.2k |
| 2019 | 2.5k (21.0%) | 3.9k (32.5%) | 3.2k (26.8%) | 2.4k (19.7%) | 12.1k |
| 2018 | 2.9k (23.9%) | 3.9k (31.3%) | 3.0k (24.7%) | 2.5k (20.1%) | 12.3k |
| 2017 | 3.0k (23.3%) | 4.0k (31.0%) | 3.2k (25.0%) | 2.7k (20.7%) | 12.9k |
| 2016 | 3.4k (25.8%) | 3.8k (28.8%) | 3.0k (22.7%) | 3.0k (22.7%) | 13.2k |
| 2015 | 3.5k (25.0%) | 4.3k (30.2%) | 3.2k (22.4%) | 3.2k (22.4%) | 14.1k |
| 2014 | 3.6k (25.1%) | 4.3k (30.2%) | 3.2k (22.6%) | 3.1k (22.0%) | 14.3k |
| 2013 | 2.8k (21.7%) | 4.1k (31.7%) | 3.1k (24.4%) | 2.9k (22.2%) | 12.9k |
| 2012 | 2.1k (19.9%) | 3.4k (32.6%) | 2.6k (24.4%) | 2.4k (23.1%) | 10.6k |
| 2011 | 2.1k (20.3%) | 3.4k (32.8%) | 2.7k (26.0%) | 2.2k (20.9%) | 10.5k |
| 2010 | 2.0k (19.0%) | 3.7k (34.3%) | 2.9k (26.7%) | 2.1k (20.0%) | 10.7k |
| 2009 | 2.1k (21.0%) | 3.3k (32.1%) | 2.7k (26.3%) | 2.1k (20.7%) | 10.2k |
| 2008 | 2.3k (24.4%) | 2.8k (29.9%) | 2.3k (24.5%) | 2.0k (21.2%) | 9.3k |
| 2007 | 4.2k (23.8%) | 5.3k (30.0%) | 4.4k (24.8%) | 3.8k (21.4%) | 17.7k |
| 2006 | 4.6k (24.4%) | 5.6k (29.7%) | 4.6k (24.4%) | 4.0k (21.5%) | 18.8k |
| 2005 | 3.7k (23.1%) | 4.7k (29.6%) | 4.1k (25.8%) | 3.4k (21.5%) | 15.8k |
| 2004 | 3.6k (21.6%) | 5.1k (30.5%) | 4.6k (27.1%) | 3.5k (20.8%) | 16.8k |
| 2003 | 3.4k (20.9%) | 4.9k (30.4%) | 4.4k (27.3%) | 3.5k (21.5%) | 16.1k |
| 2002 | 3.6k (19.8%) | 5.6k (30.5%) | 4.9k (27.0%) | 4.1k (22.7%) | 18.2k |
| 2001 | 3.5k (20.1%) | 5.3k (30.2%) | 4.7k (27.0%) | 4.0k (22.6%) | 17.5k |
| 2000 | 3.3k (20.6%) | 4.9k (30.7%) | 4.2k (26.0%) | 3.6k (22.6%) | 16.0k |
| 1999 | 3.5k (18.9%) | 6.2k (33.6%) | 4.8k (26.2%) | 3.9k (21.3%) | 18.5k |
| 1998 | 3.5k (21.2%) | 5.0k (30.6%) | 4.4k (26.5%) | 3.6k (21.6%) | 16.4k |
| 1997 | 3.5k (20.0%) | 5.6k (32.1%) | 4.6k (26.0%) | 3.8k (21.9%) | 17.5k |
| 1996 | 2.7k (16.8%) | 5.6k (35.7%) | 4.2k (26.4%) | 3.3k (21.1%) | 15.8k |
| 1995 | 2.1k (16.8%) | 4.1k (33.3%) | 3.4k (27.2%) | 2.8k (22.7%) | 12.5k |
shows the total volume of new properties sold a given postcode sector.
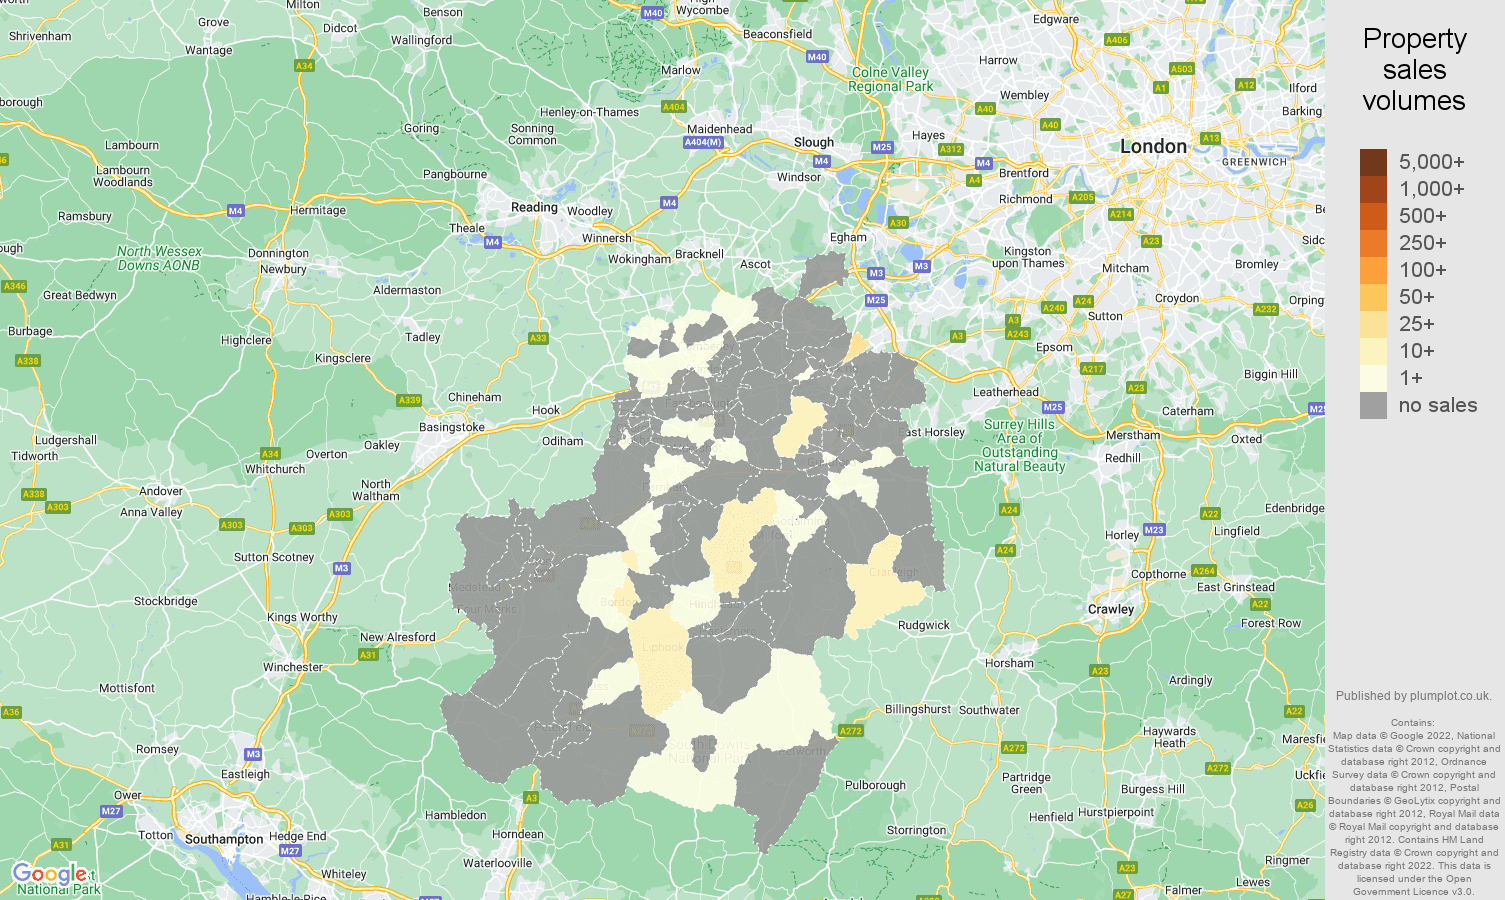
| Postcode sector | Sales volume | Market share | |
|---|---|---|---|
 login →