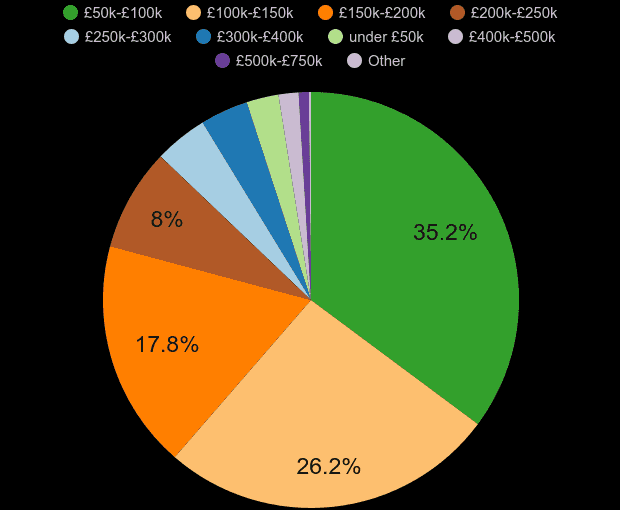
The average property price in Darlington city is £158k, the median price is £135k. The average price declined by -£2.5k (-2%) over the last twelve months. The price of an established property is £157k. The price of a newly built property is £251k. There were 1.4k property sales and sales dropped by 14.9% (-257 transactions). Most properties were sold in the £50k-£100k price range with 396 (29.2%) properties sold, followed by £100k-£150k price range with 384 (28.3%) properties sold.
Current residential property prices
July 2025 - June 2026
Darlington city
England & Wales
Average price
█ £158k
█ £350k
Median price
█ £135k
█ £280k
Darlington property sales share by price range
shows a number of properties sold in a given price range between July 2025 - June 2026.
Market Analysis of Sales Volume and Share by Property Price Range
Property price range
Market share
Sales volume
█ under £50k
2.1%
28
█ £50k-£100k
29.2%
396
█ £100k-£150k
28.3%
384
█ £150k-£200k
18.1%
245
█ £200k-£250k
9.4%
127
█ £250k-£300k
6.3%
86
█ £300k-£400k
4.1%
56
█ £400k-£500k
1.3%
17
█ £500k-£750k
1.0%
13
█ £750k-£1M
0.1%
2
█ over £1M
0.1%
2
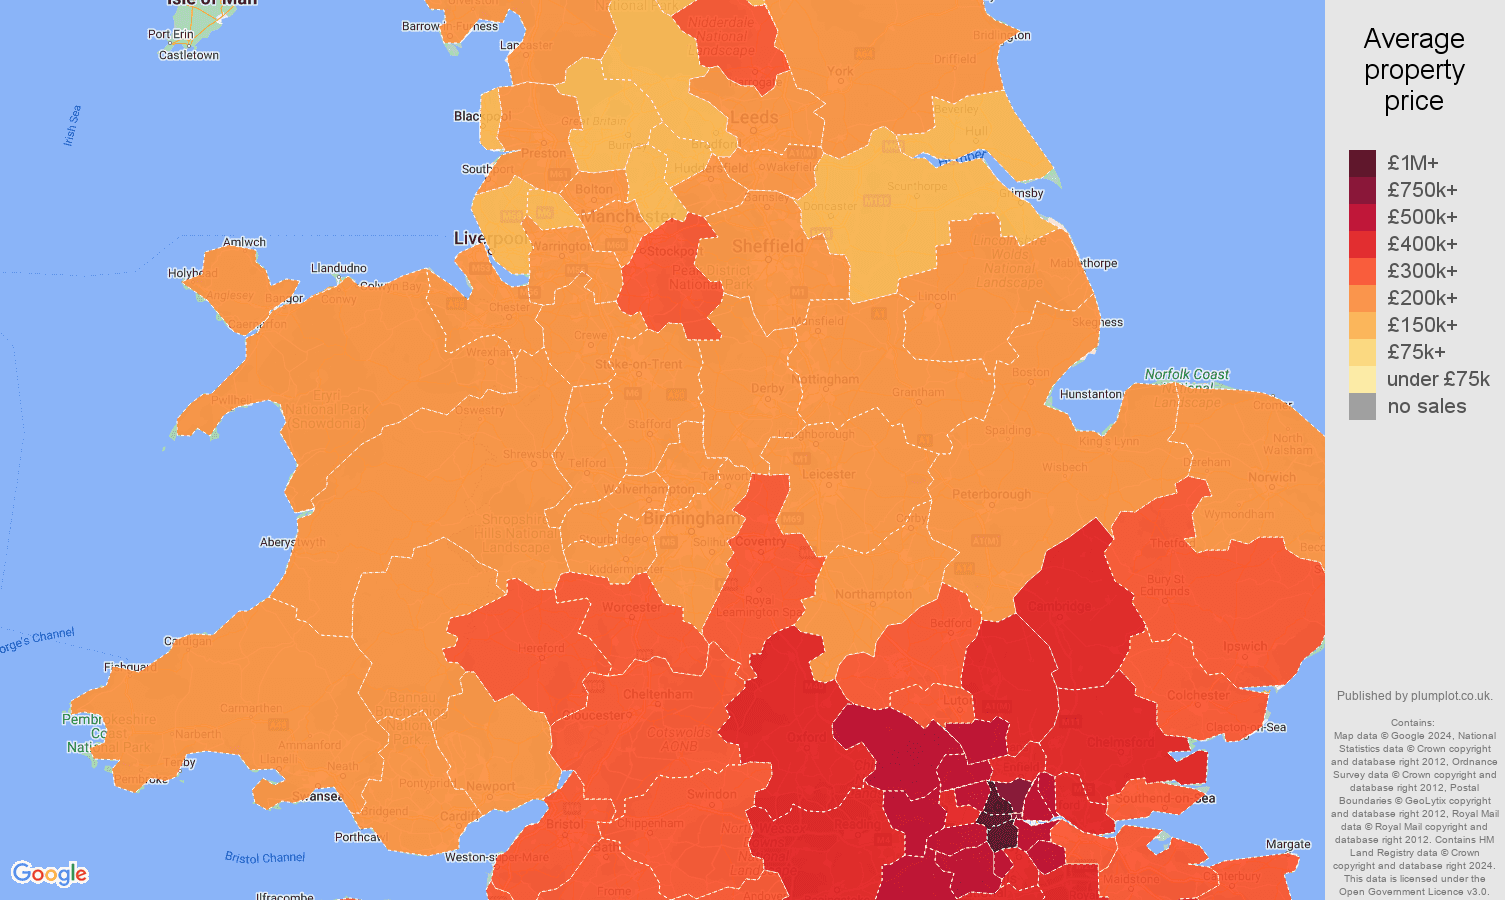
Darlington house prices map
This price map shows the average property price in a given postcode sector. The most affordable place is 'DL3 6' with the average price of £96.8k. The most expensive place is 'DL3 8', £312k.
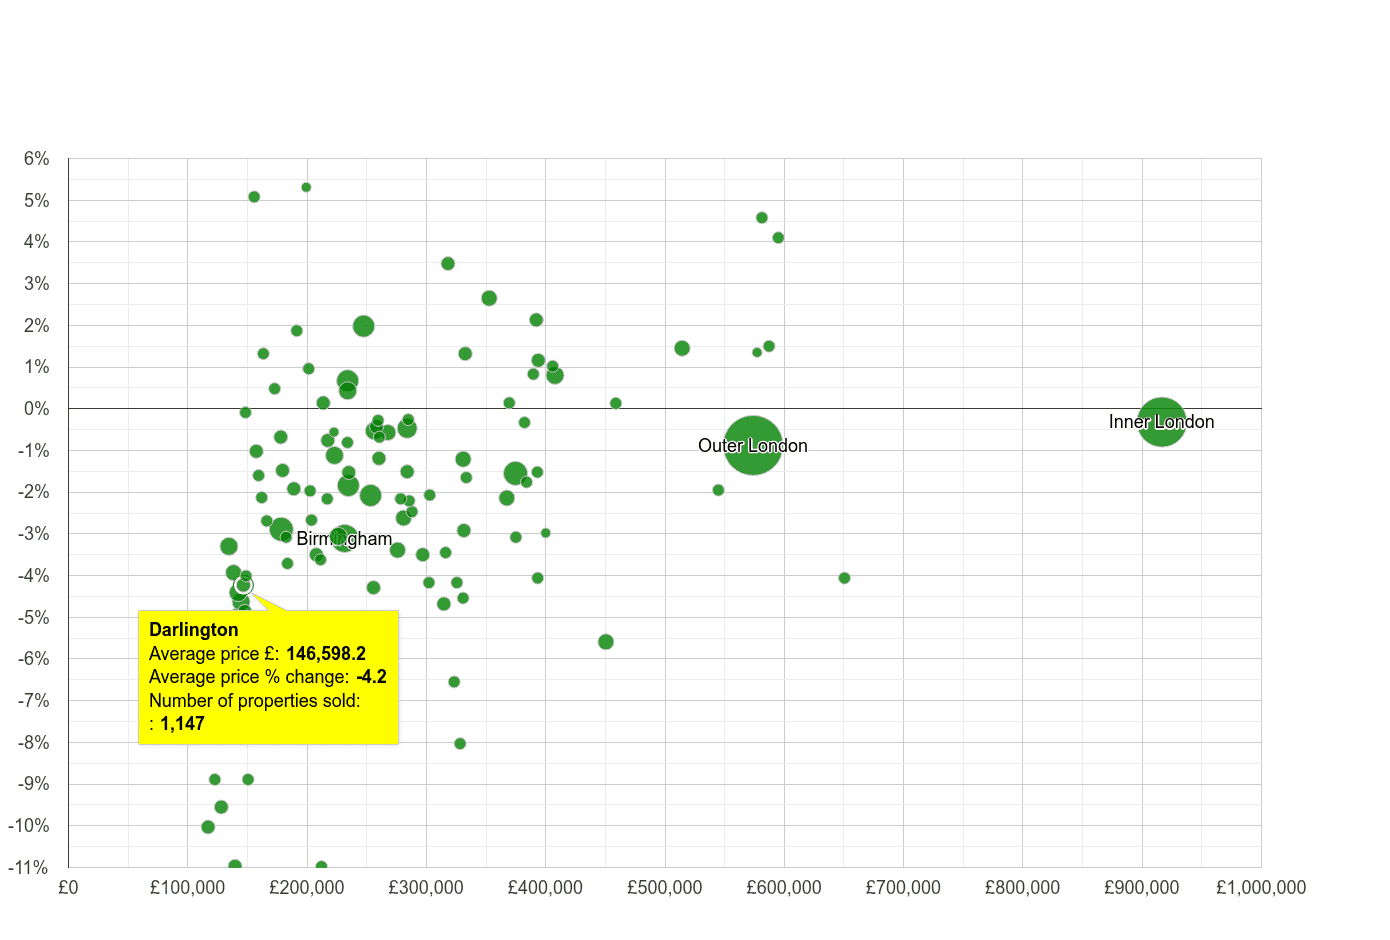
Darlington house prices compared to other cities
Comparison of the average property price and an average price percentage change by city. Price % change compares the average property price between July 2025 - June 2026 to the average price in the previous 12 months. The size of the circle shows the number of property transactions. The bigger the circle the higher the sales volumes in city.
Average price percentage changeAverage property price
Darlington house price rank
With the average price of £158k, Darlington is the 11. cheapest city out of 113 England and Wales' cities.
Ranking of city by Average House Price
Rank
city
Average price
1.
Inner London
£799k
2.
St Albans
£665k
3.
Cambridge
£578k
4.
Oxford
£562k
5.
Guildford
£561k
6.
Outer London
£560k
7.
Bath
£549k
8.
Woking
£512k
9.
Brighton and Hove
£489k
10.
Watford
£476k
...
103.
Darlington
£158k
104.
Stockton-on-Tees
£157k
105.
Scunthorpe
£155k
106.
Sunderland
£153k
107.
Middlesbrough
£152k
108.
Kingston upon Hull
£152k
109.
Stoke-on-Trent
£152k
110.
Blackpool
£149k
111.
Burnley
£141k
112.
Grimsby
£139k
113.
Hartlepool
£135k
Plumplot area insights - interactive charts and maps
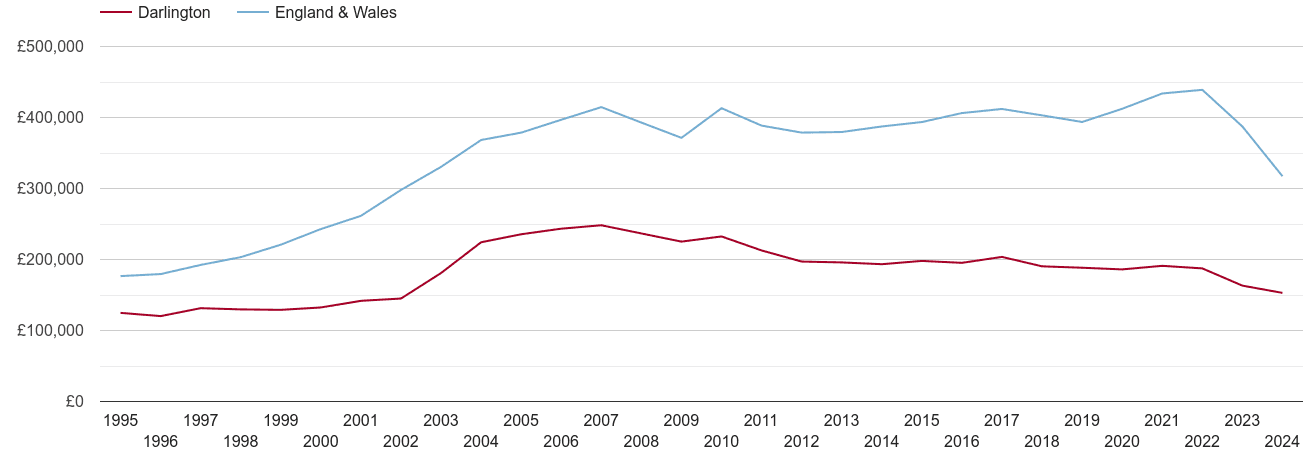
Darlington real house prices
Yearly average nominal house prices adjusted for inflation.
Yearly Real Average House Prices for Darlington city
Year
Darlington city
England & Wales
2025
£163k
£358k
2024
£160k
£372k
2023
£173k
£407k
2022
£196k
£458k
2021
£199k
£451k
2020
£193k
£428k
2019
£194k
£406k
2018
£197k
£418k
2017
£211k
£427k
2016
£202k
£420k
2015
£205k
£407k
2014
£200k
£400k
2013
£204k
£394k
2012
£205k
£393k
2011
£220k
£403k
2010
£240k
£427k
2009
£233k
£384k
2008
£246k
£408k
2007
£257k
£430k
2006
£252k
£411k
2005
£244k
£392k
2004
£233k
£383k
2003
£188k
£343k
2002
£150k
£309k
2001
£147k
£271k
2000
£138k
£253k
1999
£134k
£229k
1998
£134k
£210k
1997
£136k
£199k
1996
£125k
£186k
1995
£129k
£183k
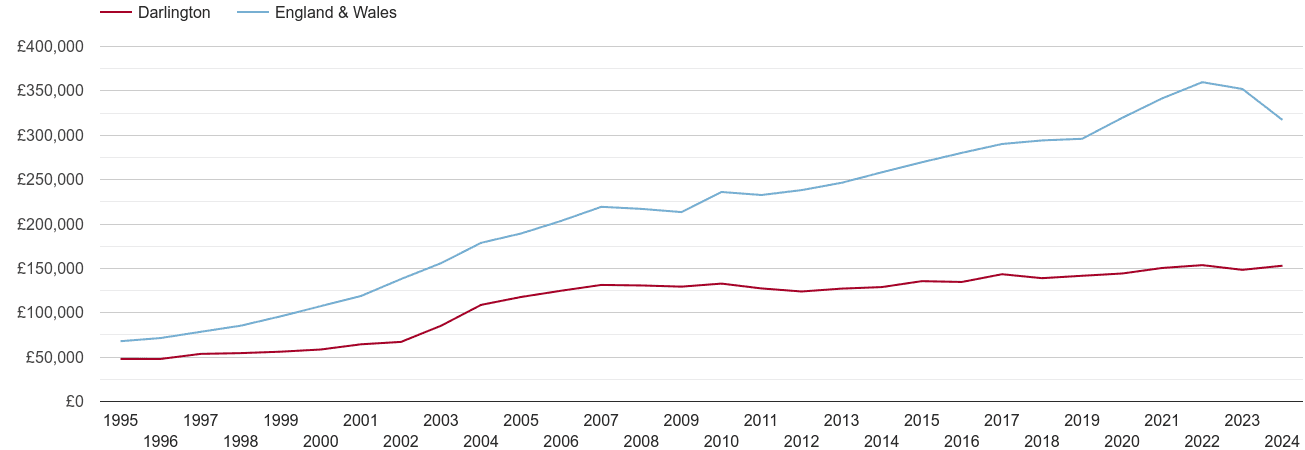
Darlington house prices
Yearly average nominal prices compared to England & Wales' house prices
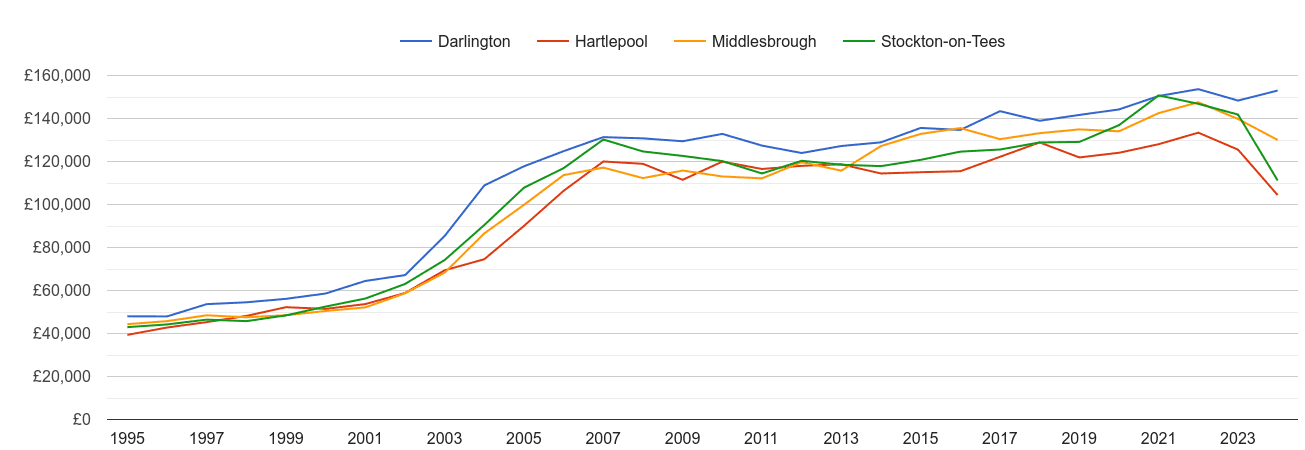
Darlington house prices and nearby cities
Yearly average nominal prices
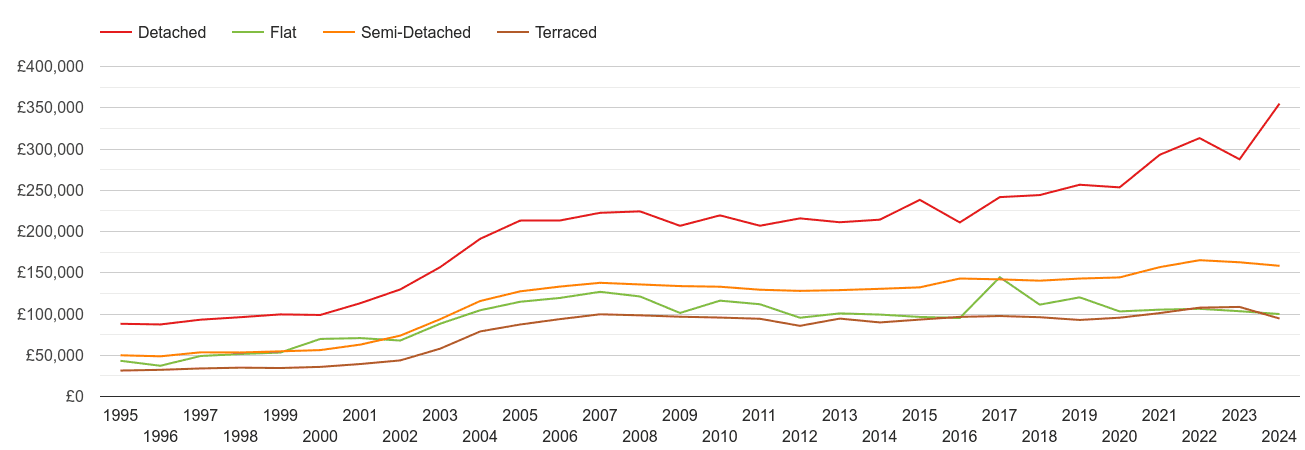
Darlington house prices by property type
Yearly average nominal prices
Current Average Prices by Property Type in Darlington city