The average home size in West Midlands region is 84.5m². This is by 1.8m² less than the average home size in England and Wales. On average, a home has 4.2 rooms including kitchen. This is by 0.1 more than the average home.
Room count is number of habitable rooms. Habitable rooms include any living room, sitting room, dining room, bedroom, study and similar; and also a non-separated conservatory and a kitchen/diner having a discrete seating area. Excluded from the room count are any room used solely as a kitchen, utility room, bathroom, cloakroom, en-suite accommodation and similar, any hallway, stairs or landing, and any room not having a window.
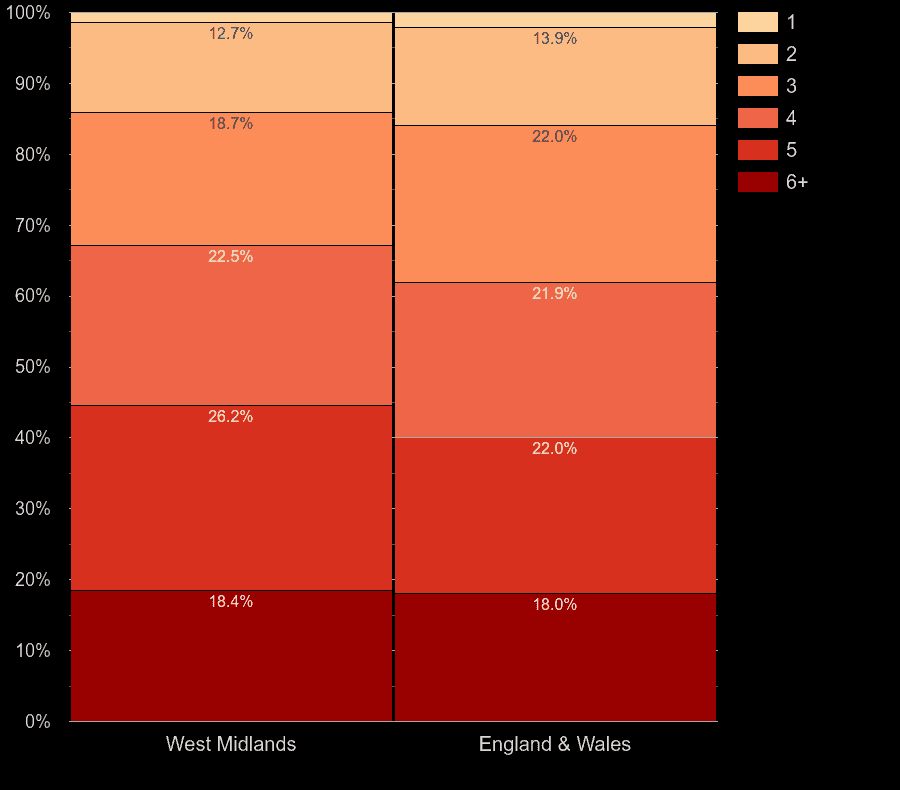
| No. of rooms | West Midlands | England & Wales |
|---|---|---|
| █ 1 | 1.5% | 2.2% |
| █ 2 | 13.9% | 14.6% |
| █ 3 | 19.6% | 22.6% |
| █ 4 | 22.4% | 21.6% |
| █ 5 | 25.4% | 21.4% |
| █ 6+ | 17.3% | 17.6% |
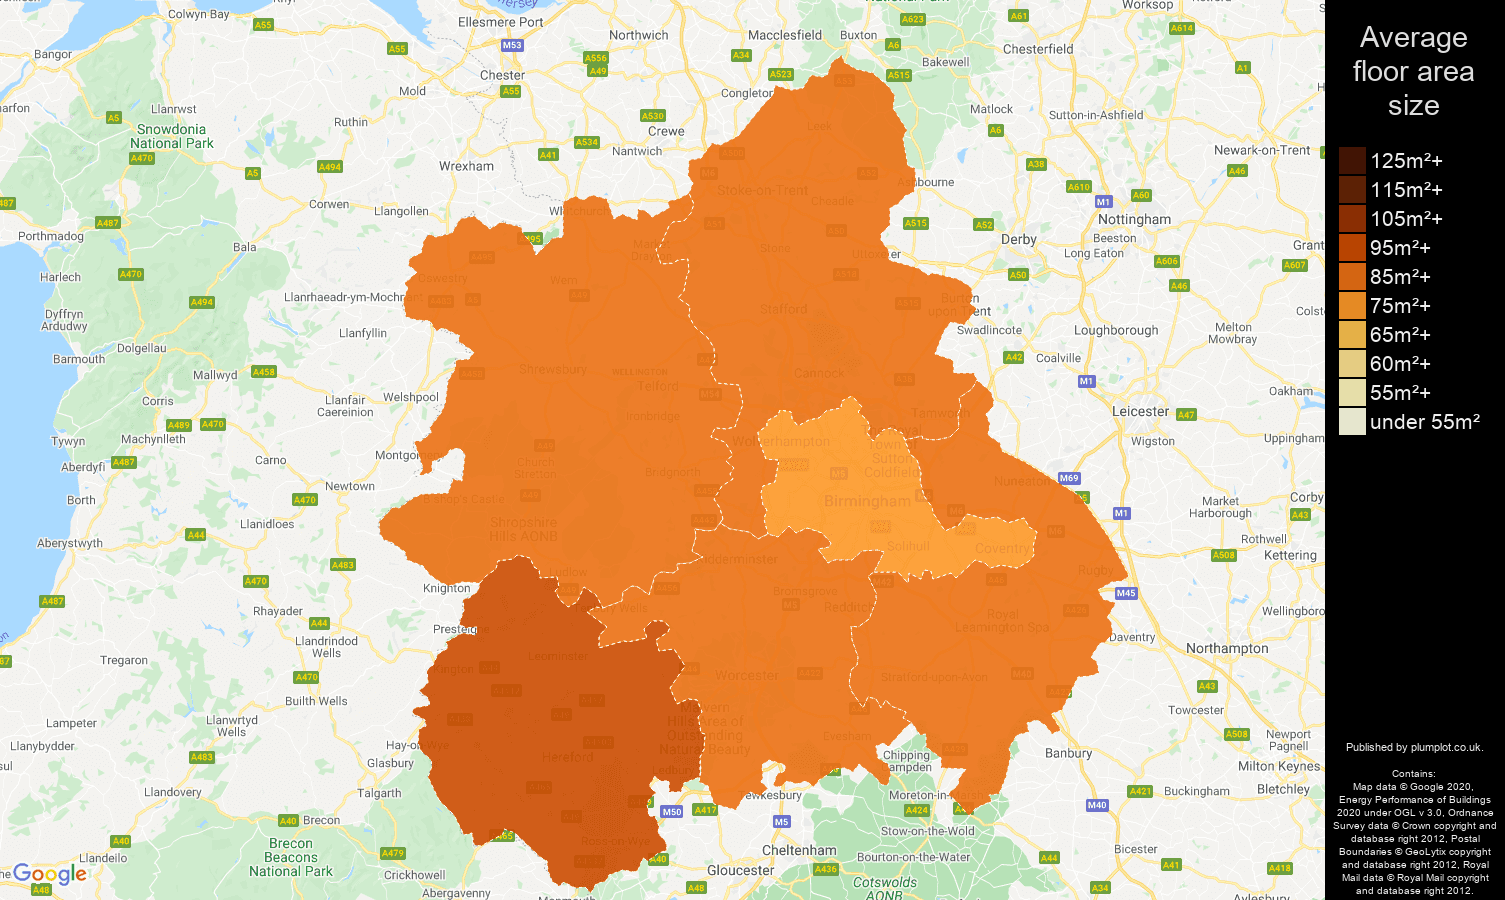
The gross floor area - the total of all enclosed spaces measured to the internal face of the external walls
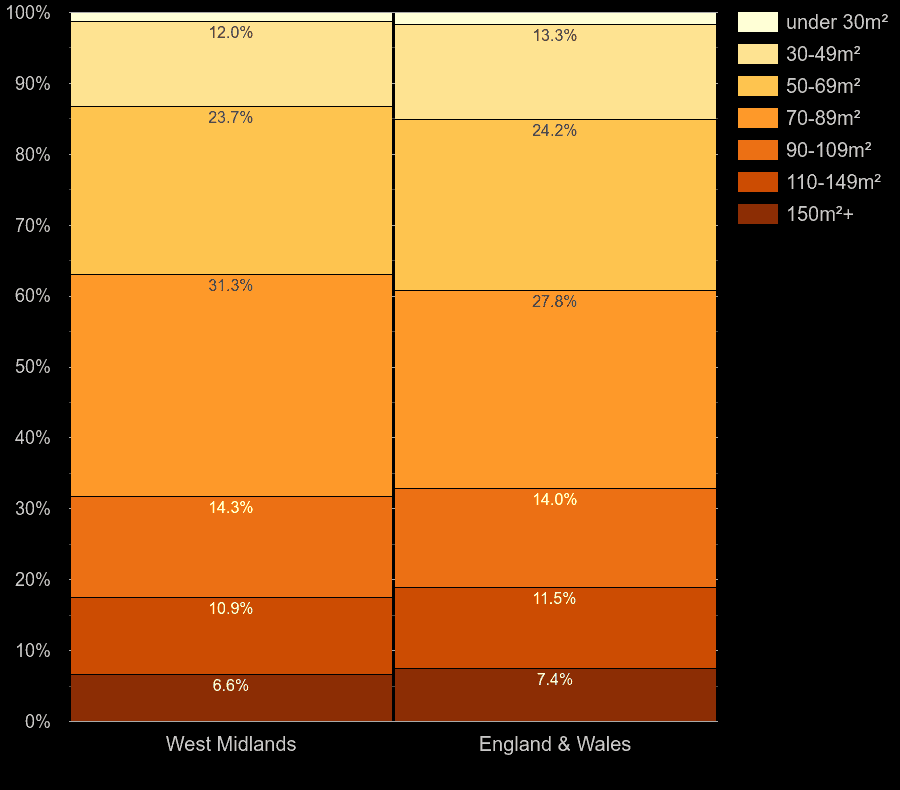
| Floor area size | West Midlands | England & Wales |
|---|---|---|
| █ under 30m² | 1.3% | 1.8% |
| █ 30-49m² | 12.9% | 13.8% |
| █ 50-69m² | 24.4% | 24.5% |
| █ 70-89m² | 31.2% | 27.5% |
| █ 90-109m² | 13.8% | 13.6% |
| █ 110-149m² | 10.2% | 11.2% |
| █ 150m²+ | 6.1% | 7.4% |
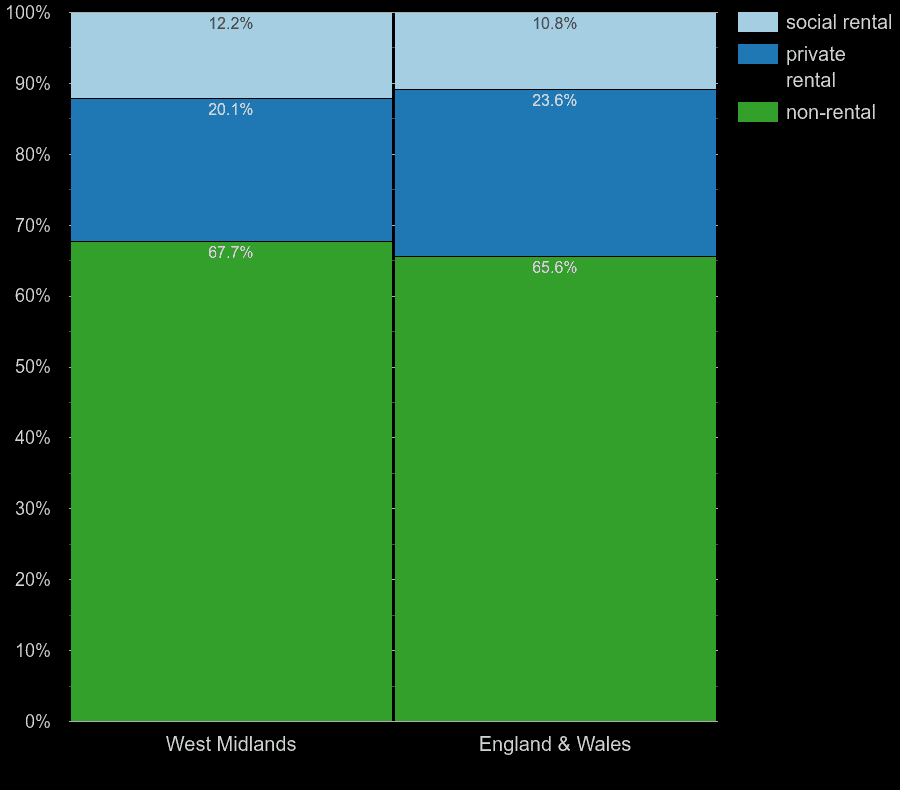
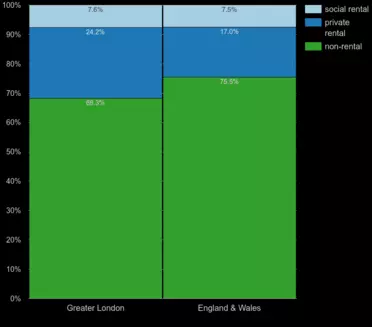
| Rental type | West Midlands | England & Wales |
|---|---|---|
| █ social rental | 9.5% | 8.7% |
| █ private rental | 25.7% | 27.1% |
| █ non-rental | 64.8% | 64.2% |
The number of open fireplaces in the property. Air can pass between the inside of the property and the outside.
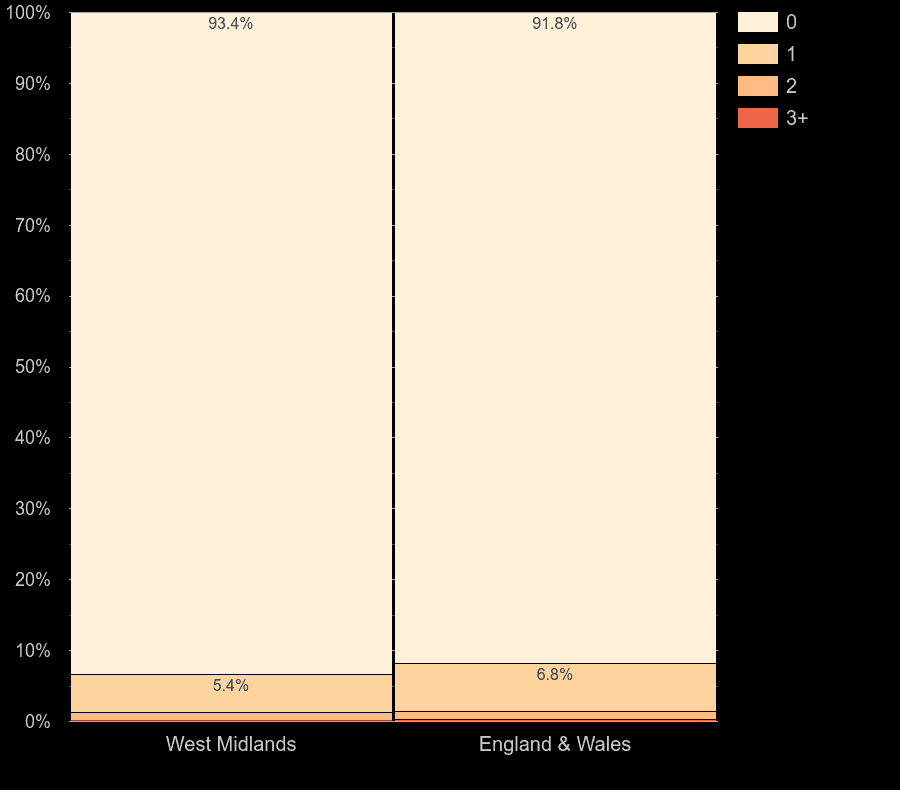
| Number of fireplaces | West Midlands | England & Wales |
|---|---|---|
| █ 0 | 94.5% | 92.6% |
| █ 1 | 4.6% | 6.1% |
| █ 2 | 0.8% | 1.0% |
| █ 3+ | 0.2% | 0.2% |
The type of fuel used to power the central heating. Bio is one of biomass, B30D, B30K, bioethanol, biogas, rapeseed. Coal also includes anthracite. Dual is dual fuel with mineral or wood. Wood can be pellets, chips or logs.
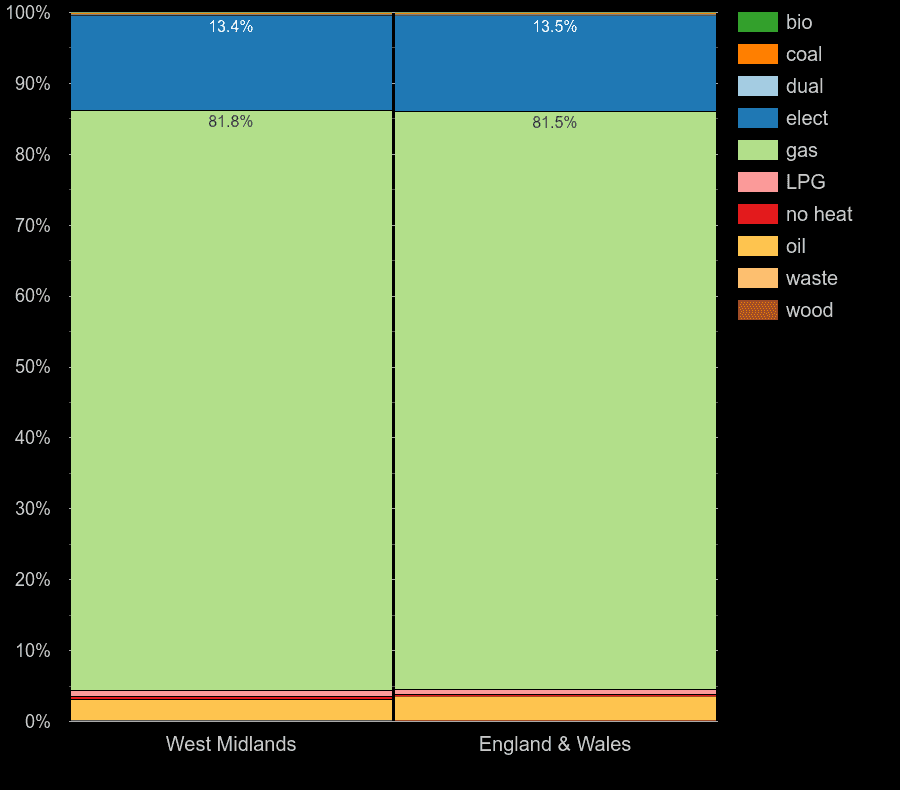
| Main heating fuel type | West Midlands | England & Wales |
|---|---|---|
| █ bio | 0.1% | 0.1% |
| █ coal | 0.1% | 0.1% |
| █ dual | 0.1% | 0.2% |
| █ elect | 14.1% | 14.4% |
| █ gas | 82.2% | 80.9% |
| █ LPG | 0.8% | 0.7% |
| █ no heat | 0.3% | 0.3% |
| █ oil | 2.3% | 3.2% |
| █ waste | 0.0% | 0.0% |
| █ wood | 0.1% | 0.1% |
The type of glazing. From British Fenestration Rating Council or manufacturer declaration.
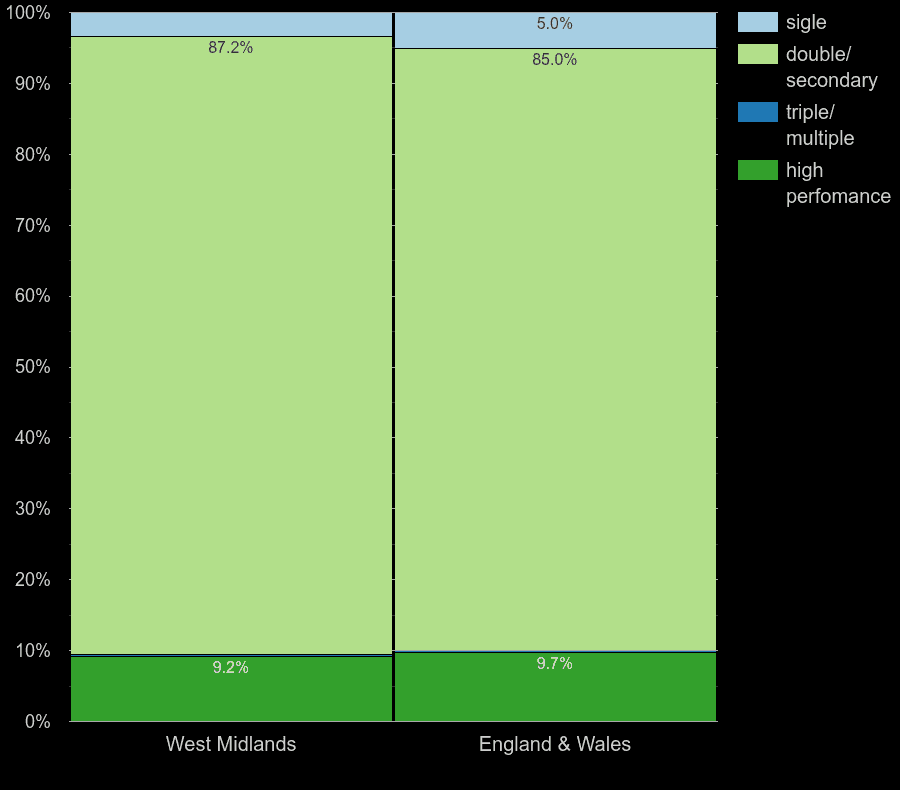
| Windows glazing | West Midlands | England & Wales |
|---|---|---|
| █ sigle | 2.8% | 4.6% |
| █ double/secondary | 88.3% | 85.4% |
| █ triple/multiple | 0.3% | 0.4% |
| █ high perfomance | 8.7% | 9.6% |
A gas meter or a gas-burning appliance is available in the dwelling. A closed-off gas pipe does not count.
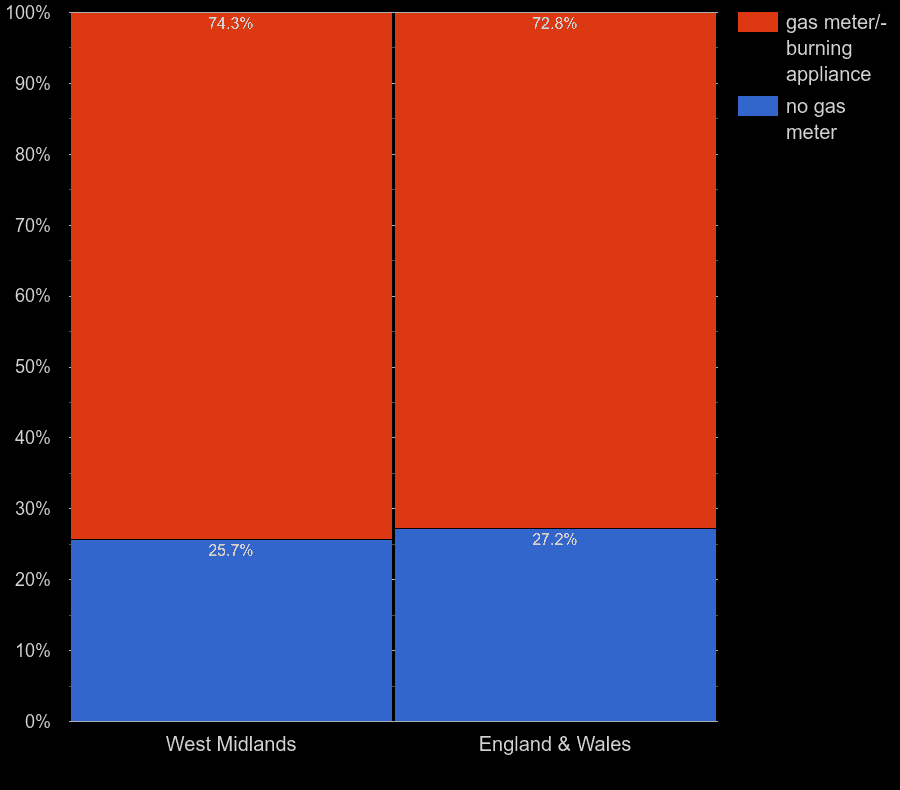
| Mains gas | West Midlands | England & Wales |
|---|---|---|
| █ gas meter/-burning appliance | 76.0% | 73.1% |
| █ no gas meter | 24.0% | 26.9% |
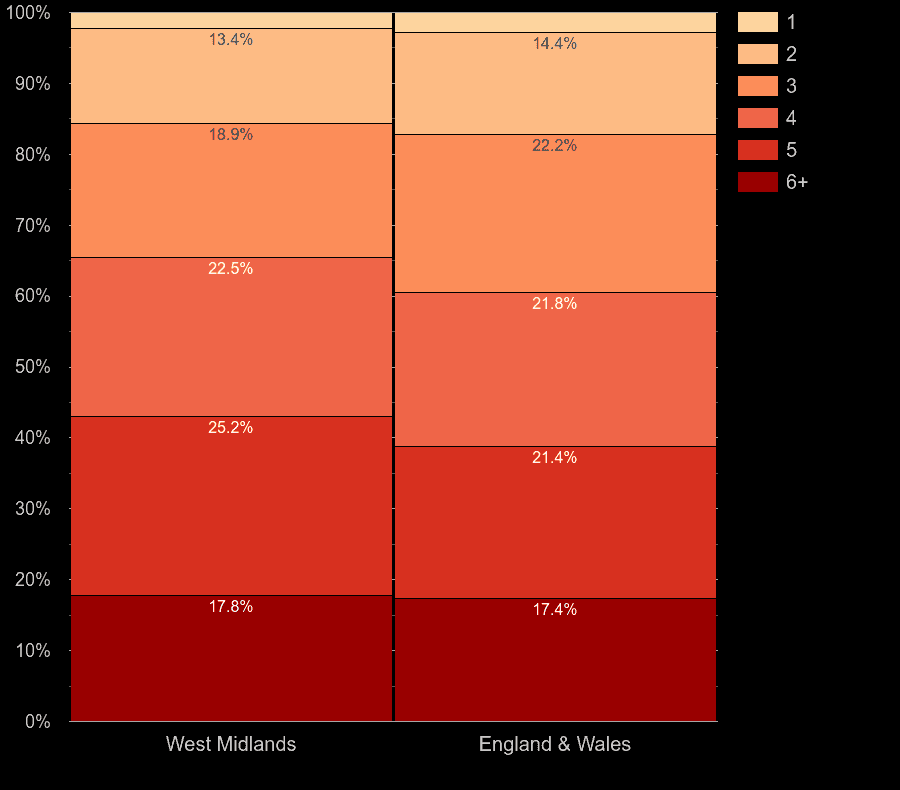
| No. of rooms | West Midlands | England & Wales |
|---|---|---|
| █ 1 | 2.3% | 2.9% |
| █ 2 | 14.5% | 15.0% |
| █ 3 | 19.7% | 22.7% |
| █ 4 | 22.3% | 21.6% |
| █ 5 | 24.5% | 20.9% |
| █ 6+ | 16.7% | 17.0% |
Indicates whether the heating in the property is solar powered.
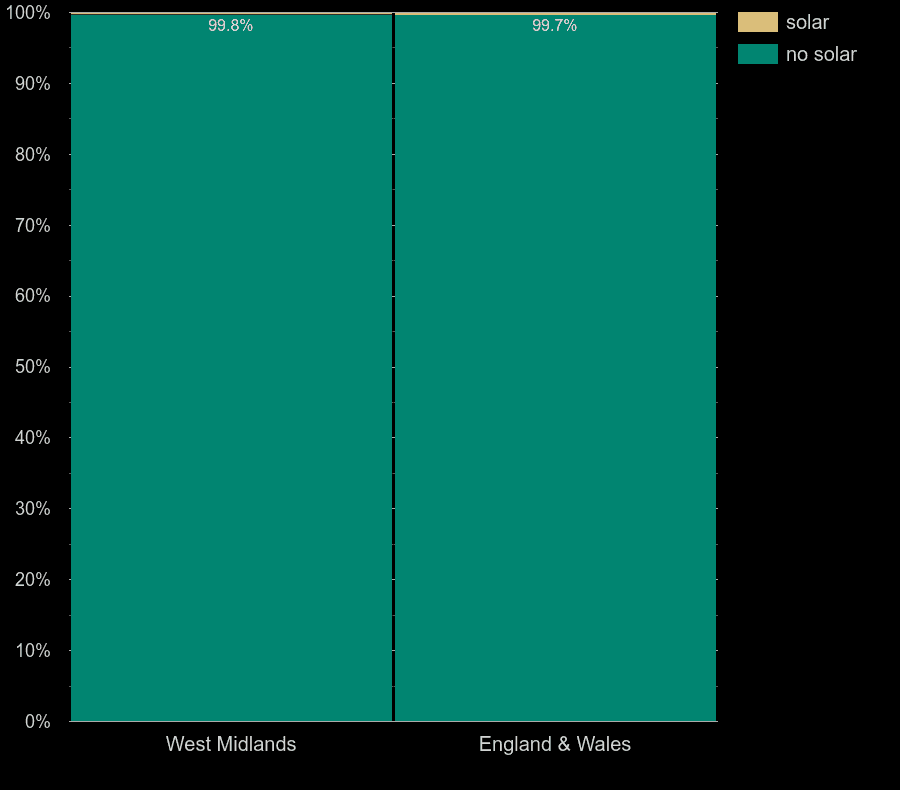
| Solar heating | West Midlands | England & Wales |
|---|---|---|
| █ solar | 0.3% | 0.4% |
| █ no solar | 99.7% | 99.6% |

 login →