Annual crime rate in West London postcode area is 27.2, i.e. 27.2 crimes committed per annum per 1000 workday people. Compared to the national crime rate, West London's crime rate is at 303%. Other theft crime makes up 18.0% of all crimes committed in the postcode area. The total number of "other theft crime" is 21.7k, and this number has increased by 32.4% when compared year-over-year in the period of November 2018 - October 2019.
27.2
annual crime rate per 1k workday people
303%
of national crime rate
18.0%
of all crimes
21.7k
crimes committed
32.4%
annual change
West London other theft crime rate comparison map
November 2018 - October 2019
Postcode sector
Crime rate vs. ENG & WLS rate
Crime rate per 1000 workday people
Total number of crimes
W10 4
86%
8
63
W10 5
142%
13
177
W10 6
161%
14
154
W11 1
358%
32
274
W11 2
327%
29
193
W11 3
531%
48
262
W11 4
162%
15
142
W12 0
97%
9
138
W12 7
195%
17
459
W12 8
496%
44
444
W12 9
116%
10
101
W13 0
155%
14
111
W13 8
84%
8
44
W13 9
104%
9
97
W14 0
93%
8
83
W14 8
174%
16
188
W14 9
120%
11
126
W1B 1
142%
13
23
W1B 2
242%
22
92
W1B 3
12327%
1106
94
W1B 4
2236%
201
192
W1B 5
2244%
201
502
W1C 1
3676%
330
184
W1C 2
1865%
167
93
W1D 1
5719%
513
333
W1D 2
15688%
1407
190
W1D 3
954%
86
414
W1D 4
2389%
214
600
W1D 5
1646%
148
504
W1D 6
1728%
155
743
W1D 7
1301%
117
417
W1F 0
962%
86
516
W1F 7
799%
72
636
W1F 8
333%
30
227
W1F 9
359%
32
233
W1G 0
1793%
161
195
W1G 6
62%
6
19
W1G 7
69%
6
15
W1G 8
38%
3
14
W1G 9
19%
2
20
W1H 1
65%
6
20
W1H 2
210%
19
26
W1H 4
121%
11
26
W1H 5
313%
28
88
W1H 6
722%
65
203
W1H 7
346%
31
158
W1J 0
362%
32
86
W1J 5
89%
8
43
W1J 6
105%
9
56
W1J 7
285%
26
185
W1J 8
196%
18
71
W1K 1
570%
51
89
W1K 2
137%
12
66
W1K 3
36%
3
21
W1K 4
87%
8
20
W1K 5
431%
39
143
W1K 6
816%
73
193
W1K 7
715%
64
174
W1S 1
440%
39
440
W1S 2
153%
14
89
W1S 3
223%
20
44
W1S 4
306%
27
166
W1T 1
466%
42
473
W1T 2
493%
44
194
W1T 3
356%
32
181
W1T 4
212%
19
125
W1T 5
313%
28
203
W1T 6
49%
4
10
W1T 7
593%
53
161
W1U 1
1176%
106
504
W1U 2
473%
42
129
W1U 3
150%
13
65
W1U 4
365%
33
71
W1U 5
279%
25
78
W1U 6
1055%
95
283
W1U 7
314%
28
95
W1U 8
56%
5
22
W1W 5
372%
33
113
W1W 6
195%
18
132
W1W 7
102%
9
57
W1W 8
870%
78
438
W2 1
365%
33
672
W2 2
704%
63
458
W2 3
738%
66
443
W2 4
572%
51
392
W2 5
186%
17
148
W2 6
132%
12
176
W3 0
146%
13
106
W3 6
122%
11
143
W3 7
130%
12
150
W3 8
101%
9
109
W3 9
341%
31
197
W4 1
138%
12
98
W4 2
106%
10
96
W4 3
138%
12
97
W4 4
112%
10
60
W4 5
122%
11
138
W5 1
66%
6
50
W5 2
202%
18
207
W5 3
134%
12
112
W5 4
148%
13
126
W5 5
346%
31
253
W6 0
205%
18
289
W6 7
113%
10
121
W6 8
167%
15
190
W6 9
220%
20
291
W7 1
75%
7
53
W7 2
61%
6
36
W7 3
89%
8
67
W8 4
317%
28
178
W8 5
213%
19
207
W8 6
206%
18
128
W8 7
155%
14
92
W9 1
181%
16
134
W9 2
141%
13
108
W9 3
103%
9
100
West London other theft crime rate rank
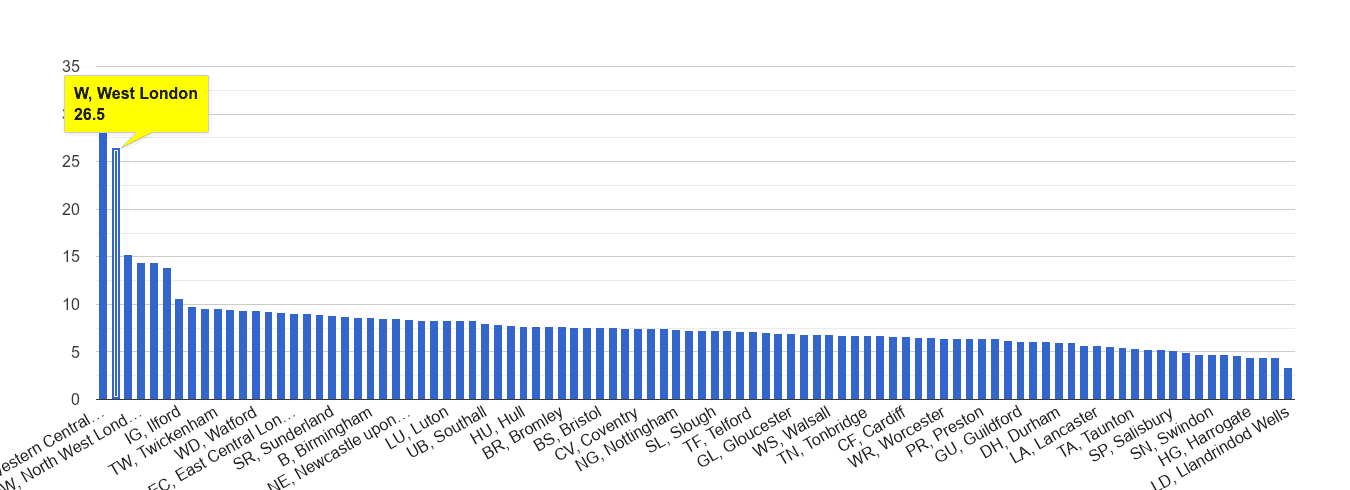
Other theft crime rate is 27.2 crimes committed per 1,000 working people per annum. It's the 2. highest crime rate out of 104 England and Wales' postcode areas.
2.
highest crime rate out of 104 postcode areas
27.2
annual crime rate per 1k workday people
West London other theft crime rate compared to other areas
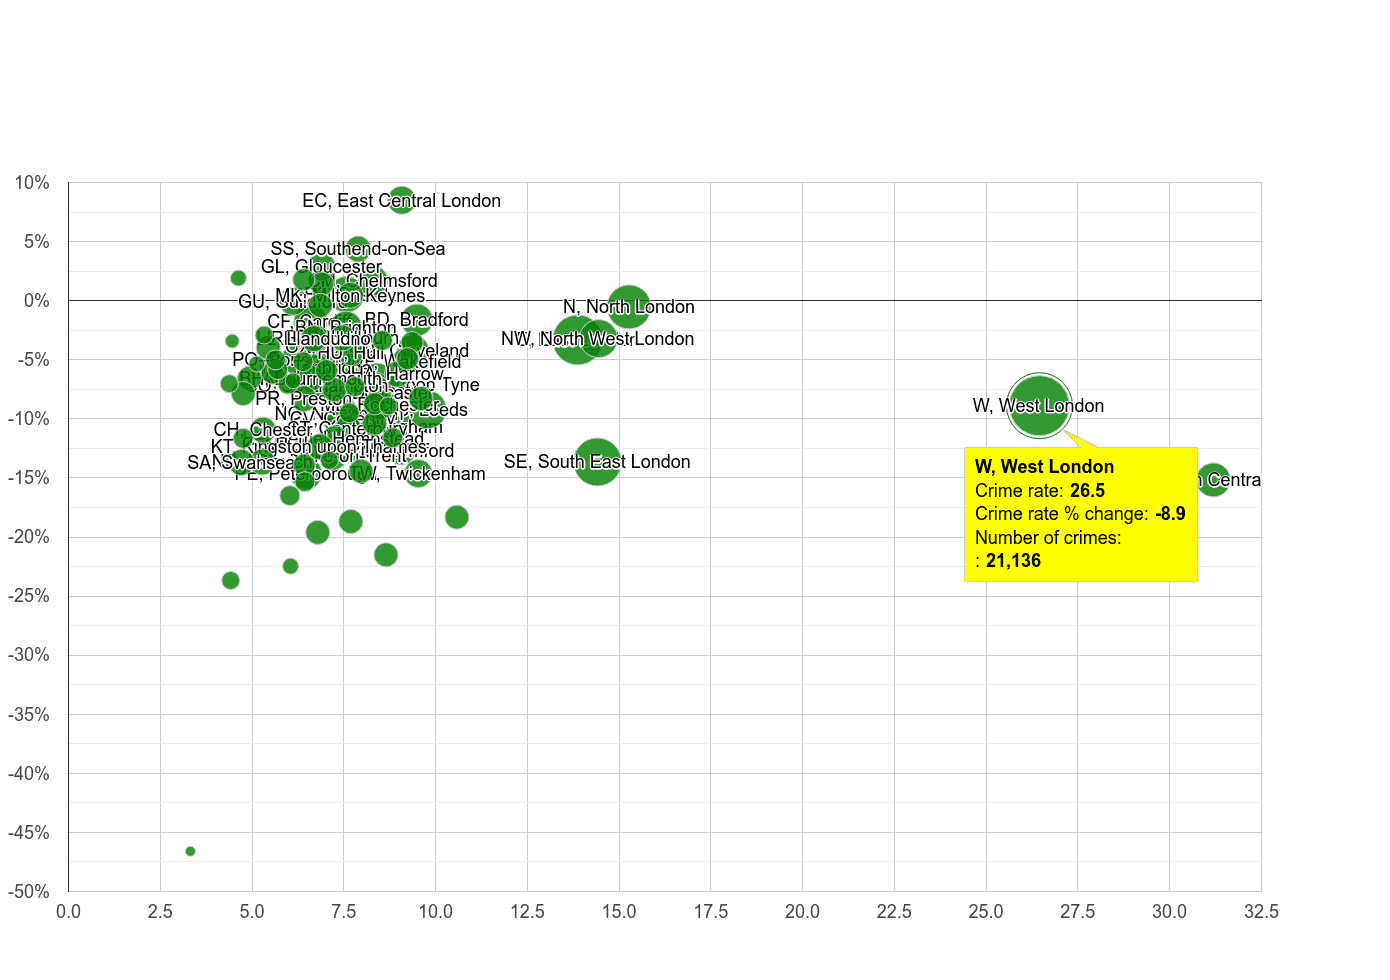
The total number of "other theft crime" is 21.7k, and this number has increased by 32.4% when compared year-over-year in the period of November 2018 - October 2019. In the graph below, postcode area are compared by crime rate and crime rate percentage change. Crime rate percentage change compares the postcode area crime rate between November 2018 - October 2019 to the postcode area crime rate in the previous 12 months. The size of the circle reflects the number of total crimes committed. The bigger the circle, the higher the number of crimes committed in the postcode area.
32.4%
annual change
27.2
annual crime rate per 1k workday people
21.7k
crimes committed
Crime rate percentage changeCrime rate per 1000 workday people
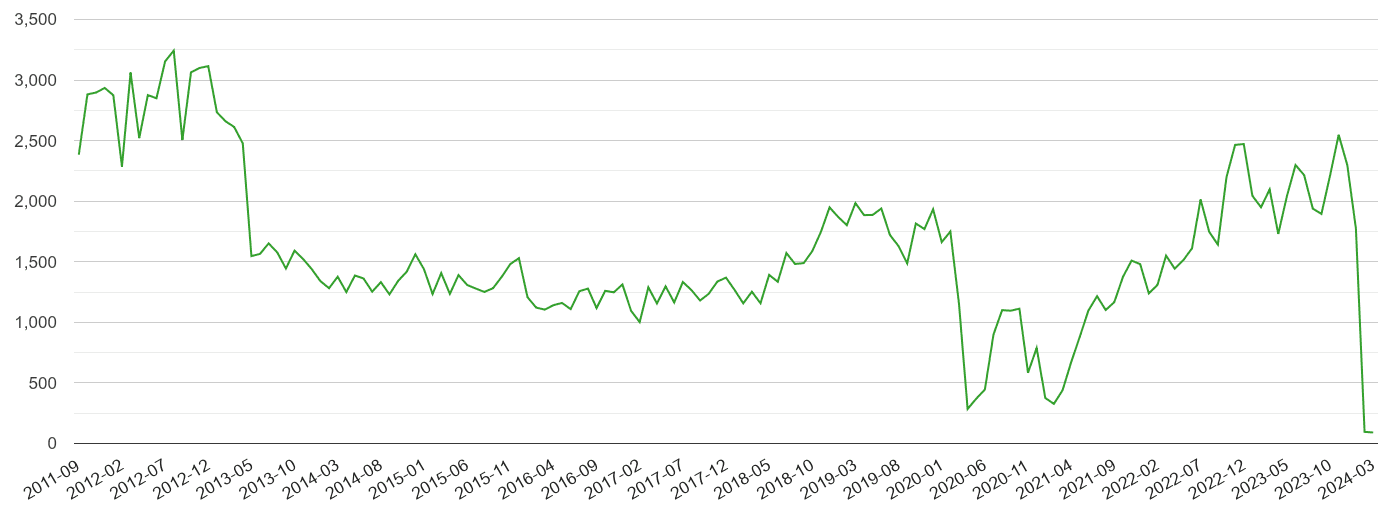
West London other theft crime rate
Annual crime rate per 1000 workday people
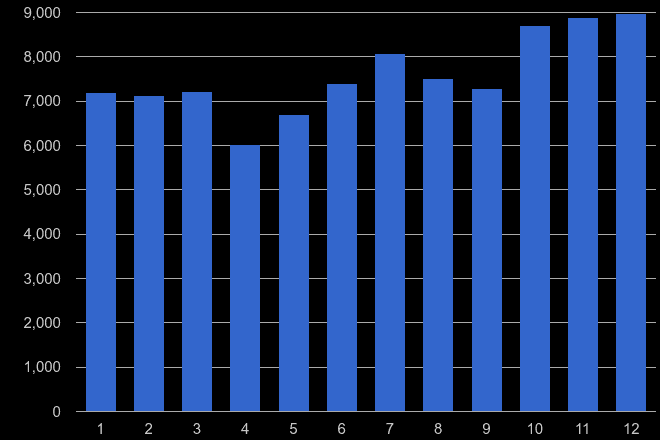
West London other theft crime seasonality
Total number of crimes committed in a given calendar month (1 = January … 12 = December) in the previous five years.