In 2024, the total population of Walsall postcode area was 501k and it increased by 65.8k people since 2002. That's 15.1% population growth . Population average age was 40.6 and it increased by 2 years since 2002. The postcode area was ageing at the same pace as England and Wales in which the age grew by 2 years in the same period. The population was growing slower than population in England and Wales which grew by 17.5%.
Summary of Population, Growth, and Age Trends Since 2002
Population Change Since 2002
Value
Absolute Headcount Change
+65.8k
Population Percentage Change
+15.1%
Average Age Change (Years)
+2 yrs
Walsall headcount change rank
Compares speed of population growth to other postcode areas. Areas with the highest population growth are on the left. Shows relative population change between 2002 and 2024.
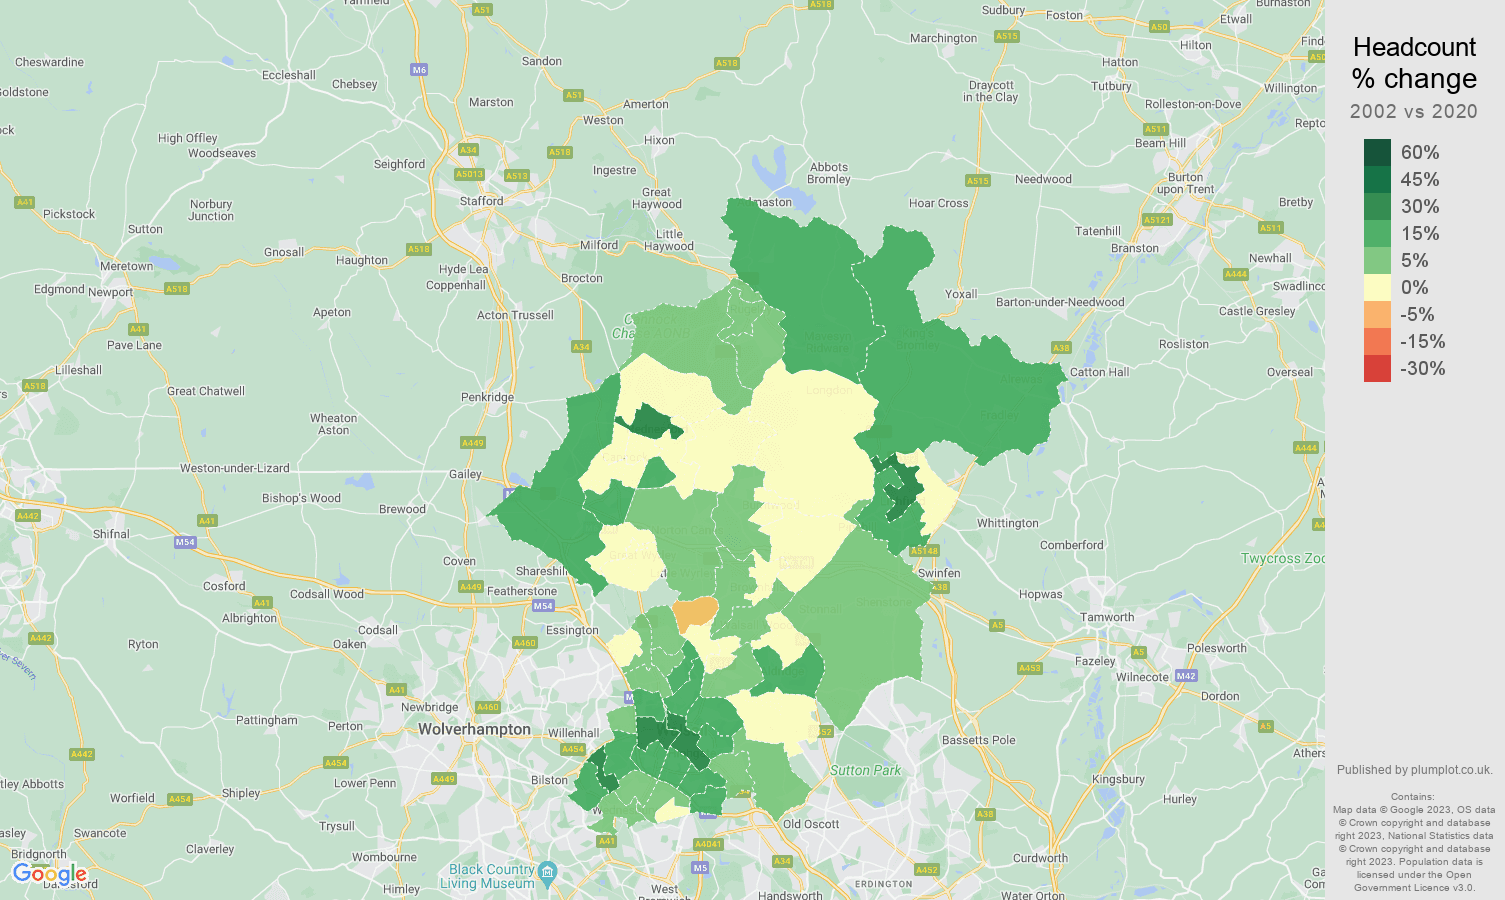
Walsall headcount change map
Compares the latest population estimates with population estimates in 2002 and shows percentage difference.
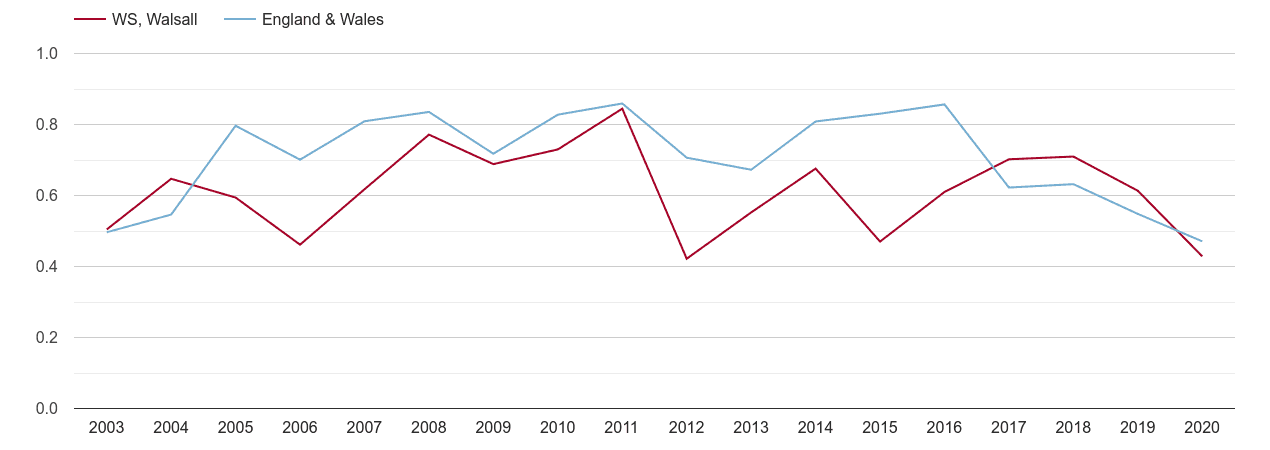
Walsall population growth rate
Shows year over year population change.
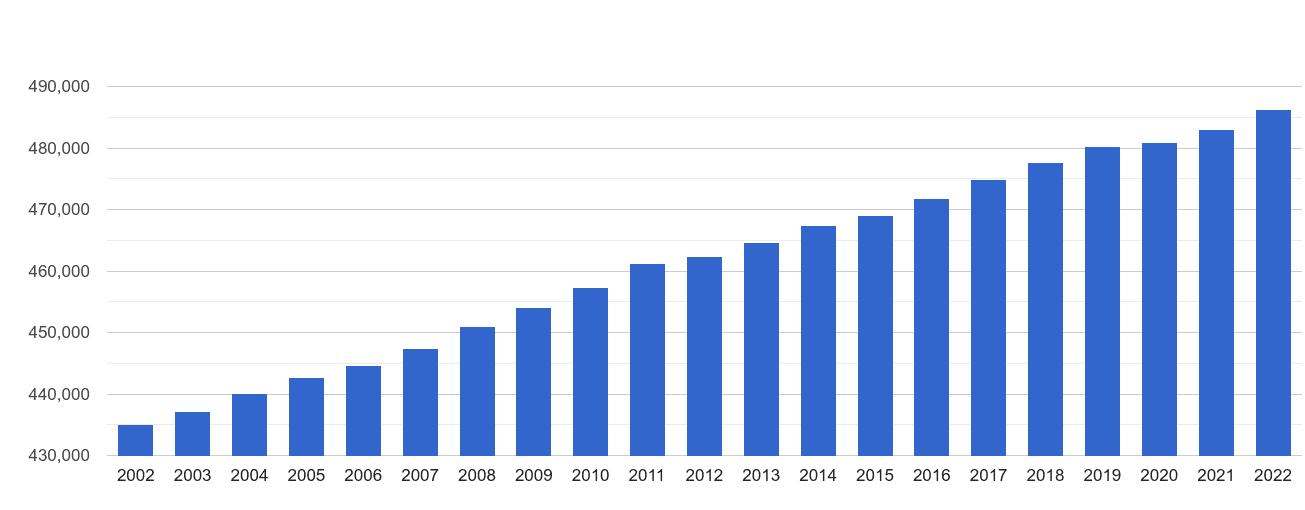
Walsall population growth
Shows total population by year.
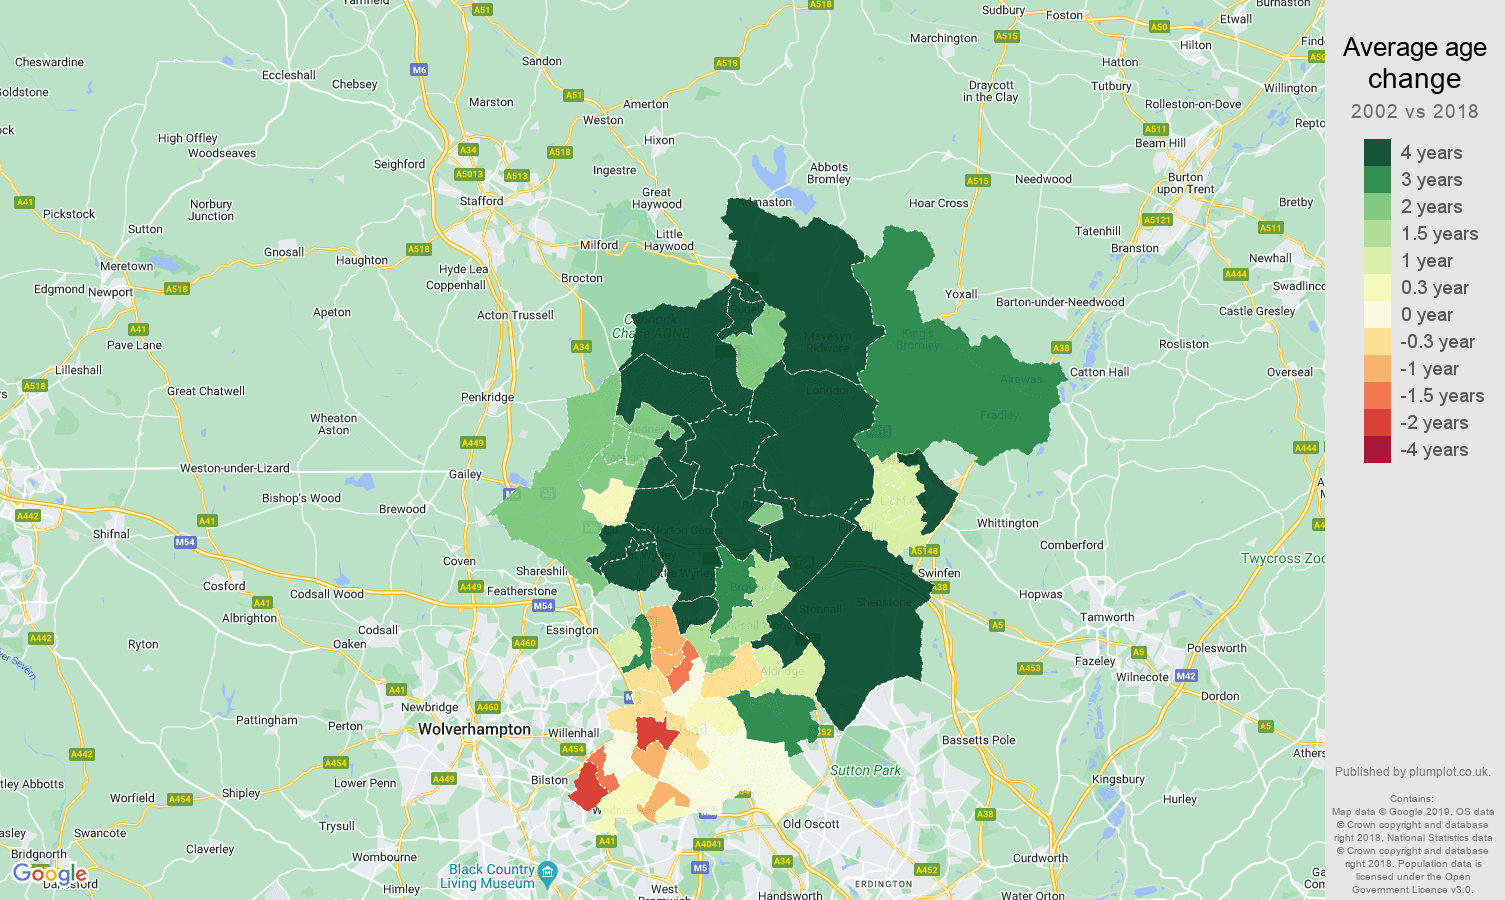
Walsall average age change map
Shows population's average age change since 2002.
Walsall population average age change rank
Compares the speed of average age change in the postcode areas between 2002 and 2024.
Areas with the fastest ageing population are on the left, the areas with their population becoming younger are on the right.
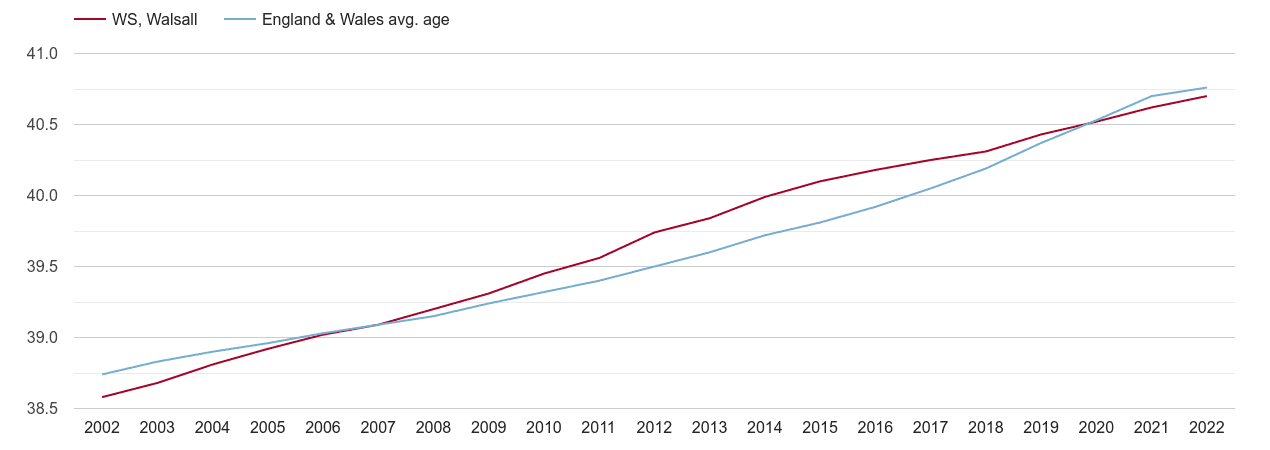
Walsall population average age
Annual statistics of population's average age.
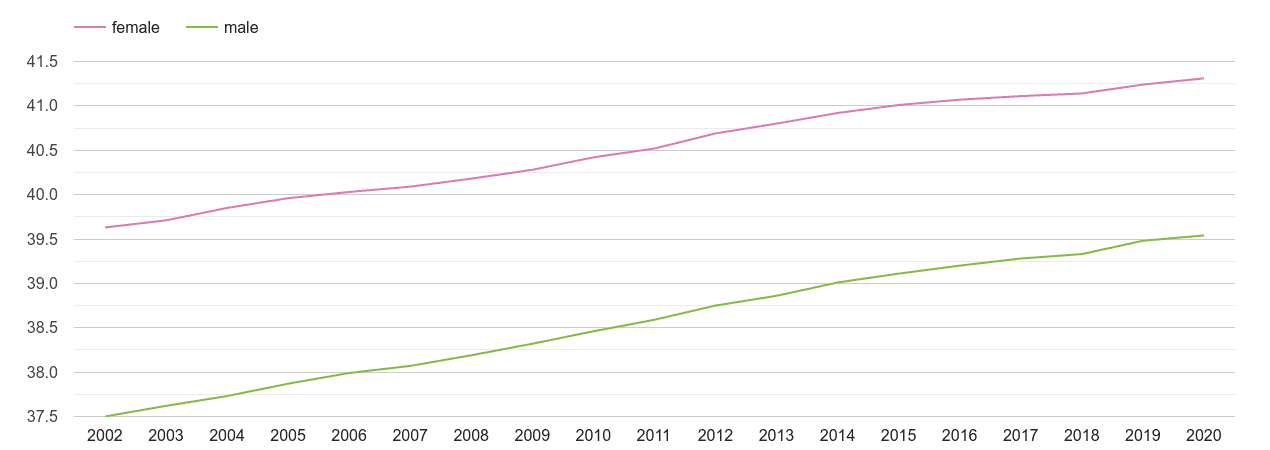
Walsall male and female average age
Annual statistics of population's average age by sex.
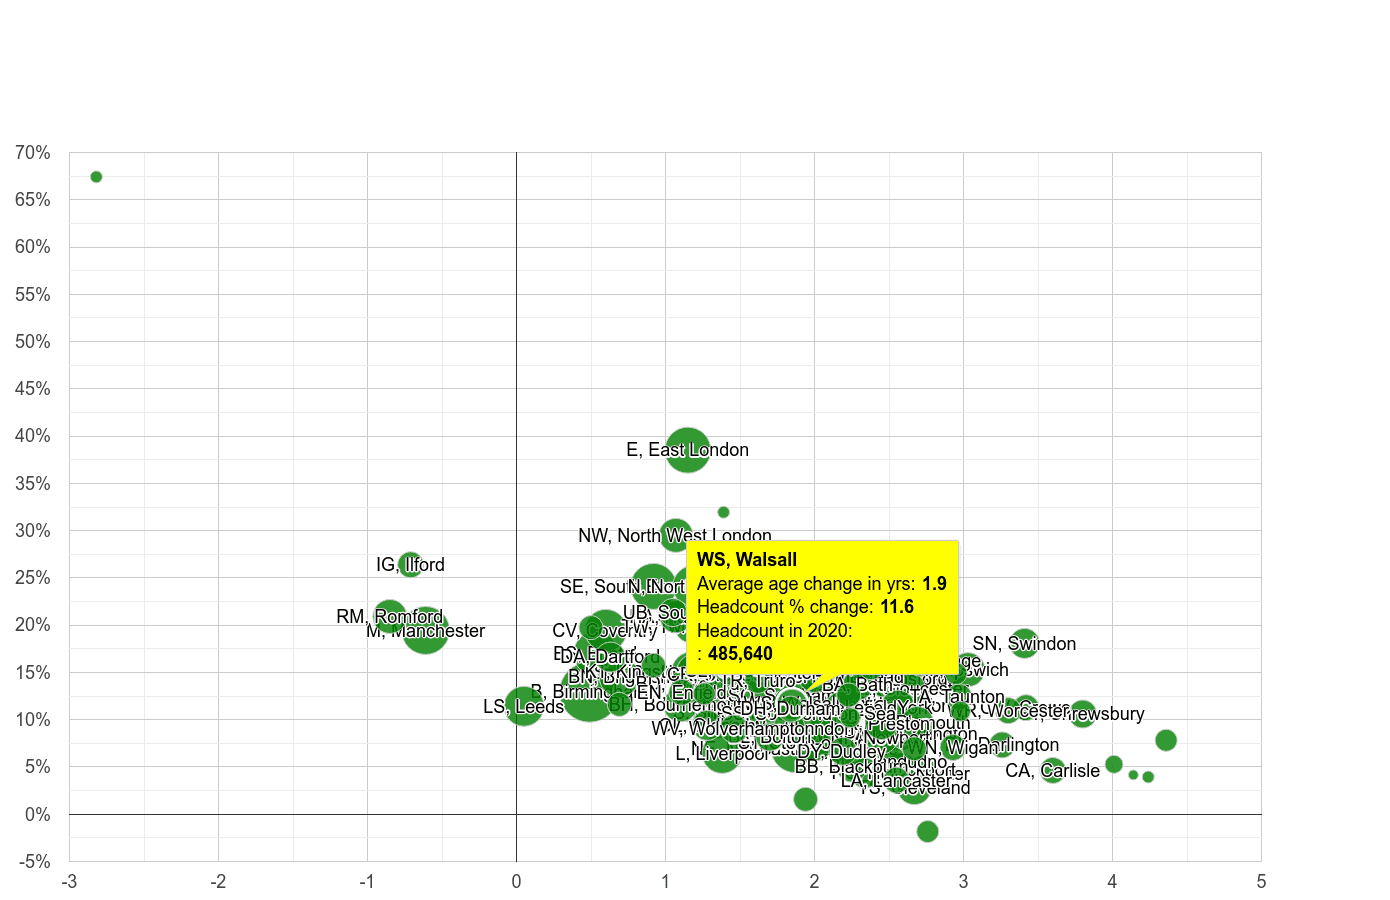
Walsall population changes compared to other areas
Comparison to other postcode areas. Metrics show a percentage change in the headcount between 2002 and 2024 on y-axis and change of the population's average age on x-axis. The size of the circle is directly proportional to the total population in 2024.
Headcount percentage changePopulation average age change
Plumplot area insights - interactive charts and maps
 Headcount percentage change
 login →