Sutton property transactions

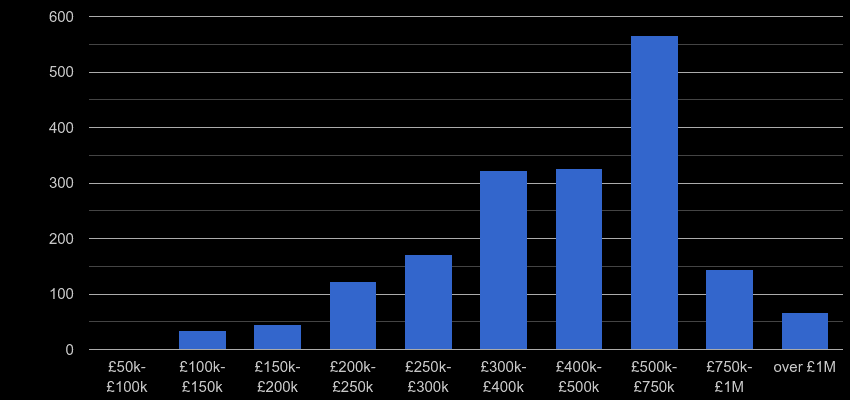
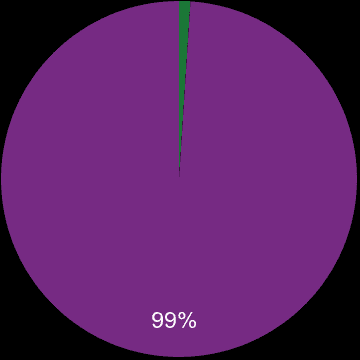
There were 2.7k property sales in Sutton postcode area in the previous twelve months and sales increased by 2.0% (56 transactions). 130 properties, 4.8% were sales of a newly built property. Most properties were sold in the £500k-£750k price range with 672 (25.1%) properties sold, followed by £300k-£400k price range with 660 (24.6%) properties sold.

Sutton sales share of new homes and older homes

July 2020 - June 2021
Sutton sales share of new homes and older homes

4.8%

A newly built property

130

95.2%

An established property

2.6k

2.7k

total sales volume

Sutton sales share of houses and flats

July 2020 - June 2021

Sutton sales share of houses and flats

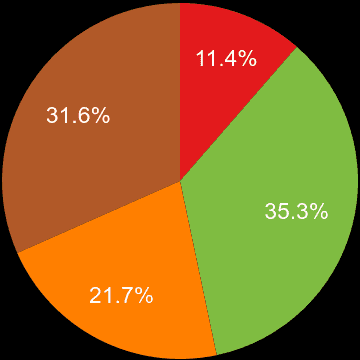
12.3%

Detached

330

30.8%

Flat

825

25.7%

Semi-Detached

688

31.3%

Terraced

838

Sutton property sales by price range

shows a number of properties sold in a given price range between July 2020 - June 2021.

Sutton property sales by price range
Property price rangeMarket shareSales volume
£100k-£150k0.8%22
£150k-£200k1.5%41
£200k-£250k5.9%158
£250k-£300k8.6%231
£300k-£400k24.6%660
£400k-£500k23.8%638
£500k-£750k25.1%672
£750k-£1M6.8%182
over £1M2.9%77

Sutton sales volumes by floor area size

Number of sold properties by floor area size.
Property sales volumes by floor size

Sutton property sales volumes

Yearly property sales volume by nominal price ranges
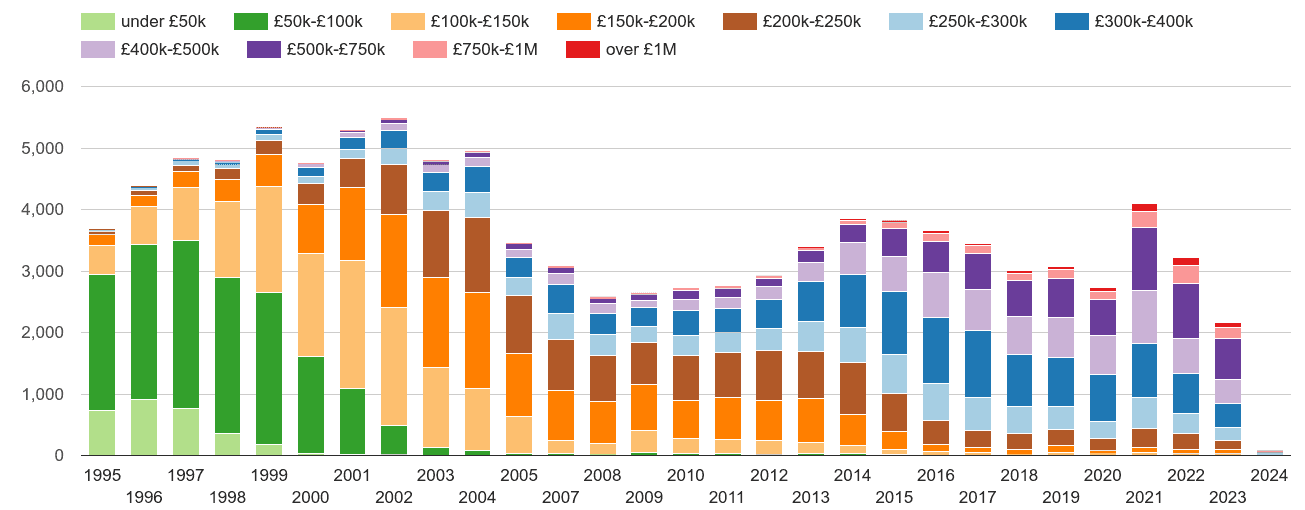
Sutton property sales volumes

Sutton annual sales of new homes and older homes

Total sales volume by year

Sutton annual sales of new homes and older homes

Sutton annual sales share of new homes and older homes

Market share by year

Sutton annual sales share of new homes and older homes

Sutton annual sales of houses and flats

Total sales volumes by year

Sutton annual sales of houses and flats

Sutton annual sales share of houses and flats

Market share by year

Sutton annual sales share of houses and flats

Sutton sales volume change rank

Compares annual percentage change in property transactions to other postcode areas. Metric compares a number of transactions between June 2020 - May 2021 to the number of transactions in the previous 12 months.
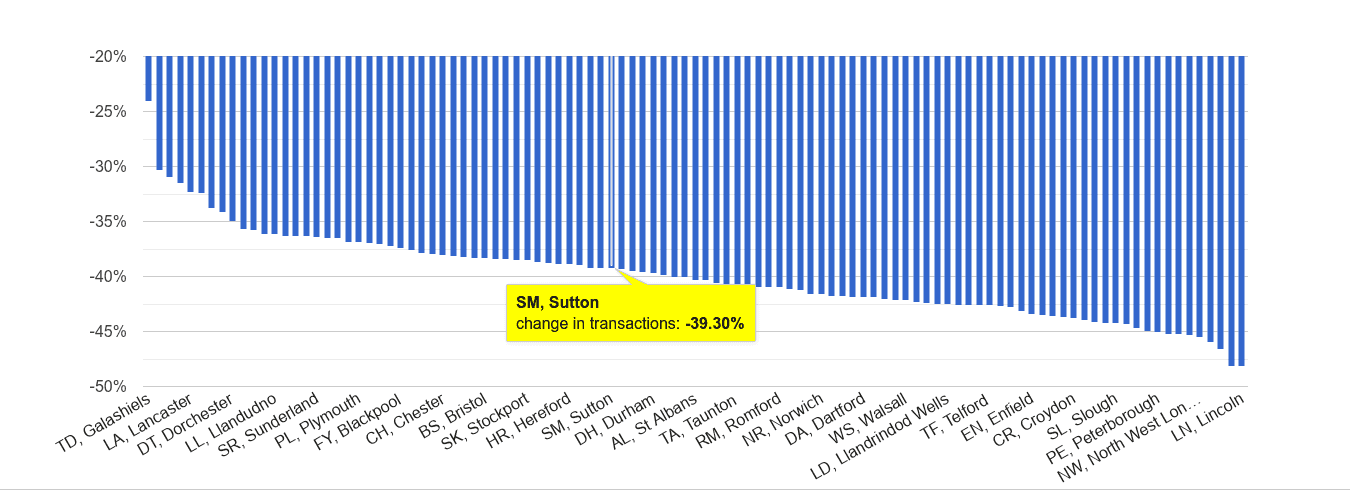
Sutton sales volume change rank

Sutton property price and sales volume change

Comparison to other postcode areas. Metrics show a percentage change in property transactions (y-axis) and change in the average price (x-axis) between June 2020 - May 2021 and previous 12 months. The size of a circle is directly proportional to a number of property transactions in a postcode area.
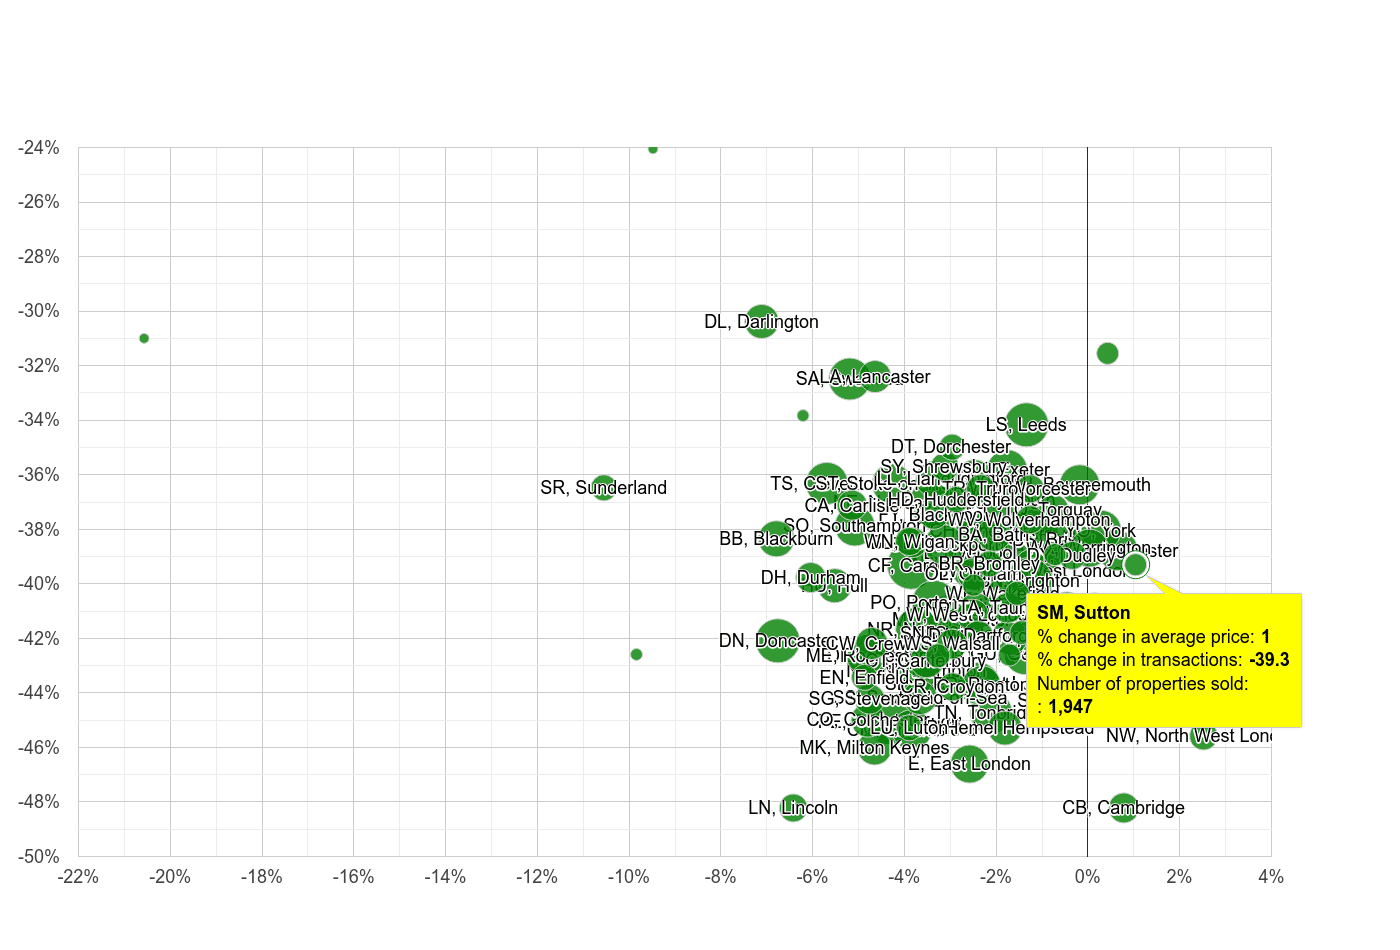
Sutton property price and sales volume change relative to other postcode areasPercentage change in transactions
Percentage change in average property price

Sutton map of sales of new properties

shows the total volume of new properties sold a given postcode sector.

Sutton map of sales of new properties

Other reports for Sutton postcode area

house prices

new home prices

salary and unemployment

home features

energy costs

home energy efficiency

population statistics

crime statistics

Homeimage/svg+xmlOpencliparteco green house icon2012-05-29T15:40:56https://openclipart.org/detail/170282/eco-green-house-icon-by-cybergedeondominiquechappardecologygreenhomehouseicon