St Albans postcode area Census 2021
81.6% people are white, 8.4% people are asian, 4.2% people are mixed.
47.1% are Christian, 37.3% have no religion, 6.3% provided no answer.
43.0% households have 1 car, 31.2% households have 2 cars, 14.9% households have no car. St Albans population ethnic group
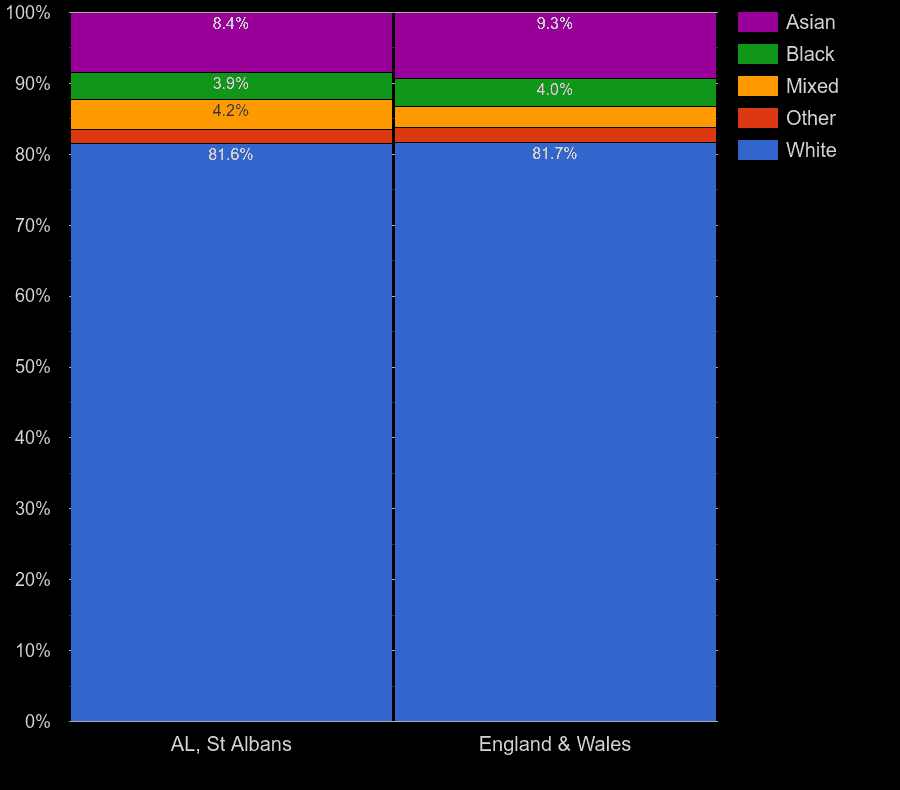
Ethnicity Share: St Albans postcode area Compared to England & Wales (2021 Census)| Ethnicity | St Albans postcode area | England & Wales (UK) |
|---|
| Asian | 8.4% | 9.3% |
| Black | 3.9% | 4.0% |
| Mixed | 4.2% | 2.9% |
| Other | 1.9% | 2.1% |
| White | 81.6% | 81.7% |
St Albans population health
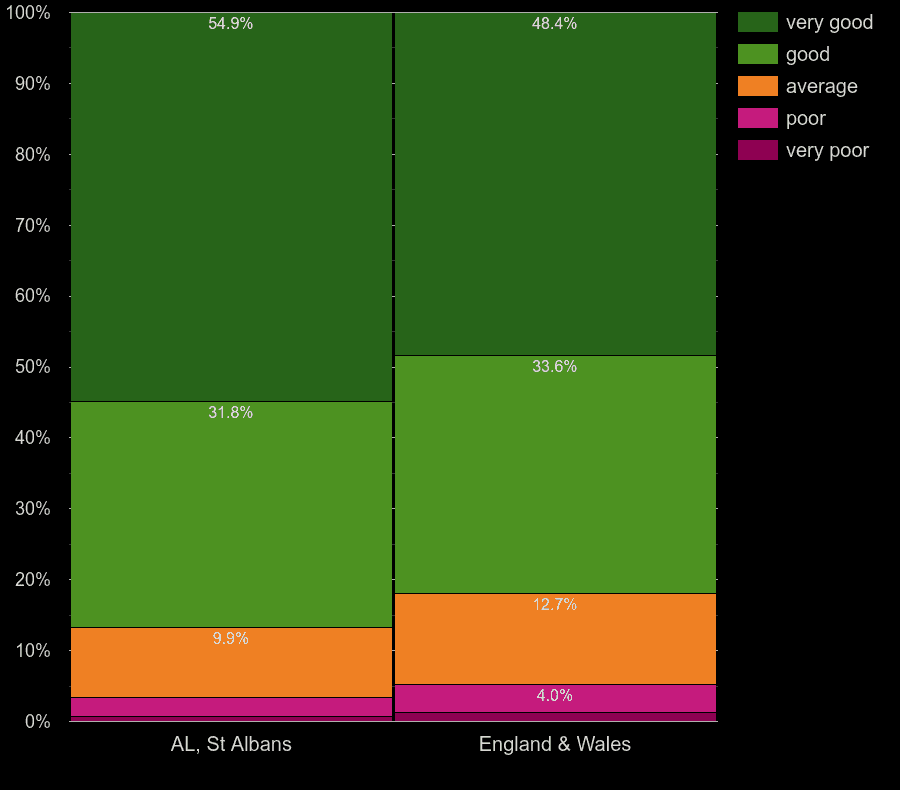
Health Quality Share: St Albans postcode area Compared to England & Wales (2021 Census)| Health | St Albans postcode area | England & Wales (UK) |
|---|
| very good | 54.9% | 48.4% |
| good | 31.8% | 33.6% |
| average | 9.9% | 12.7% |
| poor | 2.7% | 4.0% |
| very poor | 0.7% | 1.2% |
St Albans population religion
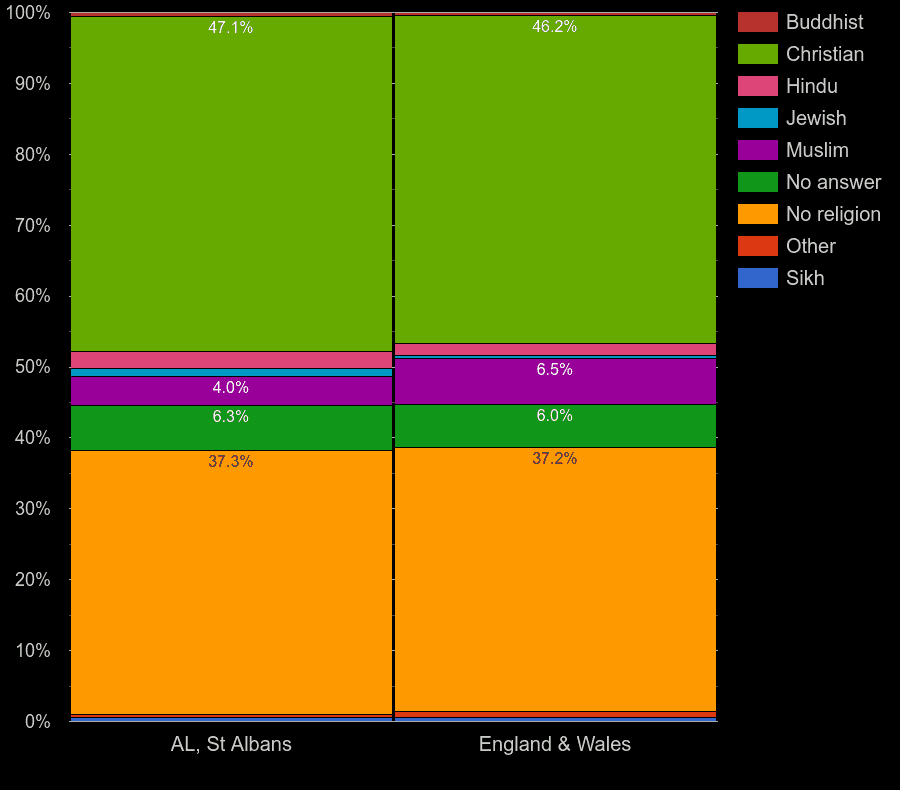
Religion Share: St Albans postcode area Compared to England & Wales (2021 Census)| Religion | St Albans postcode area | England & Wales (UK) |
|---|
| Buddhist | 0.6% | 0.5% |
| Christian | 47.1% | 46.2% |
| Hindu | 2.4% | 1.7% |
| Jewish | 1.2% | 0.5% |
| Muslim | 4.0% | 6.5% |
| No answer | 6.3% | 6.0% |
| No religion | 37.3% | 37.2% |
| Other | 0.4% | 0.9% |
| Sikh | 0.6% | 0.6% |
St Albans population economic activity
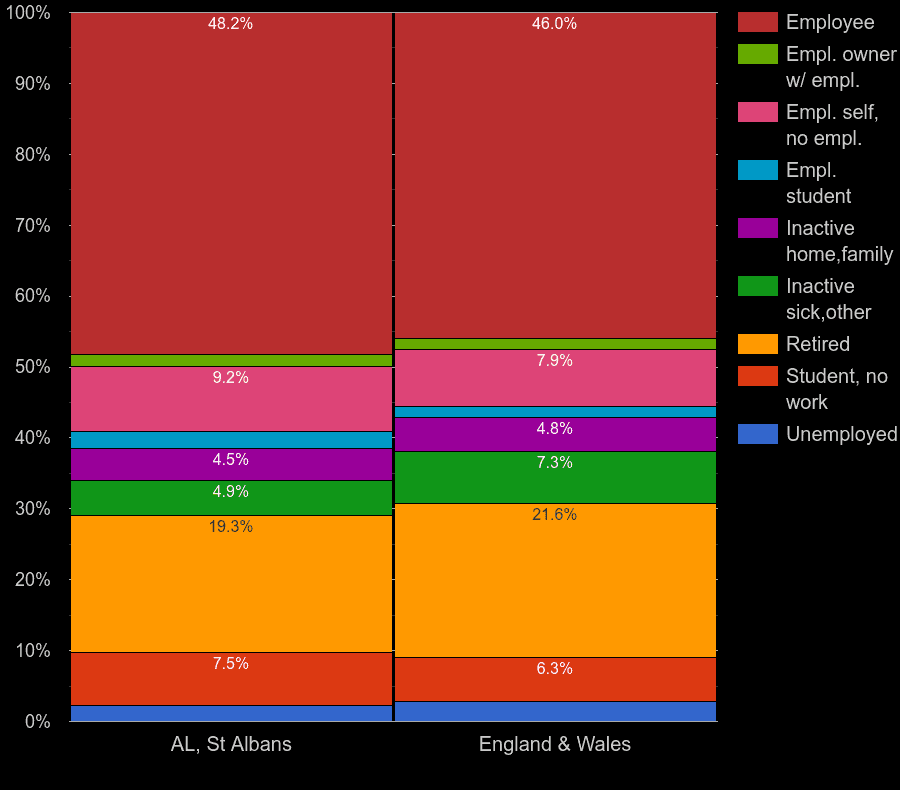
Economic Activity Share: St Albans postcode area Compared to England & Wales (2021 Census)| Economic activity | St Albans postcode area | England & Wales (UK) |
|---|
| Employee | 48.2% | 46.0% |
| Empl. owner w/ empl. | 1.7% | 1.5% |
| Empl. self, no empl. | 9.2% | 7.9% |
| Empl. student | 2.4% | 1.7% |
| Inactive home,family | 4.5% | 4.8% |
| Inactive sick,other | 4.9% | 7.3% |
| Retired | 19.3% | 21.6% |
| Student, no work | 7.5% | 6.3% |
| Unemployed | 2.3% | 2.8% |
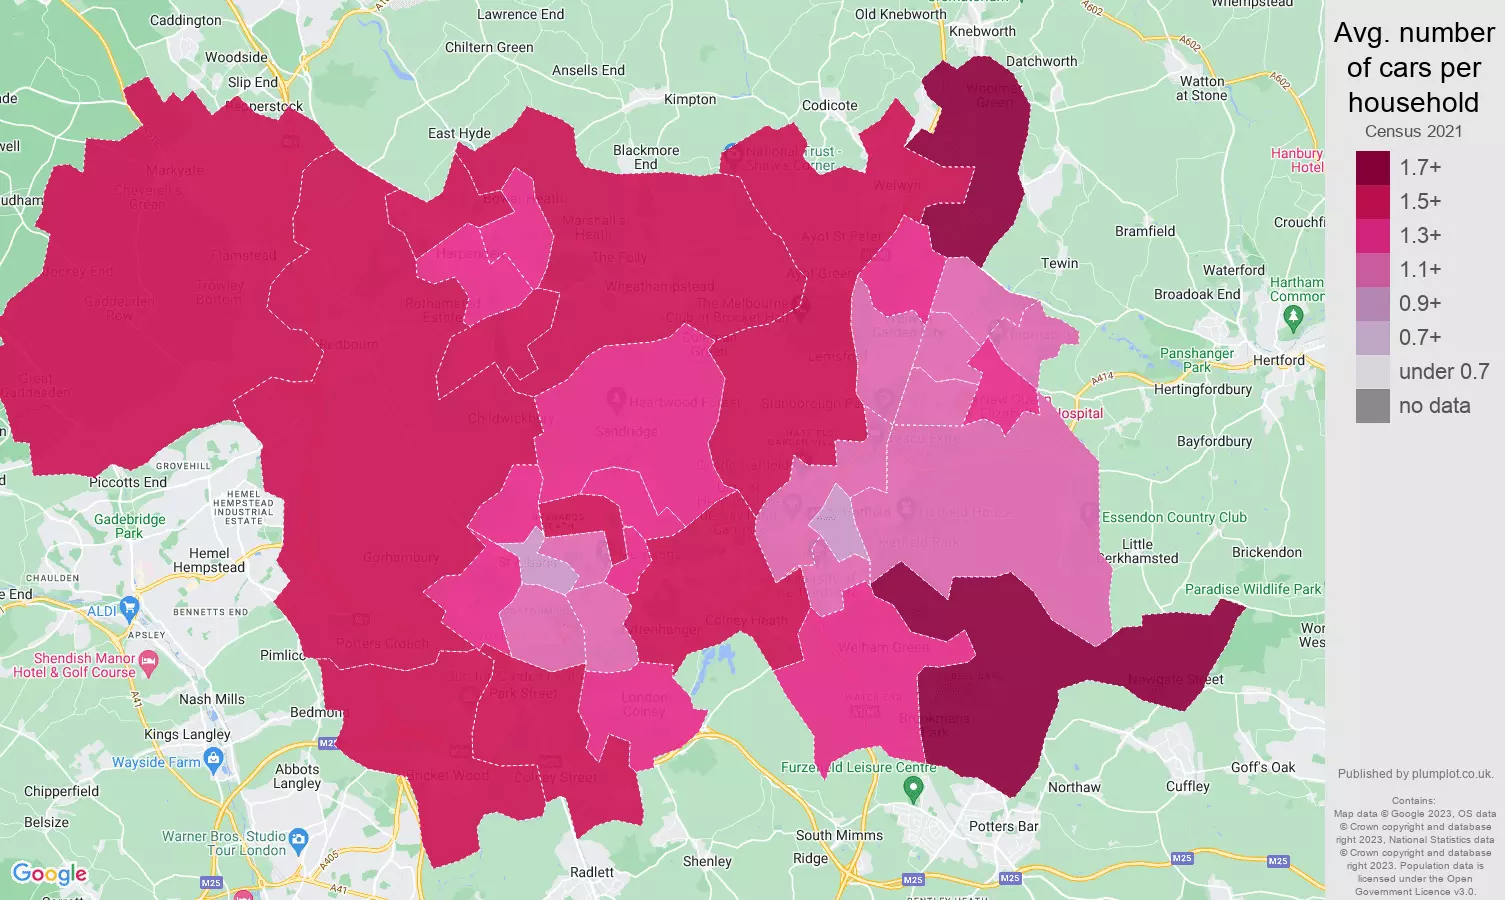
St Albans car availability in a household
On average, there are 1.39 cars per household in St Albans postcode area. In England and Wales it's 1.23 cars per household.
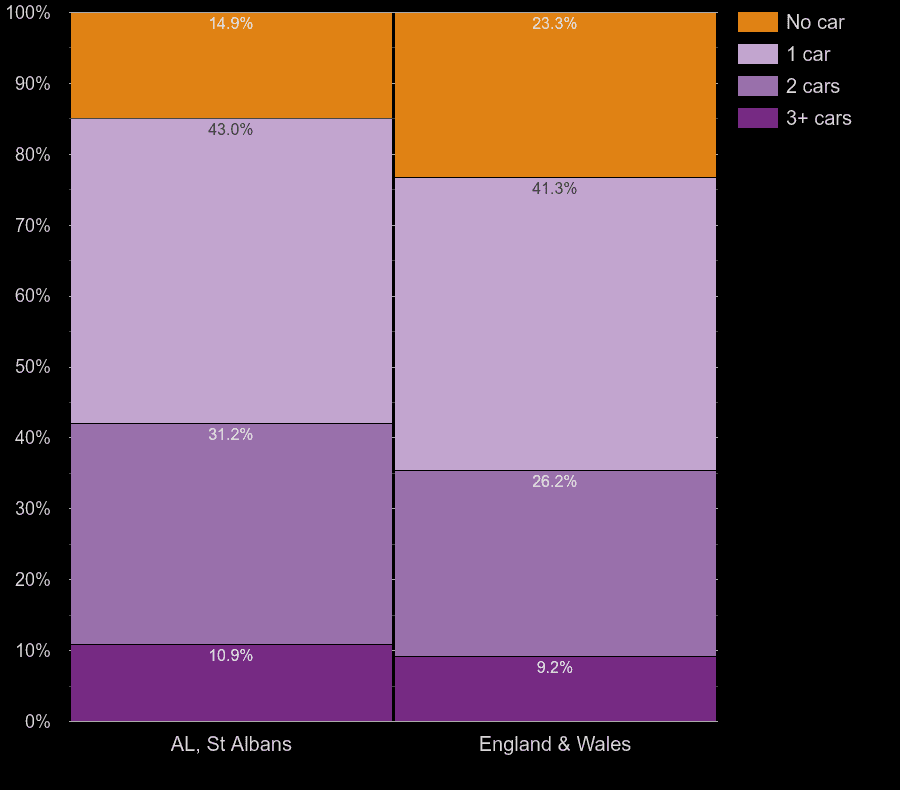
Number of Cars in a Household Share: St Albans postcode area Compared to England & Wales (2021 Census)| Number of cars in a household | St Albans postcode area | England & Wales (UK) |
|---|
| No car | 14.9% | 23.3% |
| 1 car | 43.0% | 41.3% |
| 2 cars | 31.2% | 26.2% |
| 3+ cars | 10.9% | 9.2% |
St Albans household deprivation
A : very good .. E : very bad. A : household is not deprived, B : deprived in 1 dimension, ... E : household is deprived in all four dimensions (education, employment, health, housing).
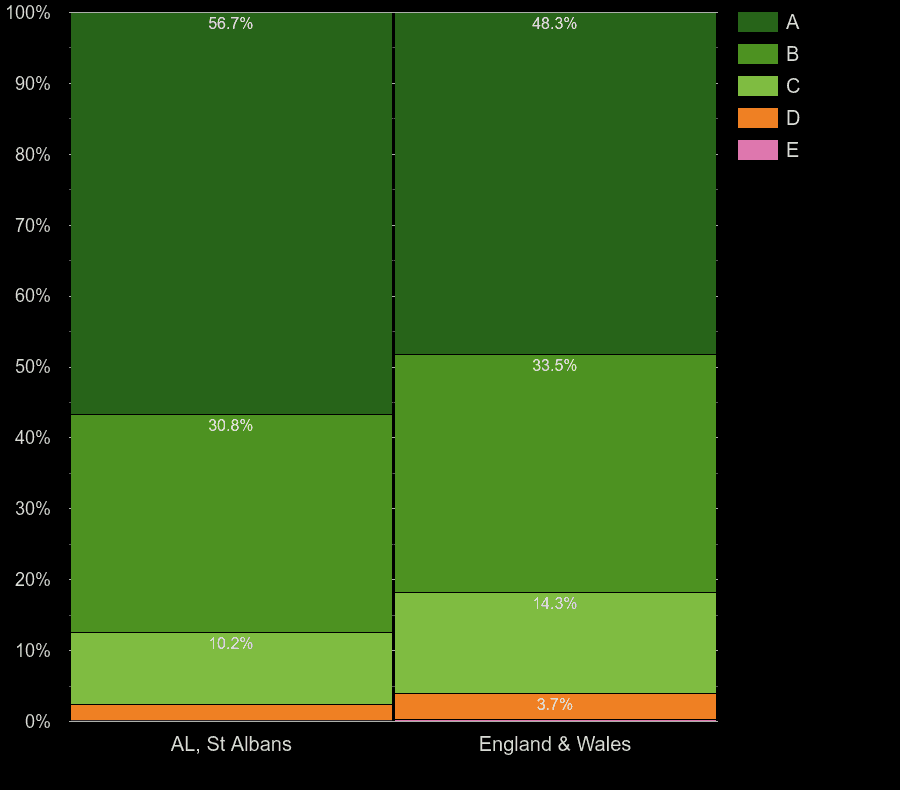
Household Deprivation Share: St Albans postcode area Compared to England & Wales (2021 Census)| Household deprivation | St Albans postcode area | England & Wales (UK) |
|---|
| A | 56.7% | 48.3% |
| B | 30.8% | 33.5% |
| C | 10.2% | 14.3% |
| D | 2.2% | 3.7% |
| E | 0.1% | 0.2% |
St Albans population partnership
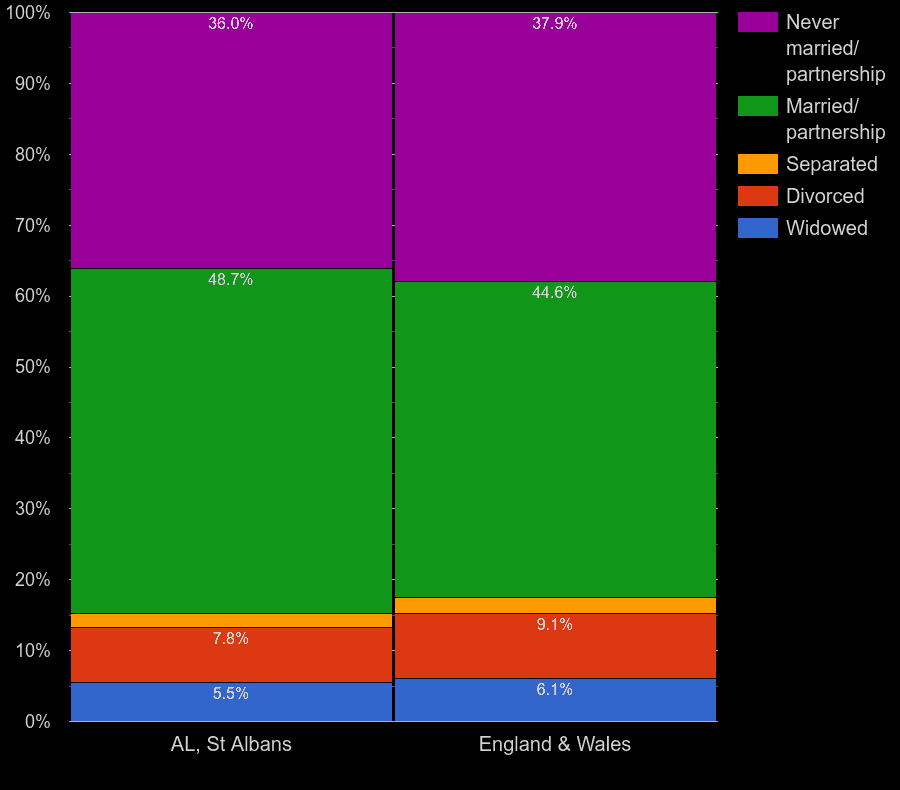
Partnership Share: St Albans postcode area Compared to England & Wales (2021 Census)| Partnership | St Albans postcode area | England & Wales (UK) |
|---|
| Never married/partnership | 36.0% | 37.9% |
| Married/partnership | 48.7% | 44.6% |
| Separated | 1.9% | 2.2% |
| Divorced | 7.8% | 9.1% |
| Widowed | 5.5% | 6.1% |
Plumplot area insights
St Albans cars per household map.webp
This map shows the average number of cars per a household in a given postcode sector.
Next for St Albans postcode area


 login →