Annual crime rate in Sheffield postcode area is 30.2, i.e. 30.2 crimes committed per annum per 1000 workday people. Compared to the national crime rate, Sheffield's crime rate is at 100%. Violent crime makes up 24.5% of all crimes committed in the postcode area. The total number of "violent crime" is 40.1k, and this number has increased by 16% when compared year-over-year in the period of January 2018 - December 2018.
30.2
annual crime rate per 1k workday people
100%
of national crime rate
24.5%
of all crimes
40.1k
crimes committed
16%
annual change
Sheffield violent crime rate comparison map
January 2018 - December 2018
Postcode sector
Crime rate vs. ENG & WLS rate
Crime rate per 1000 workday people
Total number of crimes
S1 2
129%
39
689
S1 4
141%
43
802
S10 1
38%
12
133
S10 2
27%
8
154
S10 3
32%
10
104
S10 4
39%
12
56
S10 5
33%
10
78
S11 7
43%
13
91
S11 8
70%
21
287
S11 9
34%
10
89
S12 2
67%
20
187
S12 3
130%
39
259
S12 4
104%
31
322
S13 7
137%
41
338
S13 8
152%
46
445
S13 9
79%
24
207
S14 1
247%
75
514
S17 3
62%
19
107
S17 4
70%
21
125
S18 1
23%
7
41
S18 2
28%
9
51
S18 3
13%
4
6
S18 4
42%
13
20
S18 7
48%
15
20
S18 8
15%
5
25
S2 1
134%
40
392
S2 2
142%
43
417
S2 3
138%
42
356
S2 4
76%
23
217
S2 5
71%
21
298
S20 1
89%
27
157
S20 2
23%
7
30
S20 3
27%
8
14
S20 4
55%
16
39
S20 5
83%
25
87
S20 6
21%
6
15
S20 7
116%
35
116
S20 8
154%
47
144
S21 1
37%
11
62
S21 2
33%
10
13
S21 3
29%
9
26
S21 4
43%
13
84
S21 5
29%
9
7
S25 1
79%
24
22
S25 2
113%
34
295
S25 3
118%
36
72
S25 4
72%
22
111
S25 5
66%
20
36
S26 1
31%
9
13
S26 2
69%
21
91
S26 3
107%
32
67
S26 4
129%
39
173
S26 5
89%
27
111
S26 6
95%
29
87
S26 7
82%
25
38
S3 7
67%
20
331
S3 8
76%
23
198
S3 9
139%
42
244
S32 1
25%
8
14
S32 2
15%
4
3
S32 3
14%
4
5
S32 4
38%
12
5
S32 5
15%
5
4
S33 0
27%
8
11
S33 6
29%
9
12
S33 7
20%
6
2
S33 8
44%
13
11
S33 9
23%
7
8
S35 0
79%
24
119
S35 1
69%
21
114
S35 2
86%
26
124
S35 3
55%
17
81
S35 4
112%
34
148
S35 7
64%
19
41
S35 8
61%
18
62
S35 9
74%
22
123
S36 1
102%
31
165
S36 2
75%
23
115
S36 3
100%
30
5
S36 4
48%
15
10
S36 6
90%
27
144
S36 7
63%
19
27
S36 8
41%
12
17
S36 9
50%
15
38
S4 7
107%
32
344
S4 8
128%
39
322
S40 1
105%
32
289
S40 2
86%
26
291
S40 3
19%
6
44
S40 4
54%
16
139
S41 0
40%
12
150
S41 7
77%
23
258
S41 8
54%
16
202
S41 9
43%
13
112
S42 5
66%
20
212
S42 6
39%
12
100
S42 7
28%
8
33
S43 1
60%
18
120
S43 2
81%
24
126
S43 3
70%
21
259
S43 4
53%
16
167
S44 5
84%
25
205
S44 6
67%
20
225
S45 0
31%
9
14
S45 8
50%
15
38
S45 9
76%
23
205
S5 0
183%
55
488
S5 6
143%
43
503
S5 7
212%
64
750
S5 8
194%
59
648
S5 9
159%
48
345
S6 1
102%
31
321
S6 2
84%
26
253
S6 3
114%
34
261
S6 4
99%
30
284
S6 5
102%
31
203
S6 6
46%
14
80
S60 1
246%
74
487
S60 2
90%
27
423
S60 3
60%
18
136
S60 4
79%
24
112
S60 5
100%
30
416
S61 1
128%
39
293
S61 2
99%
30
298
S61 3
183%
55
308
S61 4
195%
59
435
S62 5
157%
47
243
S62 6
129%
39
246
S62 7
156%
47
294
S63 0
165%
50
368
S63 5
52%
16
22
S63 6
137%
42
289
S63 7
68%
20
288
S63 8
144%
43
223
S63 9
182%
55
352
S64 0
162%
49
325
S64 5
127%
38
79
S64 8
108%
33
339
S64 9
247%
75
518
S65 1
152%
46
523
S65 2
153%
46
476
S65 3
145%
44
323
S65 4
153%
46
277
S66 1
71%
21
91
S66 2
118%
36
276
S66 3
81%
24
89
S66 7
156%
47
396
S66 8
72%
22
228
S66 9
163%
49
235
S7 1
91%
28
203
S7 2
37%
11
81
S70 1
175%
53
451
S70 2
232%
70
461
S70 3
171%
52
408
S70 4
217%
65
398
S70 5
114%
34
210
S70 6
157%
47
325
S71 1
153%
46
468
S71 2
132%
40
281
S71 3
151%
46
463
S71 4
146%
44
327
S71 5
159%
48
356
S72 0
157%
47
112
S72 7
150%
45
211
S72 8
137%
41
423
S72 9
98%
30
95
S73 0
92%
28
312
S73 8
182%
55
354
S73 9
124%
37
217
S74 0
124%
37
239
S74 8
90%
27
74
S74 9
121%
37
196
S75 1
82%
25
173
S75 2
84%
25
246
S75 3
68%
20
163
S75 4
43%
13
52
S75 5
93%
28
181
S75 6
106%
32
171
S8 0
60%
18
186
S8 7
130%
39
389
S8 8
117%
35
352
S8 9
78%
24
159
S80 1
177%
54
428
S80 2
161%
49
529
S80 3
49%
15
108
S80 4
85%
26
195
S81 0
93%
28
272
S81 7
107%
32
257
S81 8
41%
12
100
S81 9
96%
29
174
S9 1
64%
19
414
S9 2
37%
11
63
S9 3
39%
12
163
S9 4
83%
25
208
S9 5
68%
20
178
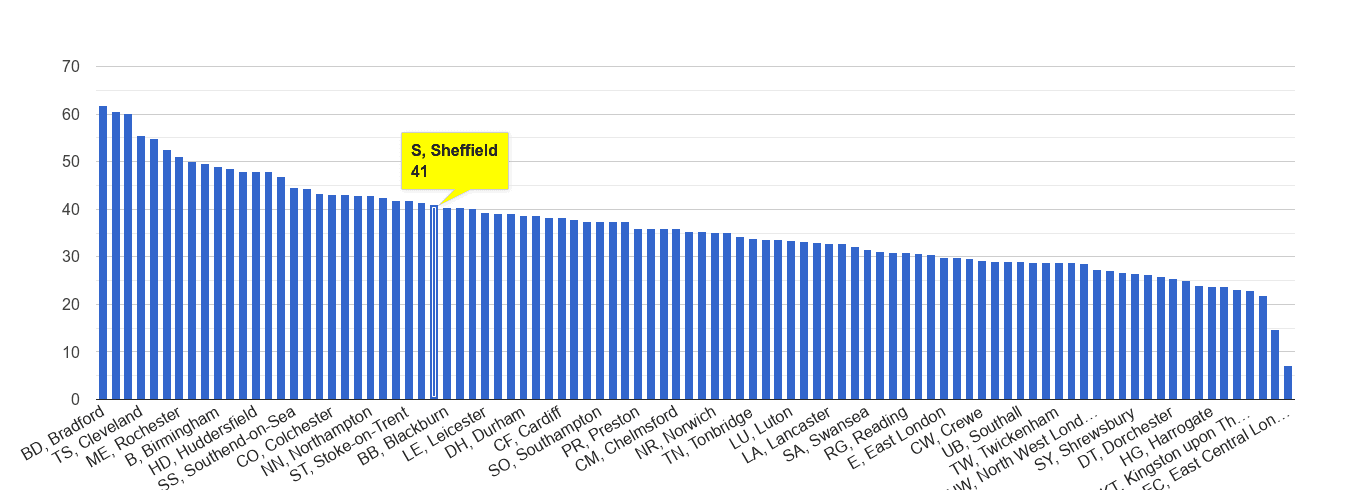
Sheffield violent crime rate rank
Violent crime rate is 30.2 crimes committed per 1,000 working people per annum. It's the 44. highest crime rate out of 104 England and Wales' postcode areas.
44.
highest crime rate out of 104 postcode areas
30.2
annual crime rate per 1k workday people
Sheffield violent crime rate compared to other areas
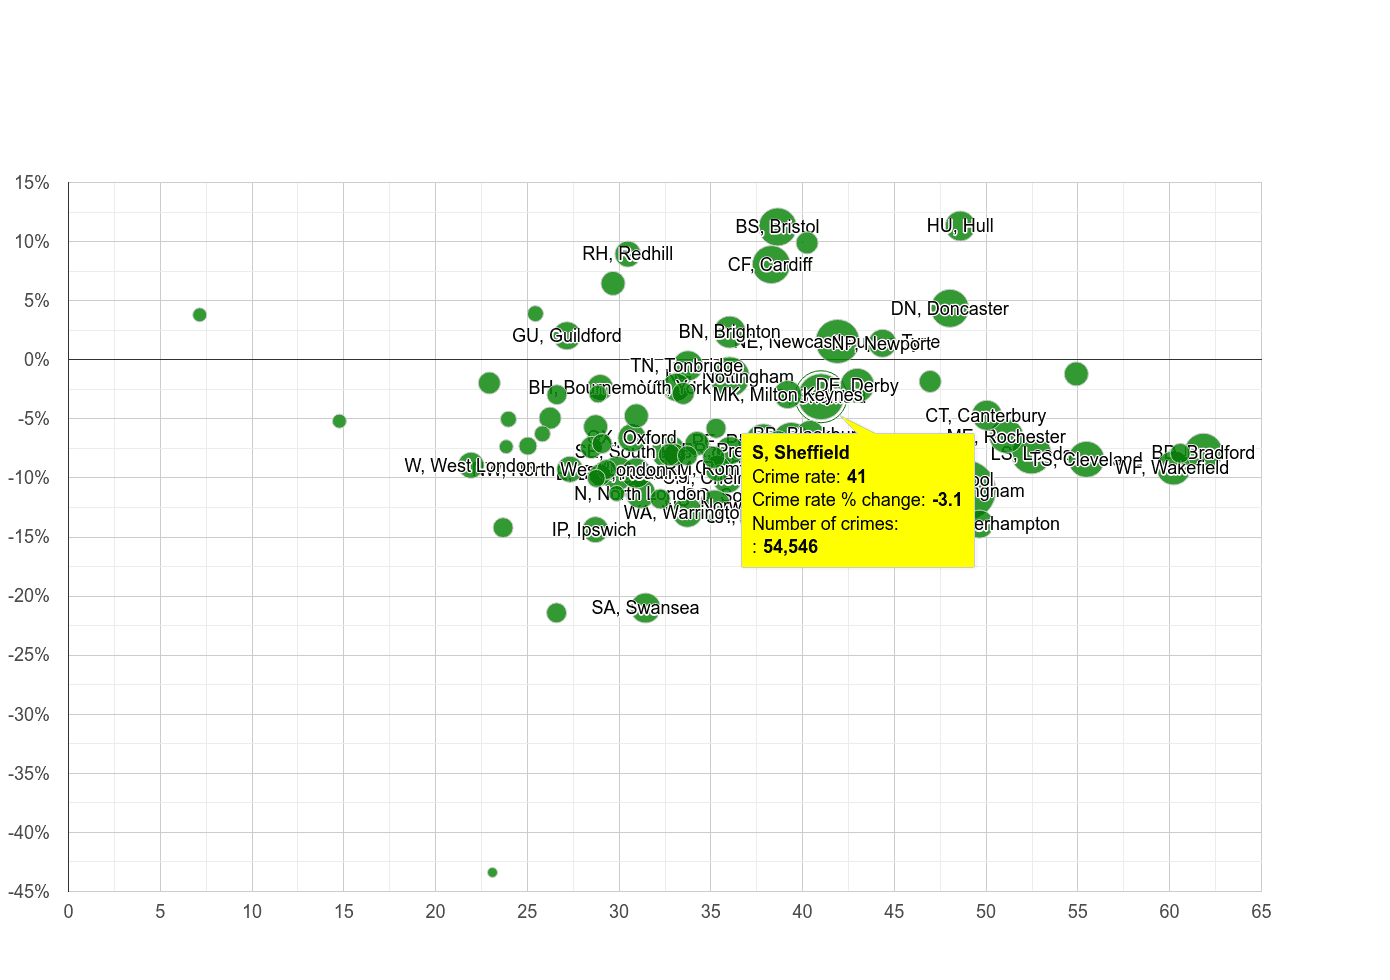
The total number of "violent crime" is 40.1k, and this number has increased by 16% when compared year-over-year in the period of January 2018 - December 2018. In the graph below, postcode area are compared by crime rate and crime rate percentage change. Crime rate percentage change compares the postcode area crime rate between January 2018 - December 2018 to the postcode area crime rate in the previous 12 months. The size of the circle reflects the number of total crimes committed. The bigger the circle, the higher the number of crimes committed in the postcode area.
16%
annual change
30.2
annual crime rate per 1k workday people
40.1k
crimes committed
Crime rate percentage changeCrime rate per 1000 workday people
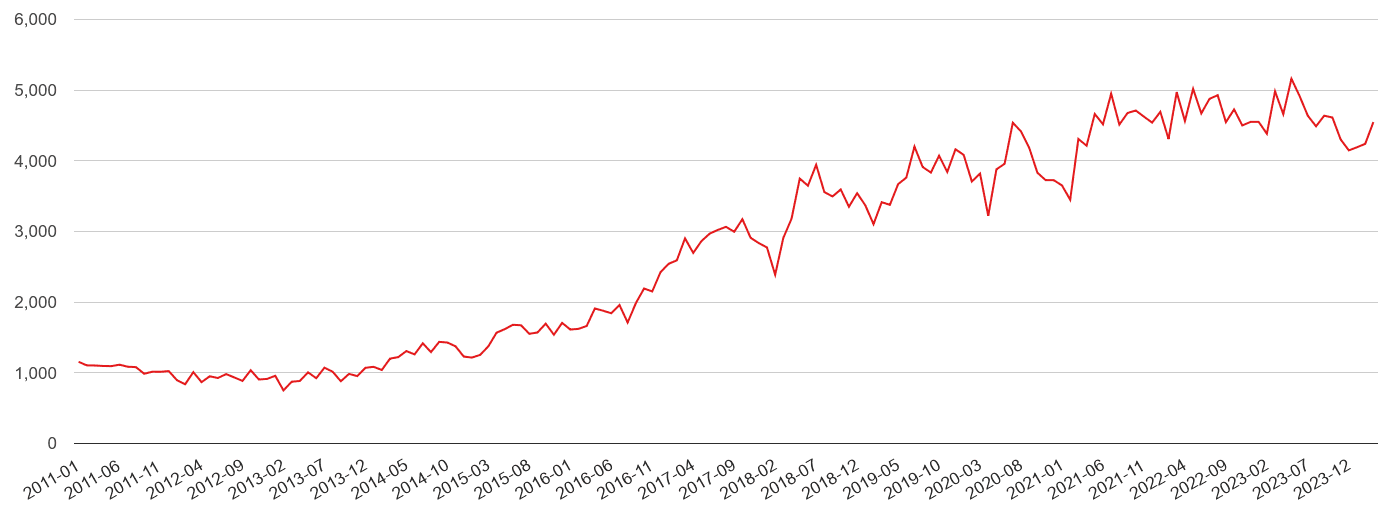
Sheffield violent crime rate
Annual crime rate per 1000 workday people
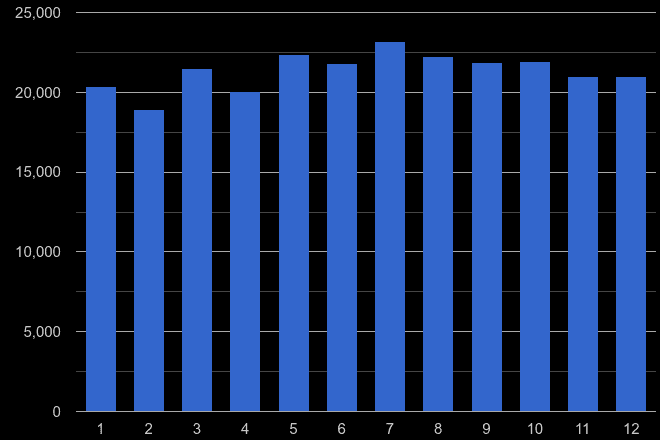
Sheffield violent crime seasonality
Total number of crimes commited in a given calendar month(1 = January … 12 = December) in the previous five years.