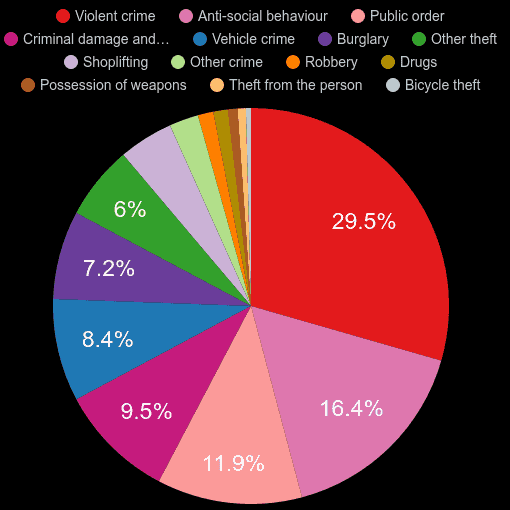
The category of "public order crime" is the highest ranking crime category when category crime rate is compared to the national average. "Public order crime" rate is at 253% of national crime rate which puts Oldham on 2. position out of 104 England's and Wales' postcode areas in this crime category. "Public order crime" makes up 11.9% of all crimes committed in the area. The total number of "public order crime" is 8.6k cases and has increased by 6.2% when compared year-over-year in the period of January 2018 - December 2018.
For details,
click on the crime name with '→'
253%
of national crime rate2.
highest crime rate out of 104 postcode areas11.9%
of all crimes8.6k
crimes committed6.2%
annual change221%
of national crime rate1.
highest crime rate out of 104 postcode areas2.4%
of all crimes1.7k
crimes committed28.7%
annual change166%
of national crime rate10.
highest crime rate out of 104 postcode areas8.4%
of all crimes6.1k
crimes committed11.1%
annual change160%
of national crime rate7.
highest crime rate out of 104 postcode areas0.8%
of all crimes559
crimes committed28.8%
annual change157%
of national crime rate7.
highest crime rate out of 104 postcode areas7.2%
of all crimes5.2k
crimes committed-5.0%
annual change156%
of national crime rate5.
highest crime rate out of 104 postcode areas9.5%
of all crimes6.9k
crimes committed-9.0%
annual change156%
of national crime rate6.
highest crime rate out of 104 postcode areas29.5%
of all crimes21.3k
crimes committed10.2%
annual change143%
of national crime rate16.
highest crime rate out of 104 postcode areas1.3%
of all crimes917
crimes committed14.5%
annual change111%
of national crime rate25.
highest crime rate out of 104 postcode areas4.5%
of all crimes3.2k
crimes committed6.3%
annual change108%
of national crime rate32.
highest crime rate out of 104 postcode areas16.4%
of all crimes11.9k
crimes committed-25.1%
annual change104%
of national crime rate31.
highest crime rate out of 104 postcode areas6.0%
of all crimes4.4k
crimes committed1.3%
annual change78%
of national crime rate38.
lowest crime rate out of 104 postcode areas1.2%
of all crimes863
crimes committed6.2%
annual change63%
of national crime rate40.
highest crime rate out of 104 postcode areas0.7%
of all crimes494
crimes committed-5.4%
annual change40%
of national crime rate12.
lowest crime rate out of 104 postcode areas0.4%
of all crimes299
crimes committed-15.5%
annual change