Northamptonshire house energy costs
January 2026
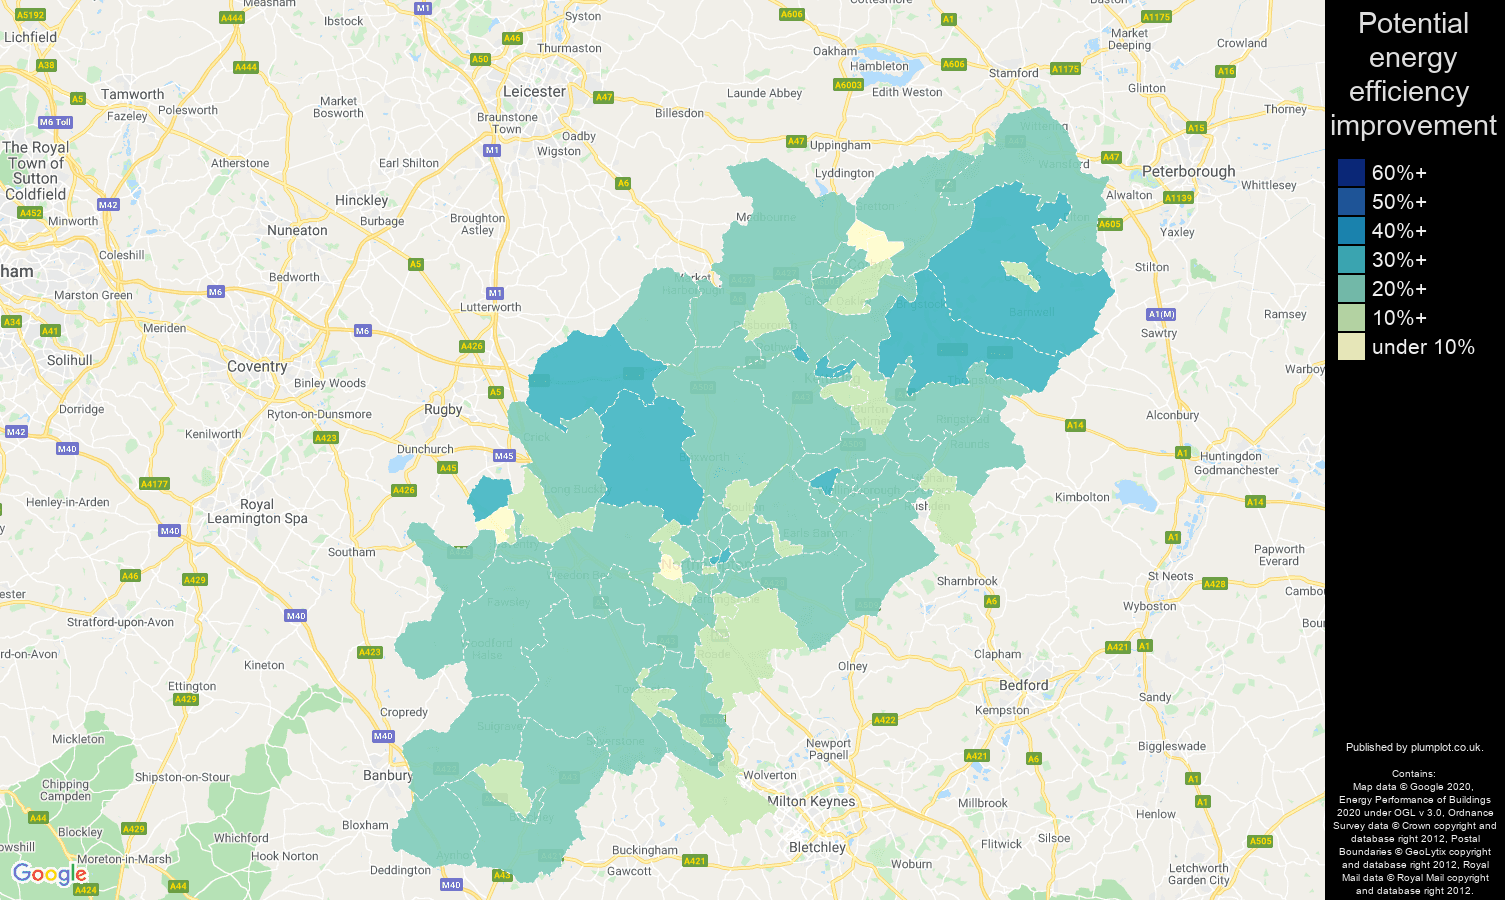
The average yearly heating cost per house was £806 in the last 10 years in Northamptonshire county. This is by £57.8 less than the average cost in England and Wales in the same period. On average, the heating cost could be reduced by 23.7% to £615.
Northamptonshire houses by heating cost per square meters
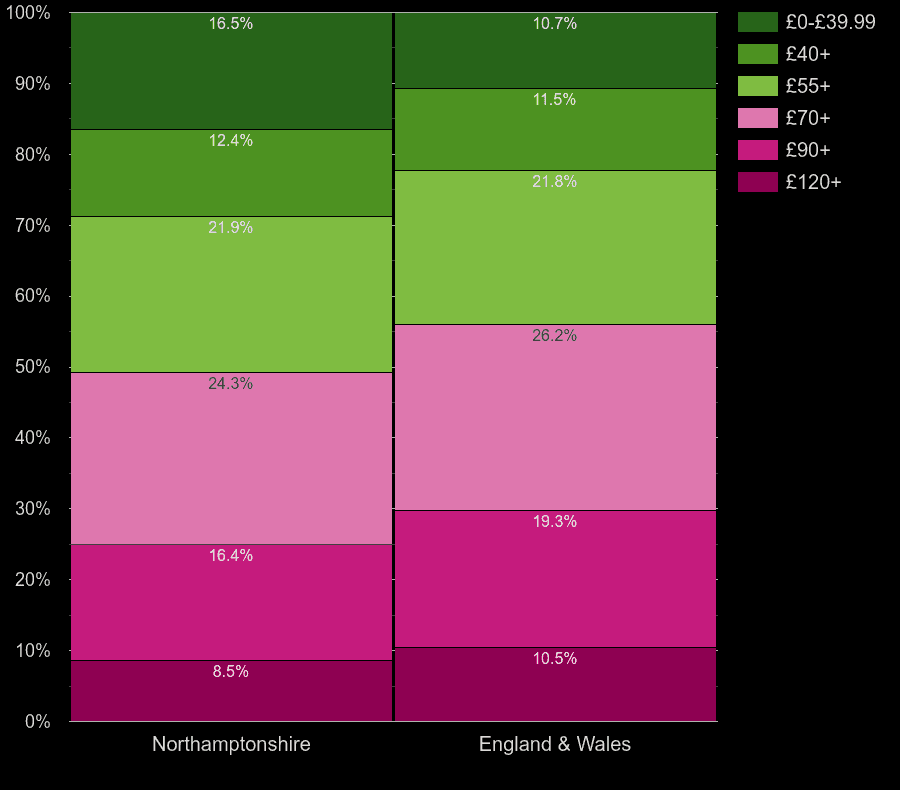
| Heating cost per 10m² per year | Northamptonshire | England & Wales |
|---|
| █ £0-£39.99 | 14.3% | 9.4% |
| █ £40+ | 10.6% | 9.9% |
| █ £55+ | 19.2% | 18.9% |
| █ £70+ | 22.8% | 24.1% |
| █ £90+ | 18.7% | 21.0% |
| █ £120+ | 14.4% | 16.7% |
Northamptonshire map of potential energy efficiency improvement of houses
Northamptonshire houses by hot water cost per square meters
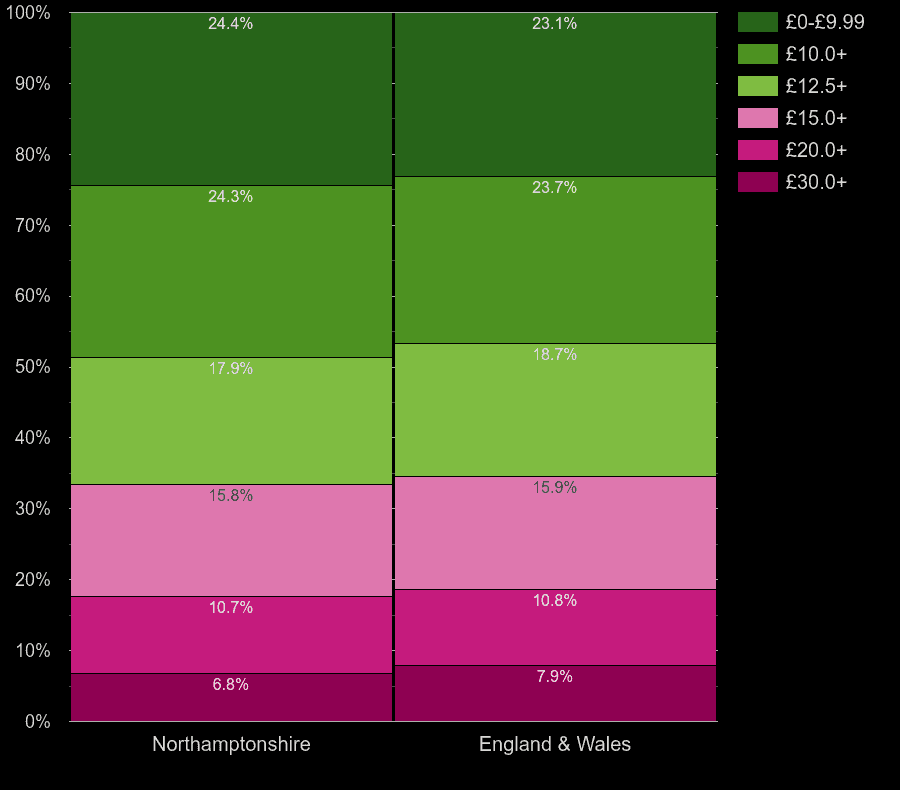
| Hot water cost per 10m² per year | Northamptonshire | England & Wales |
|---|
| █ £0-£9.99 | 21.2% | 20.1% |
| █ £10.0+ | 20.8% | 20.2% |
| █ £12.5+ | 15.9% | 16.4% |
| █ £15.0+ | 16.8% | 16.7% |
| █ £20.0+ | 15.4% | 15.3% |
| █ £30.0+ | 10.0% | 11.3% |
Northamptonshire houses by lighting cost per square meters
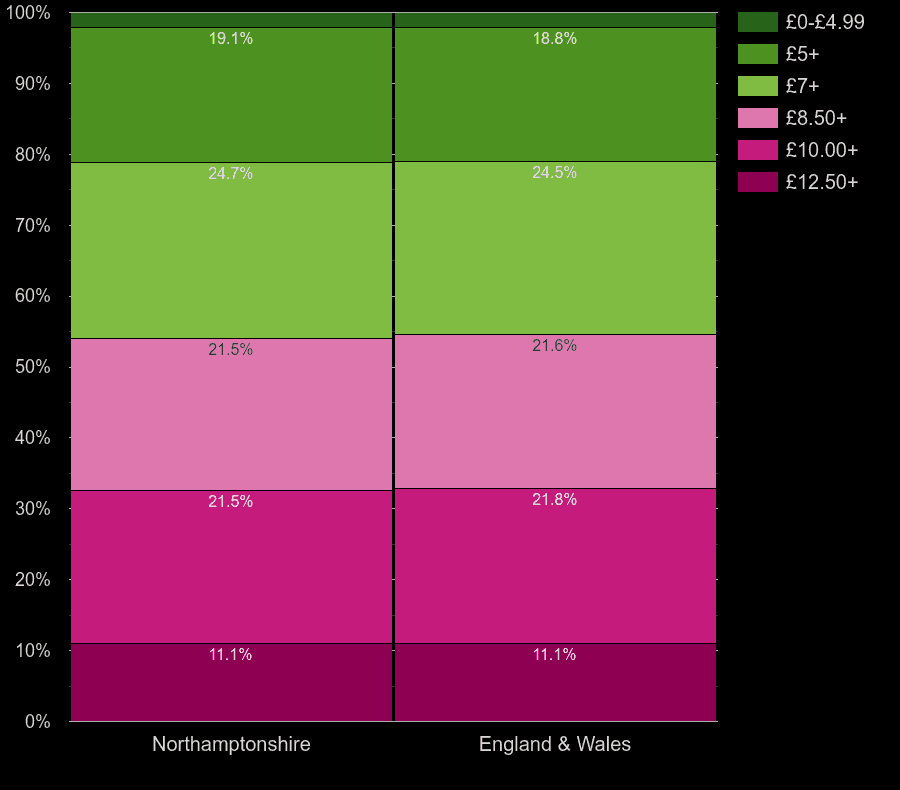
| Lighting cost per 10m² per year | Northamptonshire | England & Wales |
|---|
| █ £0-£4.99 | 2.0% | 2.0% |
| █ £5+ | 17.2% | 16.8% |
| █ £7+ | 21.9% | 21.7% |
| █ £8.50+ | 18.6% | 18.9% |
| █ £10.00+ | 22.1% | 22.3% |
| █ £12.50+ | 18.1% | 18.4% |
Northamptonshire houses by heating cost per room
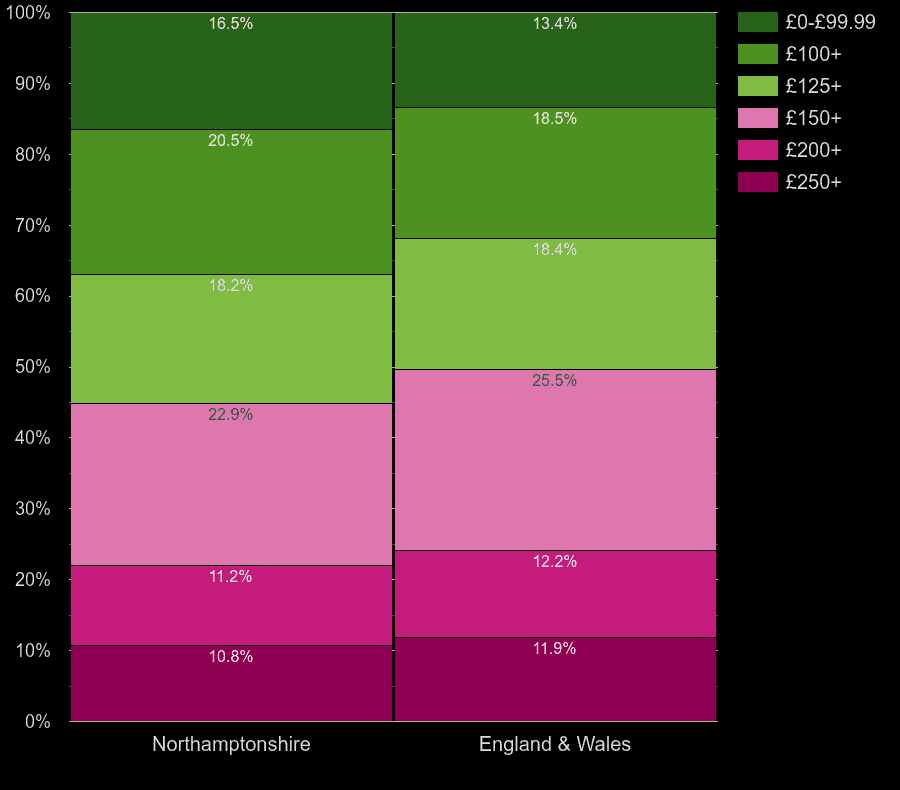
| Heating cost per habitable room | Northamptonshire | England & Wales |
|---|
| █ £0-£99.99 | 13.5% | 11.2% |
| █ £100+ | 17.5% | 15.8% |
| █ £125+ | 16.5% | 16.5% |
| █ £150+ | 23.3% | 25.0% |
| █ £200+ | 13.1% | 13.9% |
| █ £250+ | 16.1% | 17.6% |
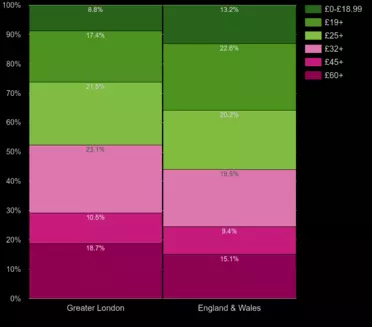
Northamptonshire houses by hot water cost per room
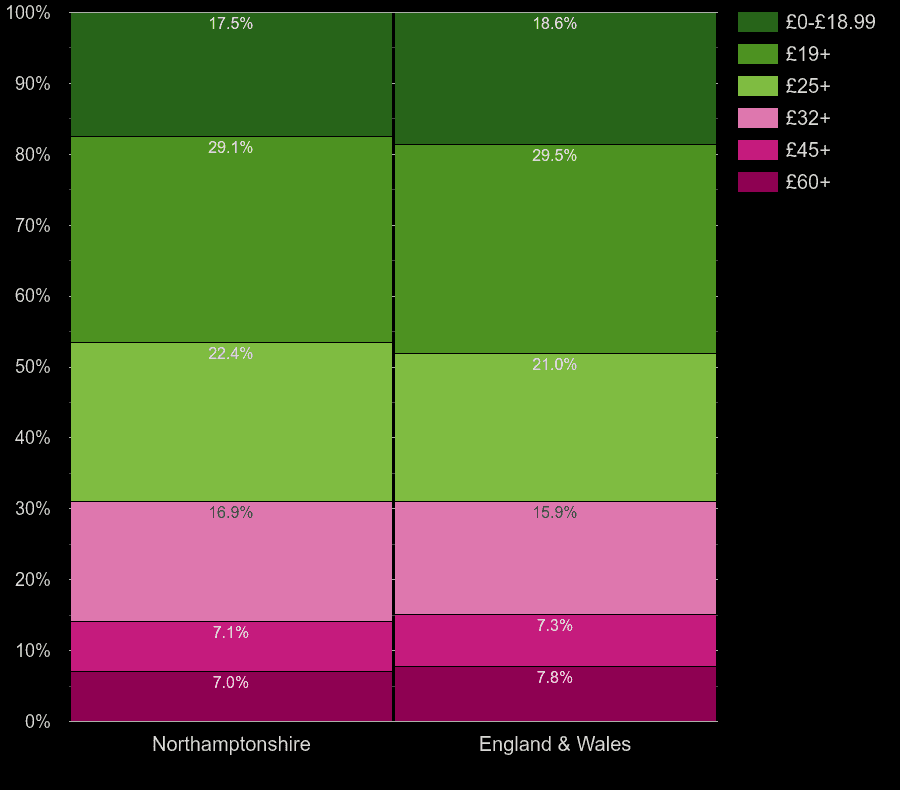
| Hot water cost per habitable room | Northamptonshire | England & Wales |
|---|
| █ £0-£18.99 | 14.5% | 15.5% |
| █ £19+ | 24.4% | 24.8% |
| █ £25+ | 20.7% | 19.5% |
| █ £32+ | 19.7% | 18.7% |
| █ £45+ | 10.5% | 10.5% |
| █ £60+ | 10.2% | 11.0% |
Northamptonshire houses by lighting cost per room
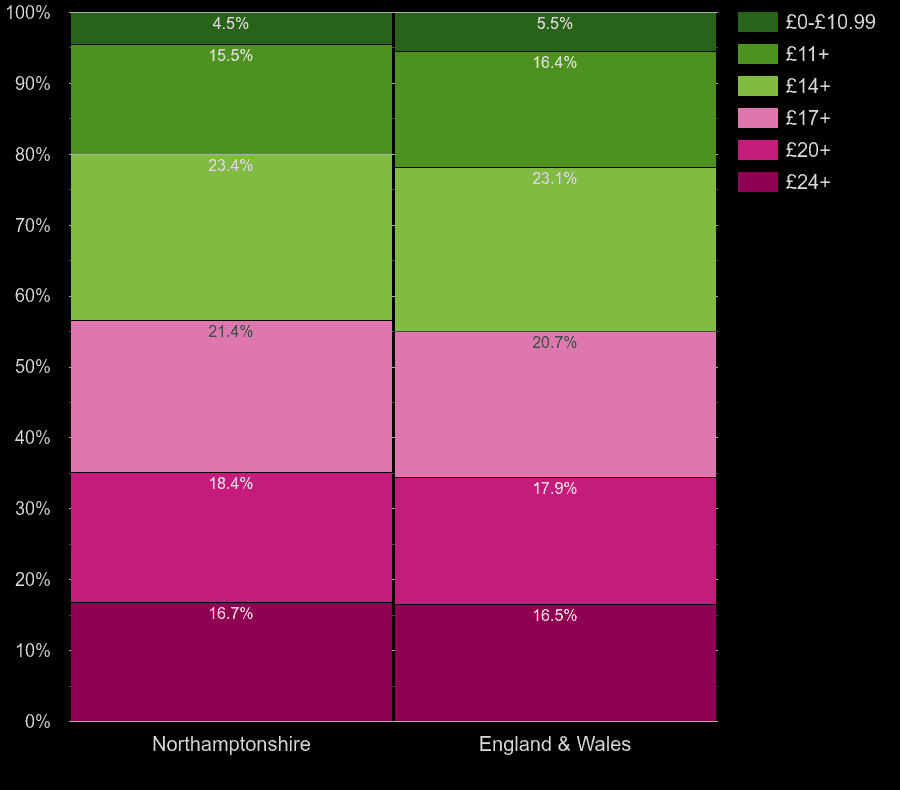
| Lighting cost per habitable room | Northamptonshire | England & Wales |
|---|
| █ £0-£10.99 | 4.0% | 4.6% |
| █ £11+ | 13.6% | 14.3% |
| █ £14+ | 20.2% | 20.1% |
| █ £17+ | 19.7% | 19.0% |
| █ £20+ | 18.7% | 18.1% |
| █ £24+ | 23.9% | 23.9% |
Plumplot area insights - interactive charts and maps

Next for Northamptonshire county


 login →