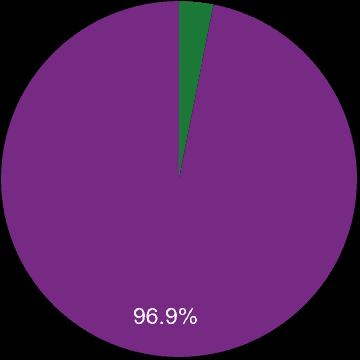
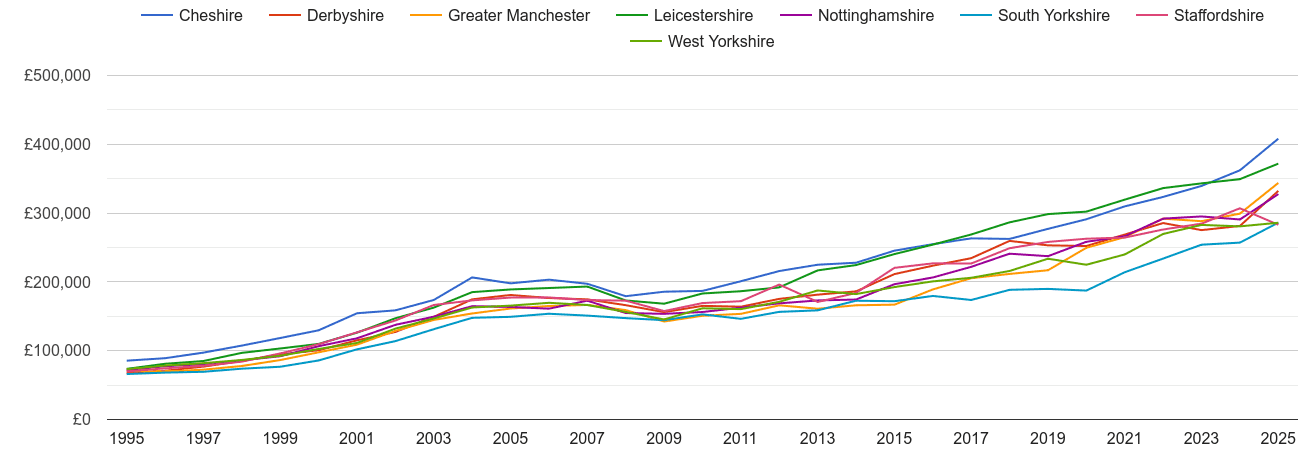
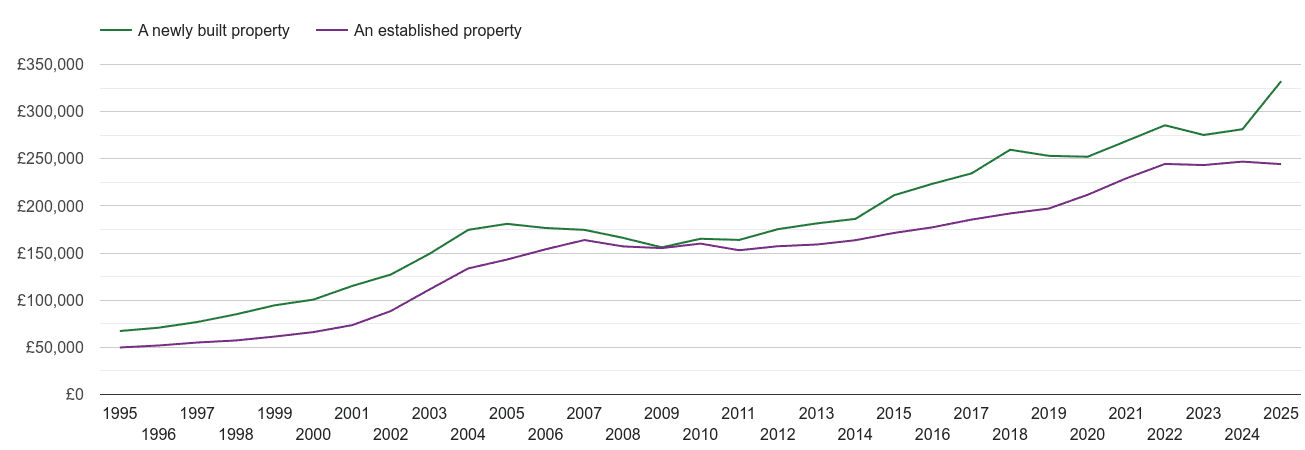
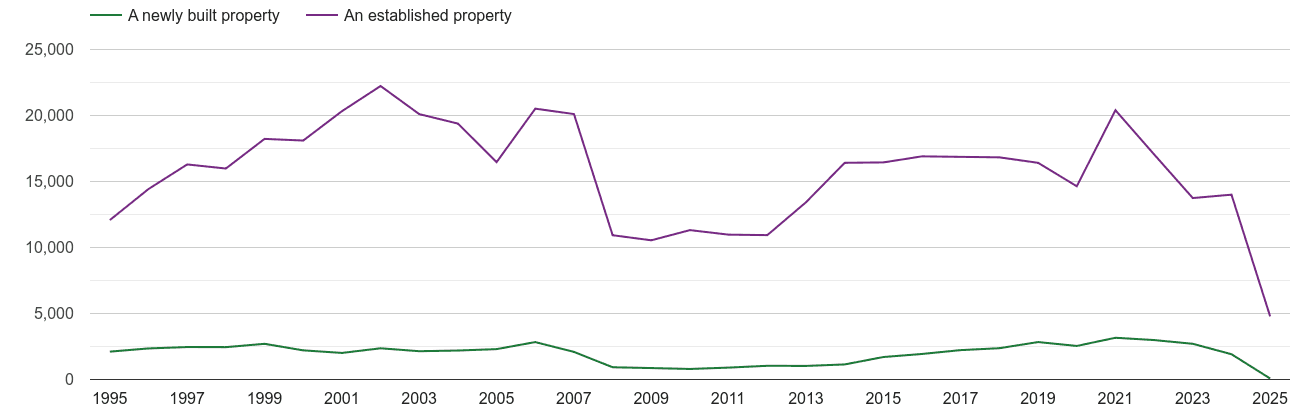
The price of a newly built property is £299k in Derbyshire county. The price increased by £19.0k (7%) over the last twelve months. The price of an established property is £251k. There were 904 sales of newly build properties. Most new properties were sold in the £300k-£400k price range with 234 (25.9%) properties sold, followed by £200k-£250k price range with 175 (19.4%) properties sold. Most new homes were sold in DE1 2, with 114 sold to date from September 2024 - August 2025.
| September 2024 - August 2025 | Derbyshire county | England & Wales |
|---|---|---|
| Average price of a new home | £299k | £388k |
Average price change | 7% £19.0k | 0% £-1.5k |
September 2024 - August 2025
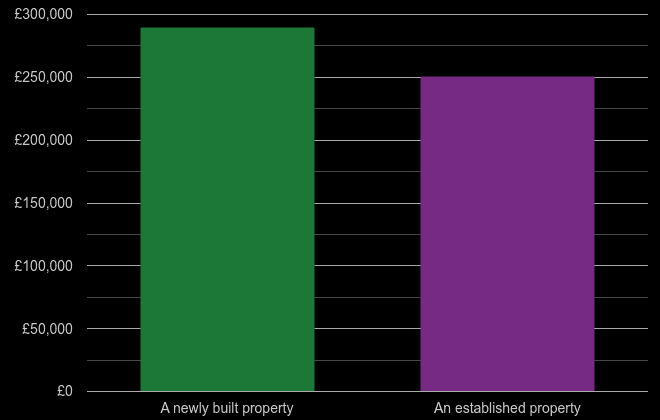
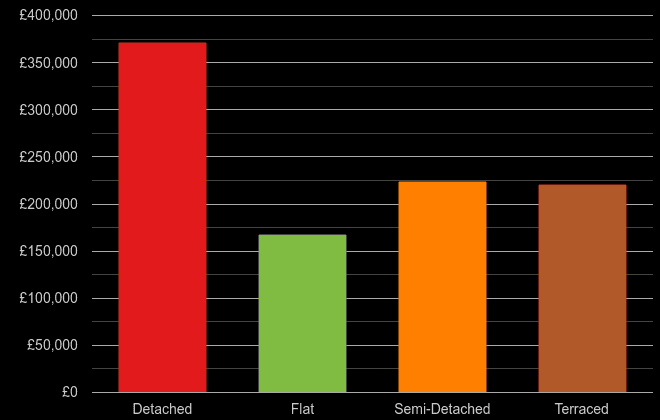
| New or established | Average price |
|---|---|
| █ A newly built property | £299k |
| █ An established property | £251k |
September 2024 - August 2025
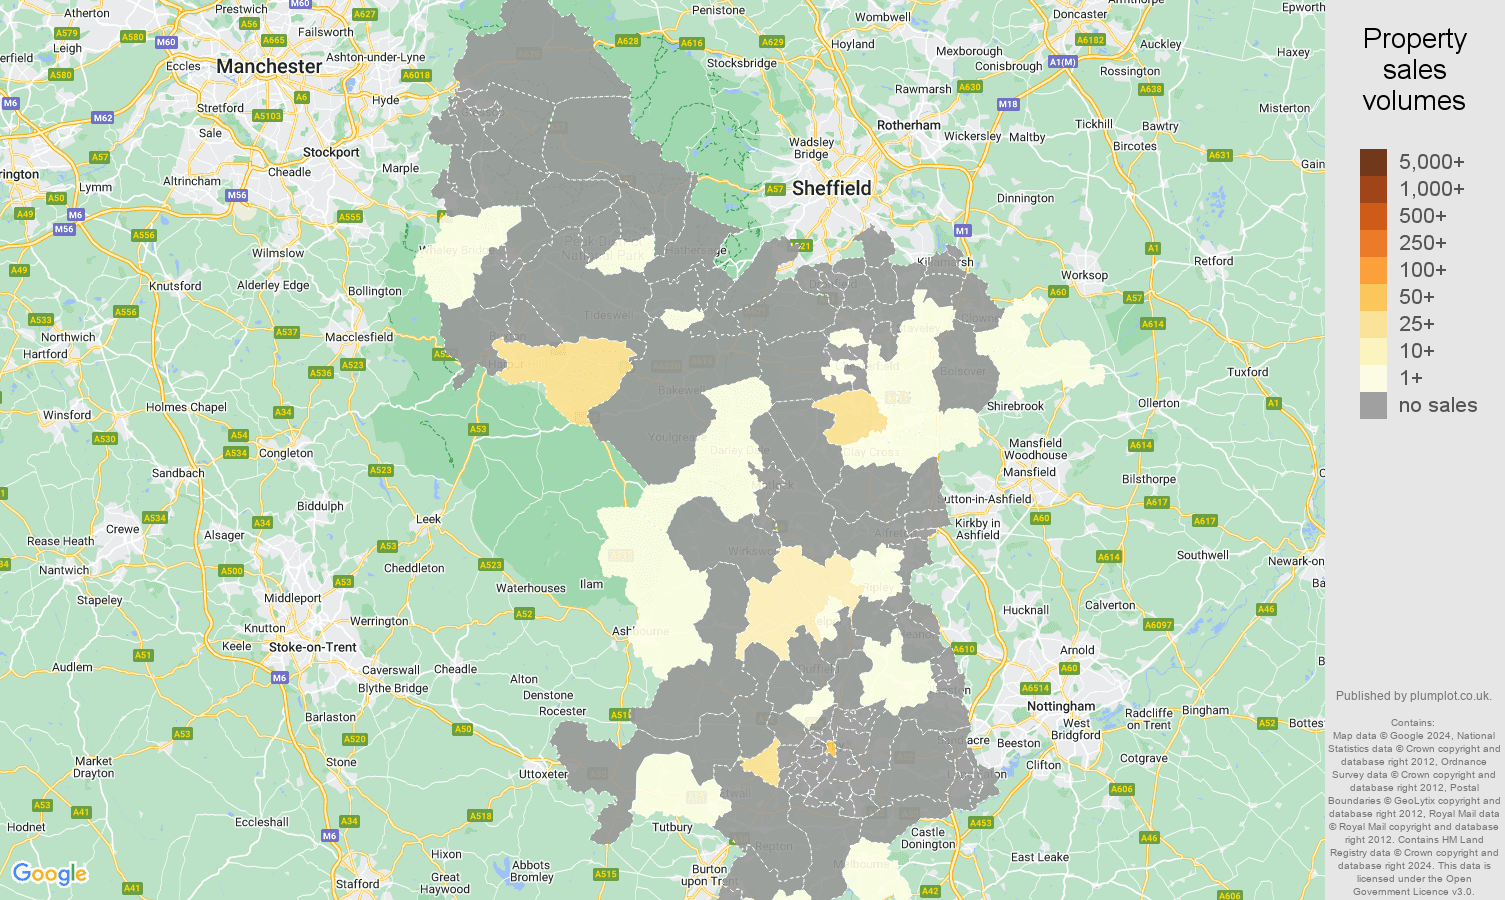
shows the total volume of new homes sold a given postcode sector.
shows a sales volume of new homes in a given price range between September 2024 - August 2025. See also Derbyshire property sales reports.
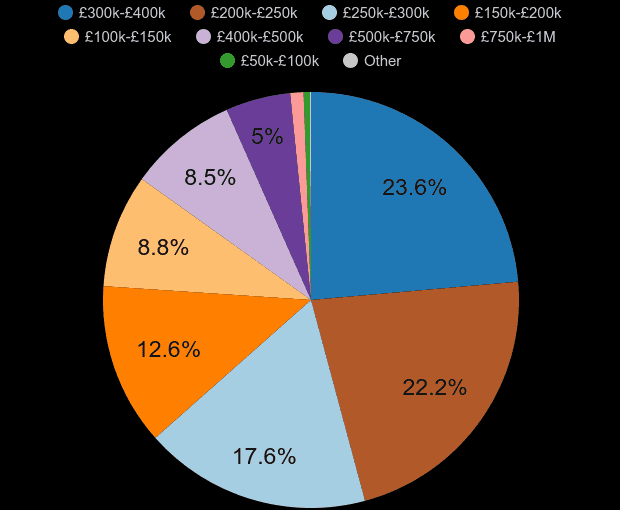
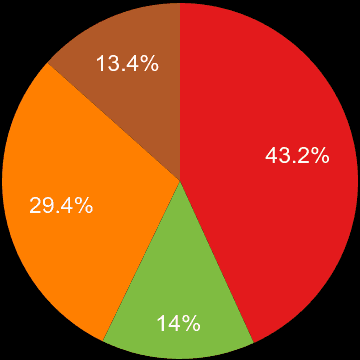
| Property price range | Market share | Sales volume |
|---|---|---|
| █ under £50k | 0.1% | 1 |
| █ £50k-£100k | 0.3% | 3 |
| █ £100k-£150k | 7.9% | 71 |
| █ £150k-£200k | 11.5% | 104 |
| █ £200k-£250k | 19.4% | 175 |
| █ £250k-£300k | 19.0% | 172 |
| █ £300k-£400k | 25.9% | 234 |
| █ £400k-£500k | 9.5% | 86 |
| █ £500k-£750k | 5.6% | 51 |
| █ £750k-£1M | 0.8% | 7 |
September 2024 - August 2025
September 2024 - August 2025
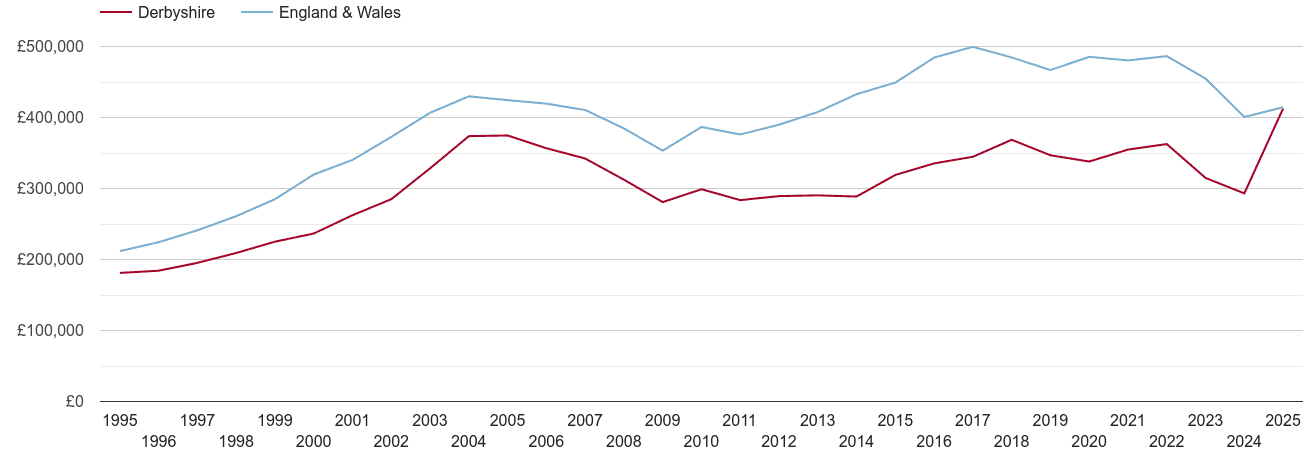
Yearly average nominal house prices adjusted for inflation
Yearly average nominal prices
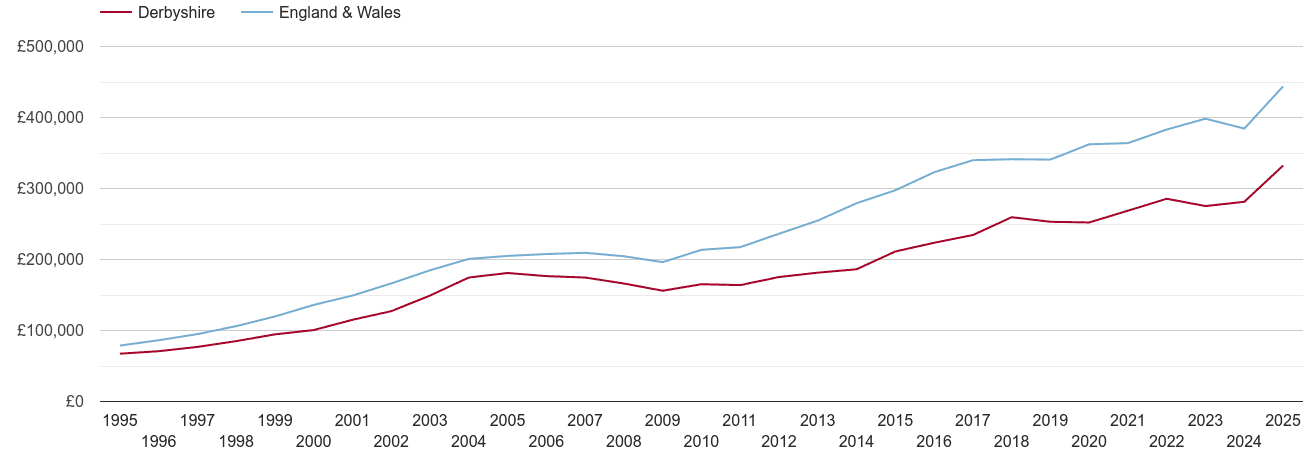
Yearly average nominal prices
Yearly average nominal prices
Total sales volumes by year


 login →


