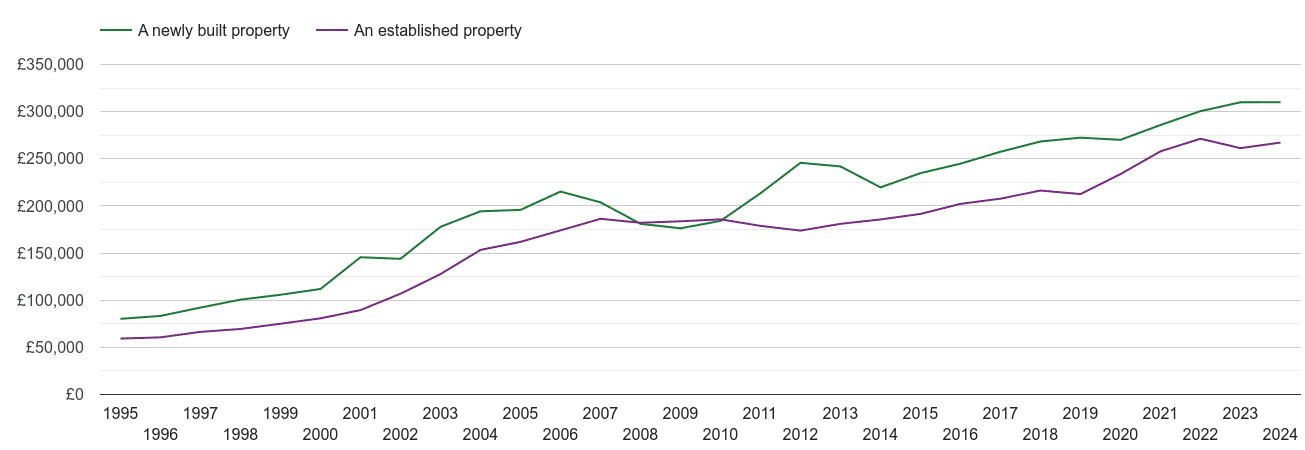
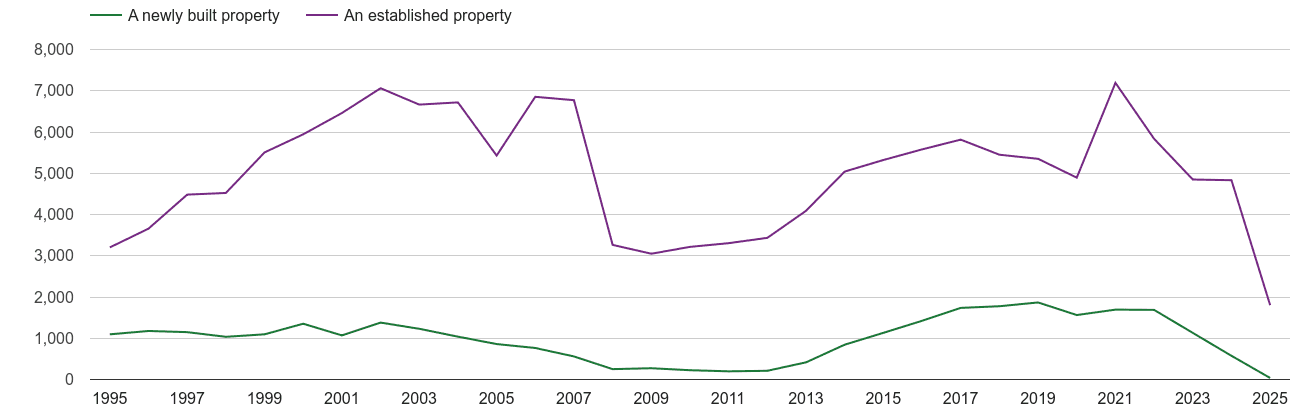
The price of a newly built property is £351k in Crewe postcode area. The price increased by £27.2k (8%) over the last twelve months. The price of an established property is £281k. There were 259 sales of newly build properties. Most new properties were sold in the £300k-£400k price range with 86 (33.2%) properties sold, followed by £400k-£500k price range with 68 (26.3%) properties sold. Most new homes were sold in CW12 2, with 38 sold to date from October 2024 - September 2025.
| October 2024 - September 2025 | Crewe postcode area | England & Wales |
|---|---|---|
| Average price of a new home | £351k | £389k |
Average price change | 8% £27.2k | 0% £568 |
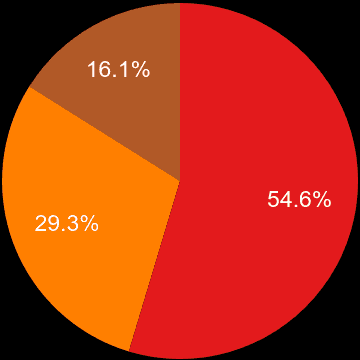
October 2024 - September 2025
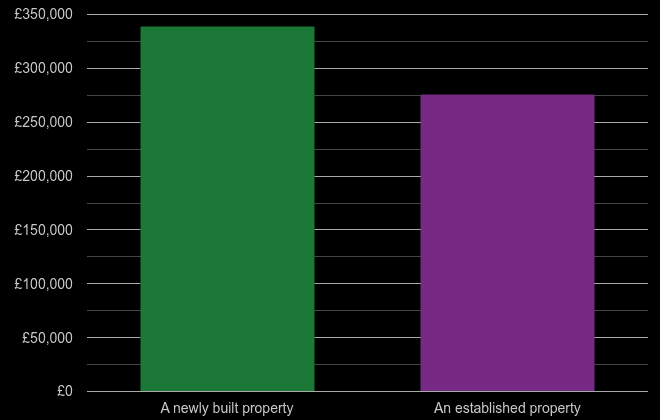
| New or established | Average price |
|---|---|
| █ A newly built property | £351k |
| █ An established property | £281k |
October 2024 - September 2025

shows the total volume of new homes sold a given postcode sector.
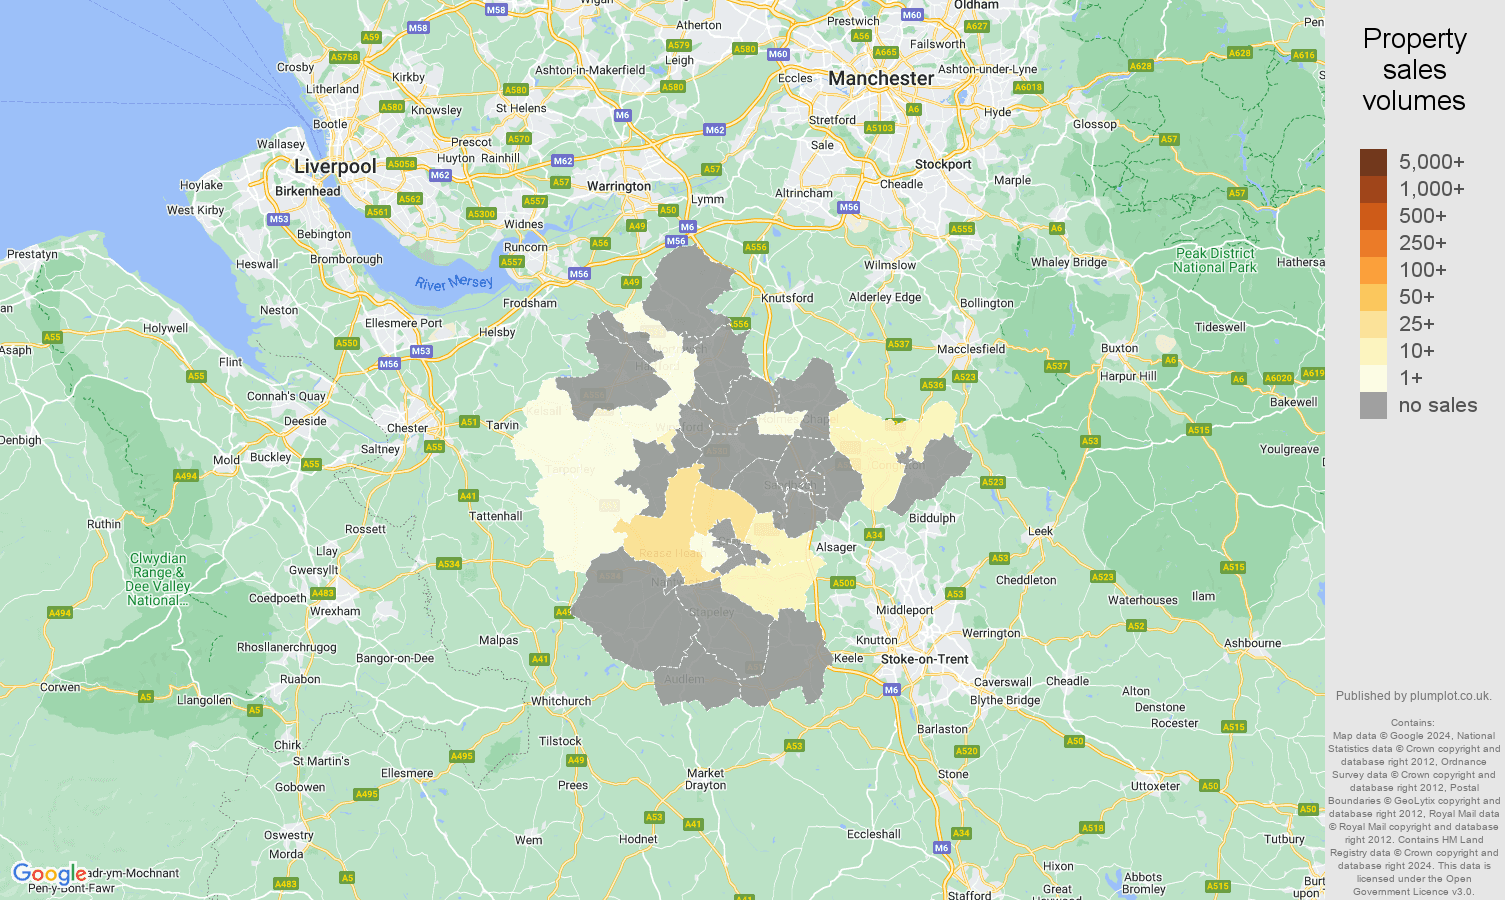
shows a sales volume of new homes in a given price range between October 2024 - September 2025. See also Crewe property sales reports.
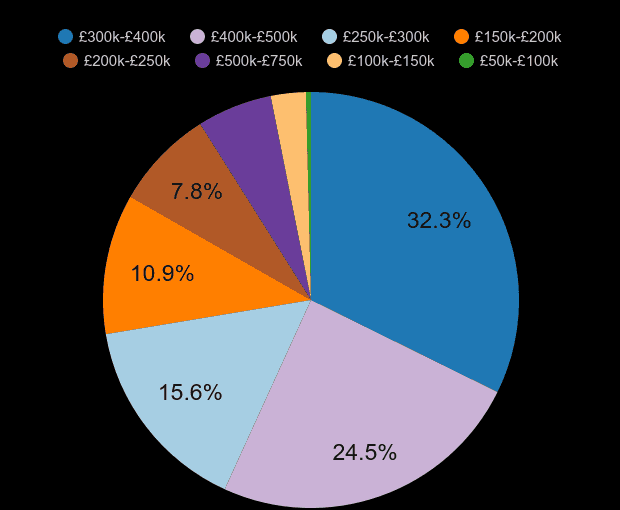
| Property price range | Market share | Sales volume |
|---|---|---|
| █ £50k-£100k | 0.4% | 1 |
| █ £100k-£150k | 1.5% | 4 |
| █ £150k-£200k | 6.9% | 18 |
| █ £200k-£250k | 6.9% | 18 |
| █ £250k-£300k | 17.8% | 46 |
| █ £300k-£400k | 33.2% | 86 |
| █ £400k-£500k | 26.3% | 68 |
| █ £500k-£750k | 6.6% | 17 |
| █ £750k-£1M | 0.4% | 1 |
October 2024 - September 2025
October 2024 - September 2025
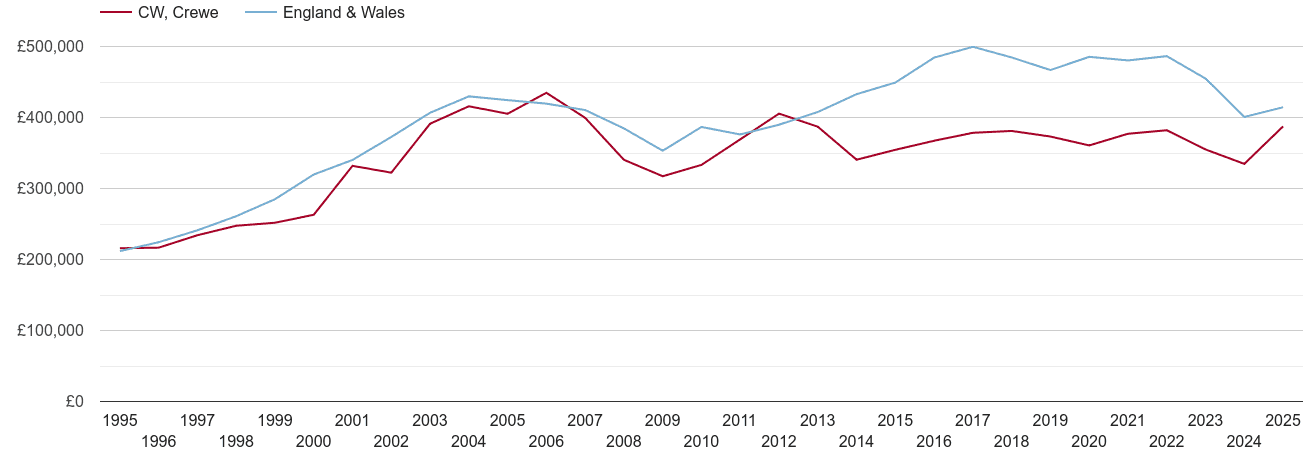
Yearly average nominal house prices adjusted for inflation
Yearly average nominal prices
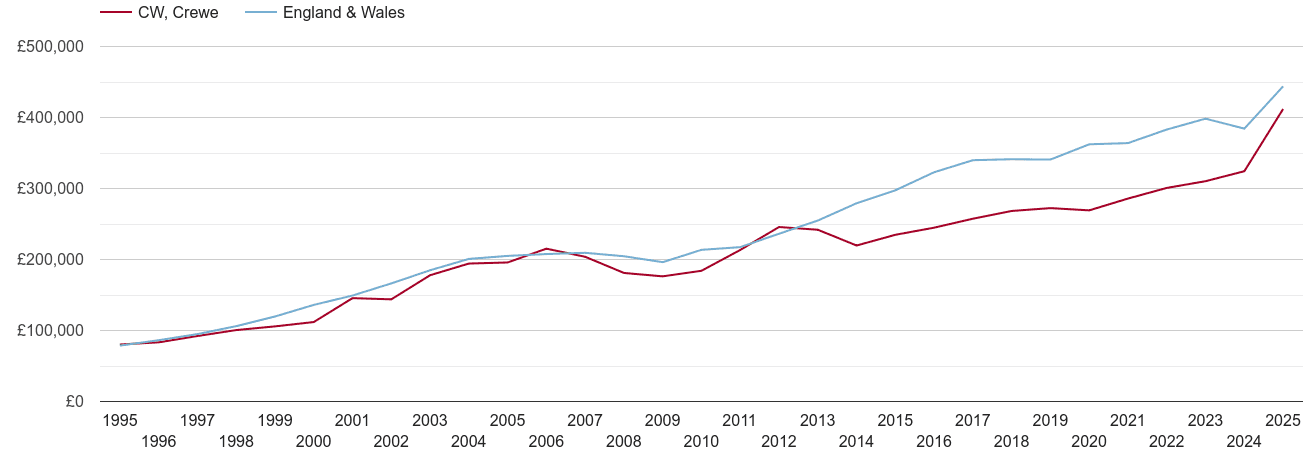
Yearly average nominal prices
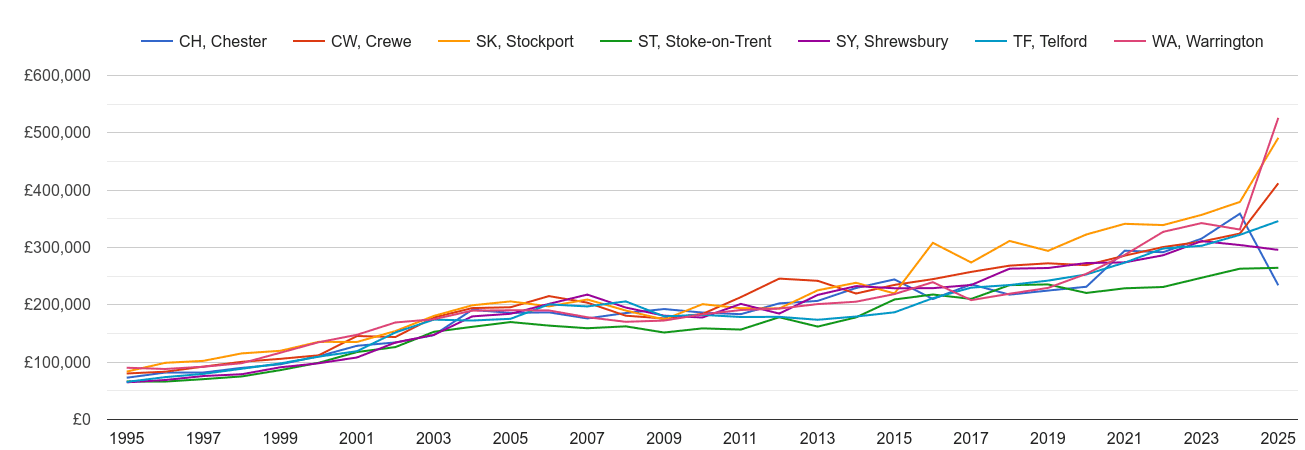
Yearly average nominal prices
Total sales volumes by year


 login →


