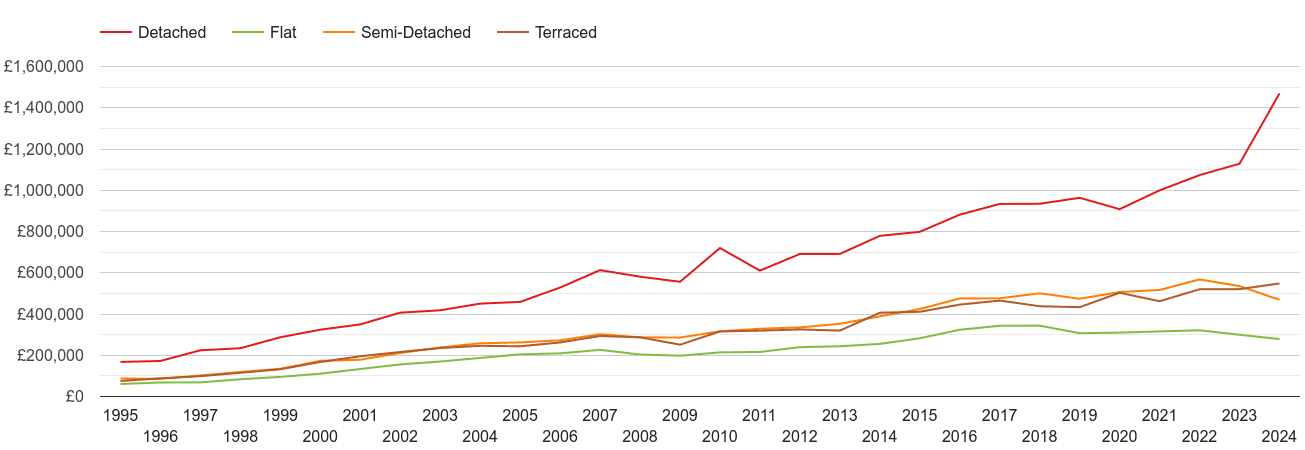
The average property price in Guildford city is £527k, the median price is £460k. The average price declined by £-55.4k (-10%) over the last twelve months. The price of an established property is £527k. The price of is £. There were 711 property sales and sales dropped by 9.0% (-78 transactions). Most properties were sold in the £500k-£750k price range with 194 (27.3%) properties sold, followed by £400k-£500k price range with 170 (23.9%) properties sold.
September 2024 - August 2025
Guildford city
England & Wales
Average price
█ £527k
█ £352k
Median price
█ £460k
█ £282k
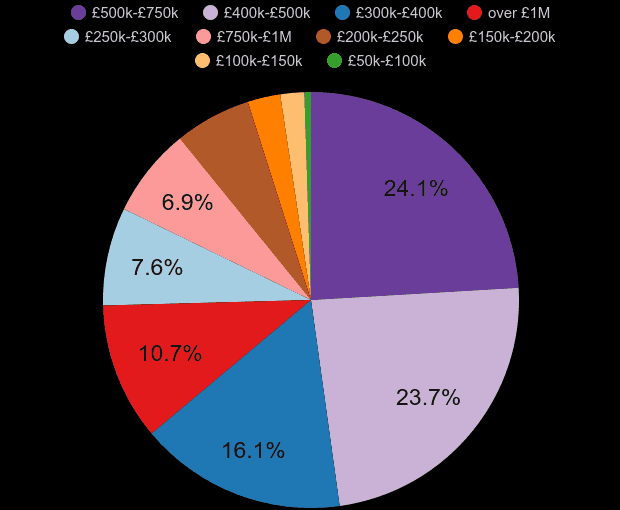
Guildford property sales share by price range
shows a number of properties sold in a given price range between September 2024 - August 2025.
Property price range
Market share
Sales volume
█ £50k-£100k
0.7%
5
█ £100k-£150k
1.1%
8
█ £150k-£200k
3.2%
23
█ £200k-£250k
6.8%
48
█ £250k-£300k
5.9%
42
█ £300k-£400k
17.6%
125
█ £400k-£500k
23.9%
170
█ £500k-£750k
27.3%
194
█ £750k-£1M
7.9%
56
█ over £1M
5.6%
40
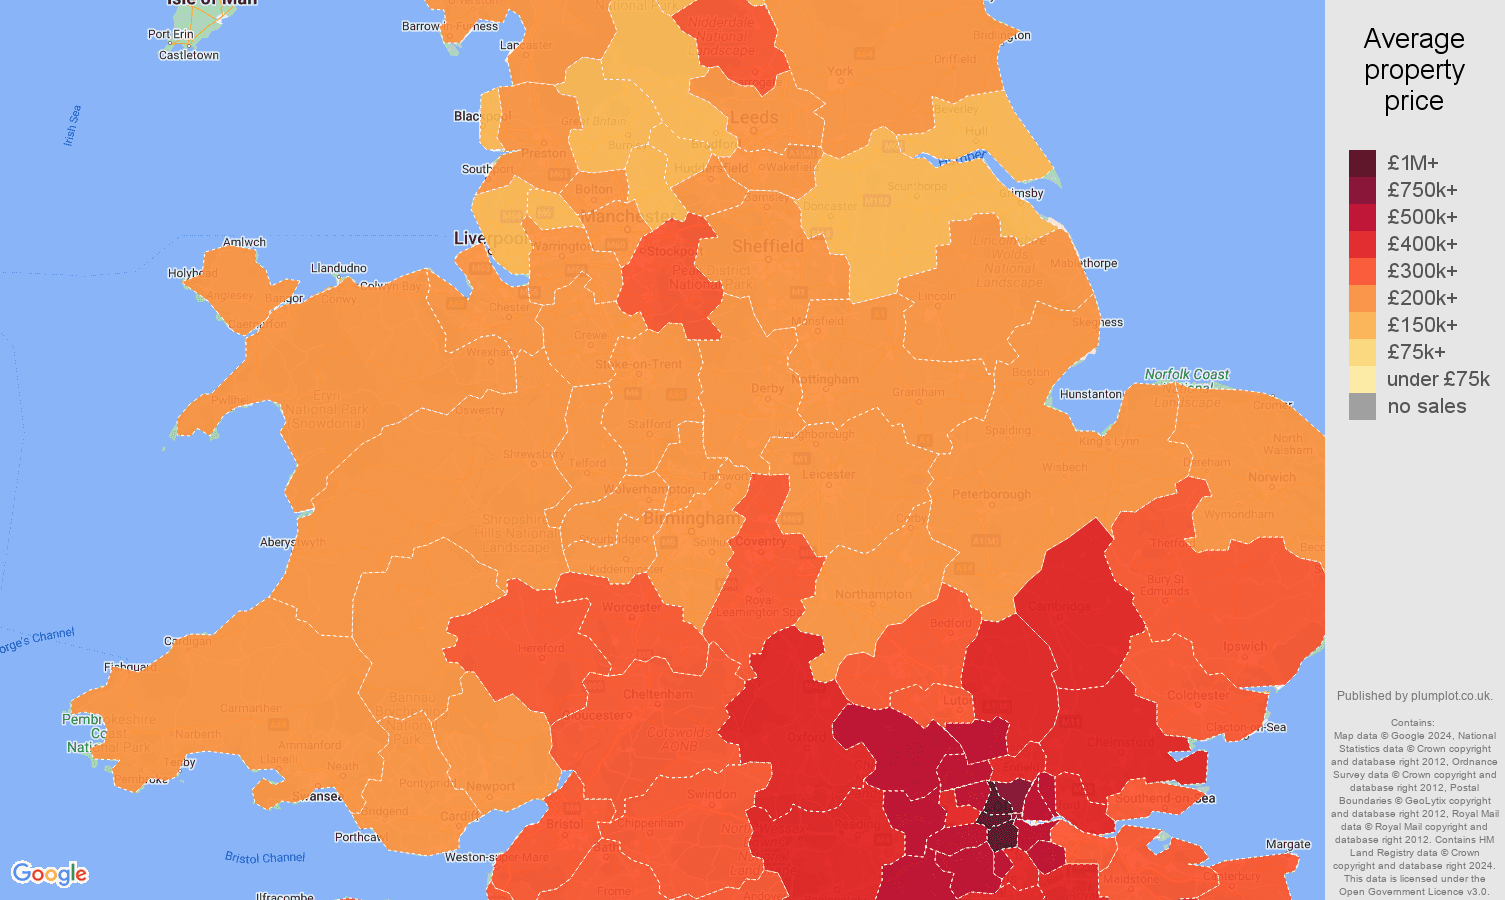
Guildford house prices map
This price map shows the average property price in a given postcode sector. The most affordable place is 'GU2 8' with the average price of £385k. The most expensive place is 'GU1 2', £671k.
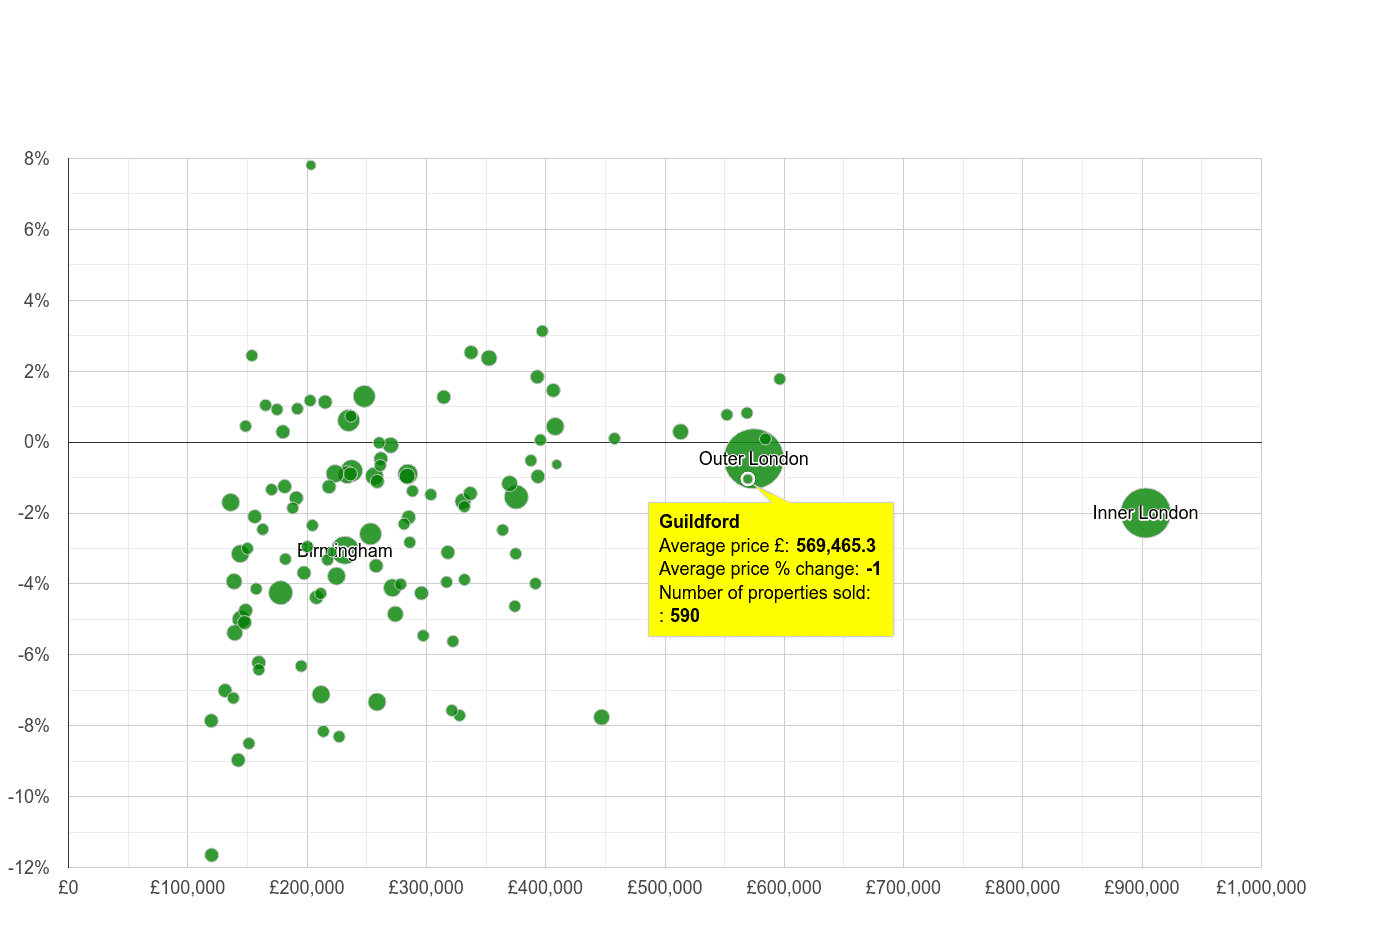
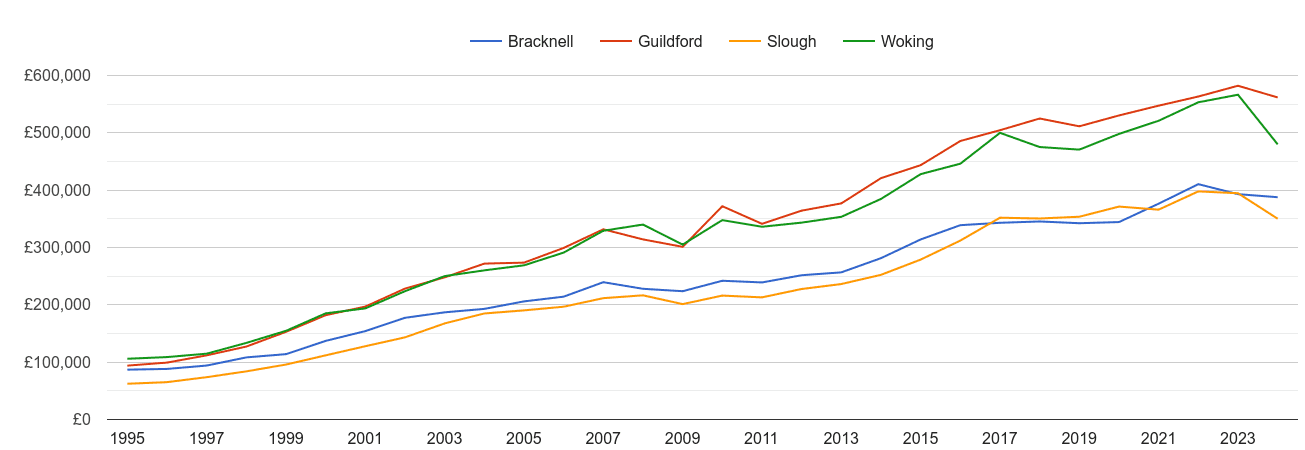
Guildford house prices compared to other cities
Comparison of the average property price and an average price percentage change by city. Price % change compares the average property price between September 2024 - August 2025 to the average price in the previous 12 months. The size of the circle shows the number of property transactions. The bigger the circle the higher the sales volumes in city.
Average price percentage changeAverage property price
Guildford house price rank
With the average price of £527k, Guildford is the 7. most pricey city out of 113 England and Wales' cities.
Price ranking
Rank
city
Average price
1.
Inner London
£803k
2.
St Albans
£675k
3.
Cambridge
£565k
4.
Outer London
£558k
5.
Oxford
£557k
6.
Bath
£538k
7.
Guildford
£527k
8.
Woking
£526k
9.
Brighton and Hove
£490k
10.
Watford
£470k
...
103.
Darlington
£154k
104.
Scunthorpe
£154k
105.
Stockton-on-Tees
£154k
106.
Middlesbrough
£153k
107.
Kingston upon Hull
£153k
108.
Sunderland
£153k
109.
Stoke-on-Trent
£149k
110.
Blackpool
£148k
111.
Hartlepool
£143k
112.
Grimsby
£141k
113.
Burnley
£141k
Plumplot area insights - interactive charts and maps
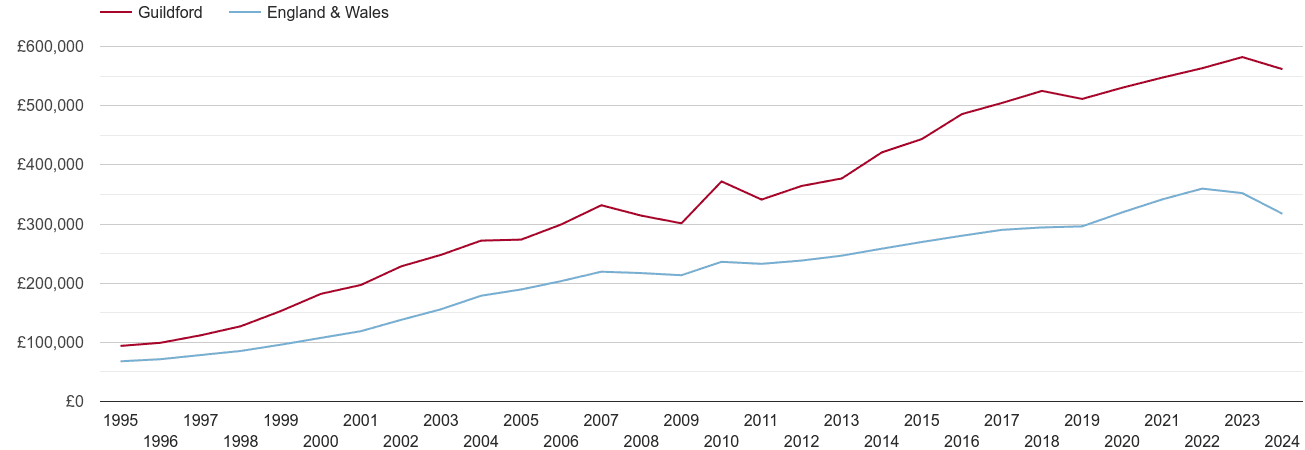
Guildford real house prices
Yearly average nominal house prices adjusted for inflation.
Real average price - nominal price adjusted for inflation
Year
Guildford city
England & Wales
2025
£546k
£347k
2024
£588k
£370k
2023
£648k
£407k
2022
£714k
£458k
2021
£722k
£451k
2020
£712k
£428k
2019
£700k
£406k
2018
£746k
£418k
2017
£742k
£427k
2016
£729k
£420k
2015
£670k
£407k
2014
£654k
£400k
2013
£603k
£394k
2012
£601k
£393k
2011
£590k
£403k
2010
£673k
£427k
2009
£542k
£384k
2008
£591k
£408k
2007
£650k
£430k
2006
£605k
£411k
2005
£566k
£392k
2004
£582k
£383k
2003
£545k
£343k
2002
£512k
£309k
2001
£449k
£271k
2000
£428k
£253k
1999
£364k
£229k
1998
£313k
£210k
1997
£284k
£199k
1996
£258k
£186k
1995
£253k
£183k
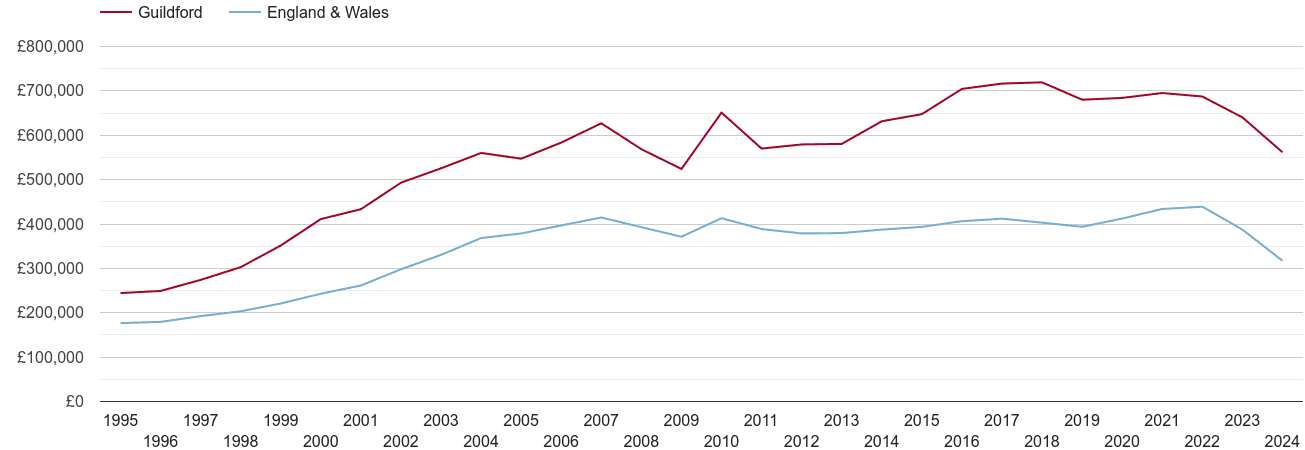
Guildford house prices
Yearly average nominal prices compared to England & Wales' house prices
Nominal average price
Year
Guildford city
England & Wales
2025
£546k
£347k
2024
£566k
£356k
2023
£569k
£357k
2022
£562k
£361k
2021
£547k
£342k
2020
£531k
£320k
2019
£511k
£296k
2018
£525k
£294k
2017
£505k
£290k
2016
£486k
£280k
2015
£444k
£270k
2014
£422k
£258k
2013
£377k
£247k
2012
£364k
£238k
2011
£341k
£233k
2010
£372k
£236k
2009
£301k
£213k
2008
£314k
£217k
2007
£332k
£219k
2006
£299k
£204k
2005
£274k
£189k
2004
£272k
£179k
2003
£248k
£156k
2002
£228k
£138k
2001
£197k
£119k
2000
£182k
£108k
1999
£153k
£96.0k
1998
£127k
£85.4k
1997
£112k
£78.5k
1996
£99.2k
£71.5k
1995
£94.0k
£67.9k
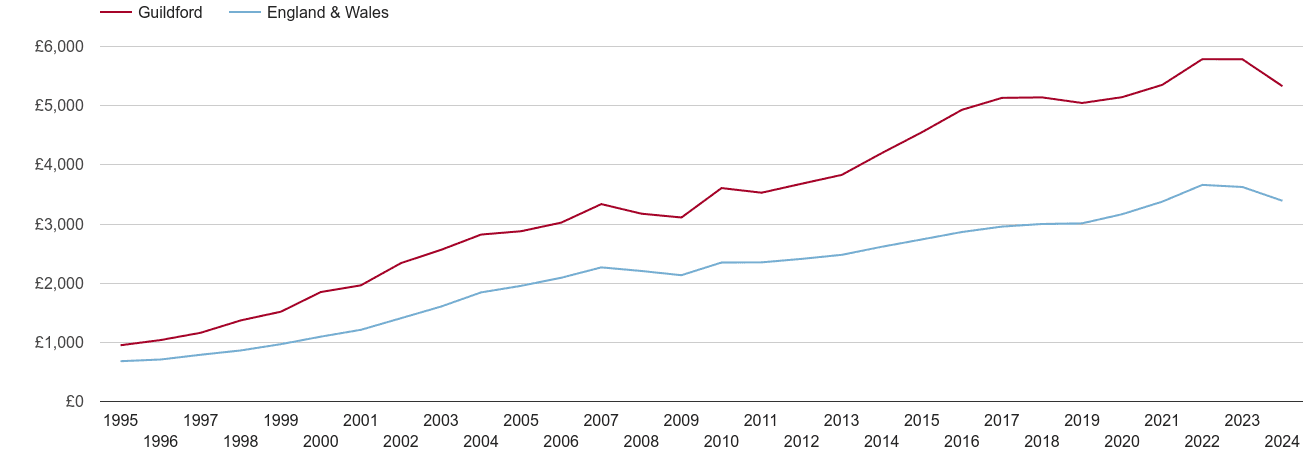
Guildford house prices per square metre
Yearly average nominal price per square metre compared to England & Wales' house prices