Annual crime rate in Buckinghamshire county is 24.3, i.e. 24.3 crimes committed per annum per 1000 workday people. Compared to the national crime rate, Buckinghamshire's crime rate is at 76%. Violent crime makes up 29.5% of all crimes committed in the county. The total number of "violent crime" is 17.8k, and this number has increased by 13.5% when compared year-over-year in the period of November 2018 - October 2019.
24.3
annual crime rate per 1k workday people
76%
of national crime rate
29.5%
of all crimes
17.8k
crimes committed
13.5%
annual change
Buckinghamshire violent crime rate comparison map
November 2018 - October 2019
Postcode sector
Crime rate vs. ENG & WLS rate
Crime rate per 1000 workday people
Total number of crimes
HP10 0
41%
13
77
HP10 8
20%
6
27
HP10 9
43%
14
109
HP11 1
66%
21
214
HP11 2
108%
34
433
HP12 3
78%
25
282
HP12 4
57%
18
240
HP13 5
96%
31
324
HP13 6
105%
33
355
HP13 7
127%
40
449
HP14 3
53%
17
136
HP14 4
24%
8
61
HP15 6
43%
14
88
HP15 7
61%
19
128
HP16 0
43%
14
84
HP16 9
46%
15
56
HP17 0
51%
16
13
HP17 8
36%
11
88
HP17 9
49%
16
4
HP18 0
53%
17
115
HP18 9
20%
6
45
HP19 0
90%
29
37
HP19 7
58%
18
75
HP19 8
69%
22
168
HP19 9
138%
44
357
HP20 1
136%
43
400
HP20 2
158%
50
391
HP21 7
54%
17
175
HP21 8
144%
46
427
HP21 9
82%
26
262
HP22 4
42%
13
62
HP22 5
49%
16
193
HP22 6
45%
14
82
HP27 0
43%
14
75
HP27 9
33%
11
59
HP5 1
70%
22
165
HP5 2
92%
29
256
HP5 3
73%
23
133
HP6 5
31%
10
61
HP6 6
45%
14
97
HP7 0
35%
11
62
HP7 9
57%
18
119
HP8 4
39%
12
75
HP9 1
59%
19
177
HP9 2
52%
17
130
LU7 0
58%
18
126
MK1 1
163%
52
125
MK10 7
202%
64
90
MK10 9
58%
18
248
MK11 1
85%
27
140
MK11 2
158%
50
61
MK11 3
56%
18
15
MK12 5
117%
37
337
MK12 6
110%
35
172
MK13 0
145%
46
138
MK13 7
160%
51
262
MK13 8
113%
36
108
MK13 9
62%
20
44
MK14 5
113%
36
219
MK14 6
82%
26
220
MK14 7
189%
60
226
MK15 0
118%
37
34
MK15 8
25%
8
41
MK15 9
57%
18
59
MK16 0
78%
25
110
MK16 8
76%
24
141
MK16 9
45%
14
65
MK17 0
44%
14
70
MK17 8
31%
10
70
MK18 1
58%
19
181
MK18 2
50%
16
61
MK18 3
48%
15
72
MK18 4
54%
17
53
MK18 5
42%
13
35
MK18 7
39%
12
27
MK19 7
47%
15
73
MK2 2
98%
31
394
MK2 3
186%
59
386
MK3 5
84%
27
127
MK3 6
99%
31
171
MK3 7
107%
34
250
MK4 1
139%
44
153
MK4 2
114%
36
102
MK4 3
56%
18
51
MK4 4
154%
49
254
MK46 4
49%
15
50
MK46 5
38%
12
52
MK5 6
84%
27
179
MK5 7
97%
31
138
MK5 8
39%
12
59
MK6 2
162%
52
419
MK6 3
155%
49
202
MK6 4
121%
39
331
MK6 5
237%
75
531
MK7 6
38%
12
50
MK7 7
85%
27
213
MK7 8
42%
13
85
MK8 0
109%
35
130
MK8 8
34%
11
52
MK8 9
68%
22
43
MK9 1
120%
38
135
MK9 2
40%
13
158
MK9 3
104%
33
421
MK9 4
162%
52
23
OX27 0
14%
4
5
RG9 6
20%
6
16
SL0 0
55%
18
105
SL0 9
73%
23
116
SL1 7
105%
33
136
SL1 8
88%
28
93
SL2 3
55%
17
107
SL2 4
64%
20
144
SL3 6
61%
19
81
SL4 6
56%
18
86
SL6 0
61%
19
86
SL7 2
34%
11
60
SL7 3
45%
14
98
SL8 5
34%
11
69
SL9 0
47%
15
67
SL9 7
43%
14
61
SL9 8
31%
10
55
SL9 9
51%
16
86
UB9 4
64%
20
68
UB9 5
46%
15
81
Buckinghamshire violent crime rate rank
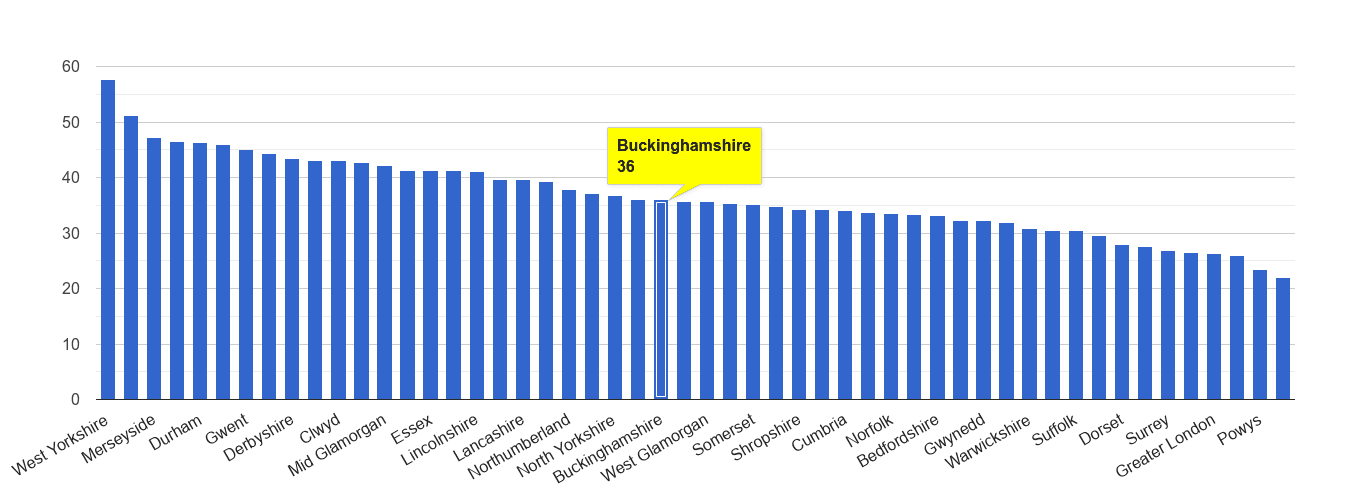
Violent crime rate is 24.3 crimes committed per 1,000 working people per annum. It's the 8. lowest crime rate out of 55 England and Wales' counties.
8.
lowest crime rate out of 55 counties
24.3
annual crime rate per 1k workday people
Buckinghamshire violent crime rate compared to other counties
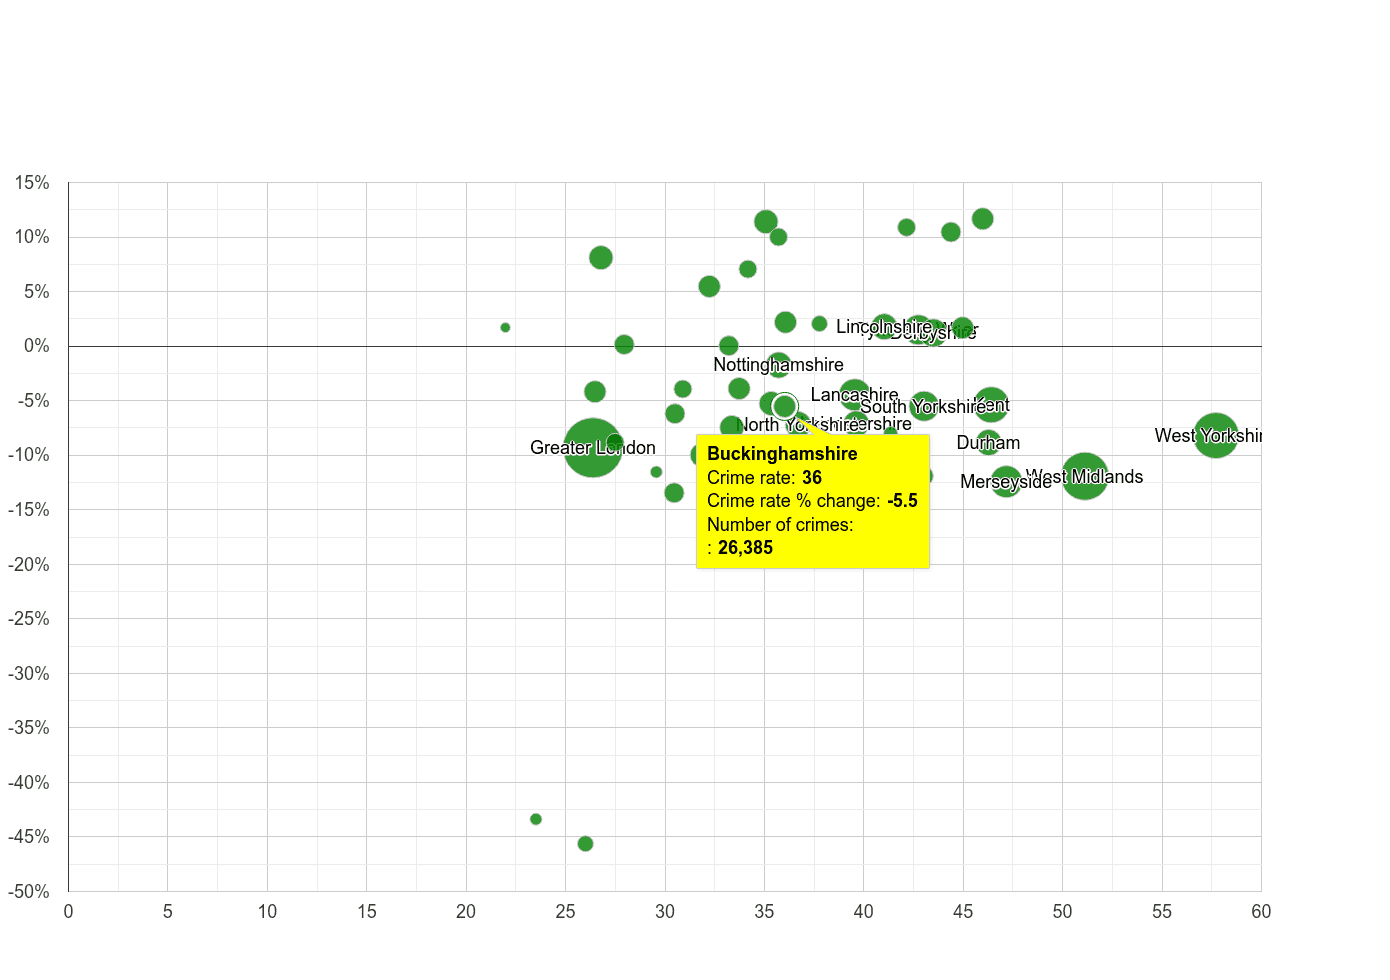
The total number of "violent crime" is 17.8k, and this number has increased by 13.5% when compared year-over-year in the period of November 2018 - October 2019. In the graph below, county are compared by crime rate and crime rate percentage change. Crime rate percentage change compares the county crime rate between November 2018 - October 2019 to the county crime rate in the previous 12 months. The size of the circle reflects the number of total crimes committed. The bigger the circle, the higher the number of crimes committed in the county.
13.5%
annual change
24.3
annual crime rate per 1k workday people
17.8k
crimes committed
Crime rate percentage changeCrime rate per 1000 workday people
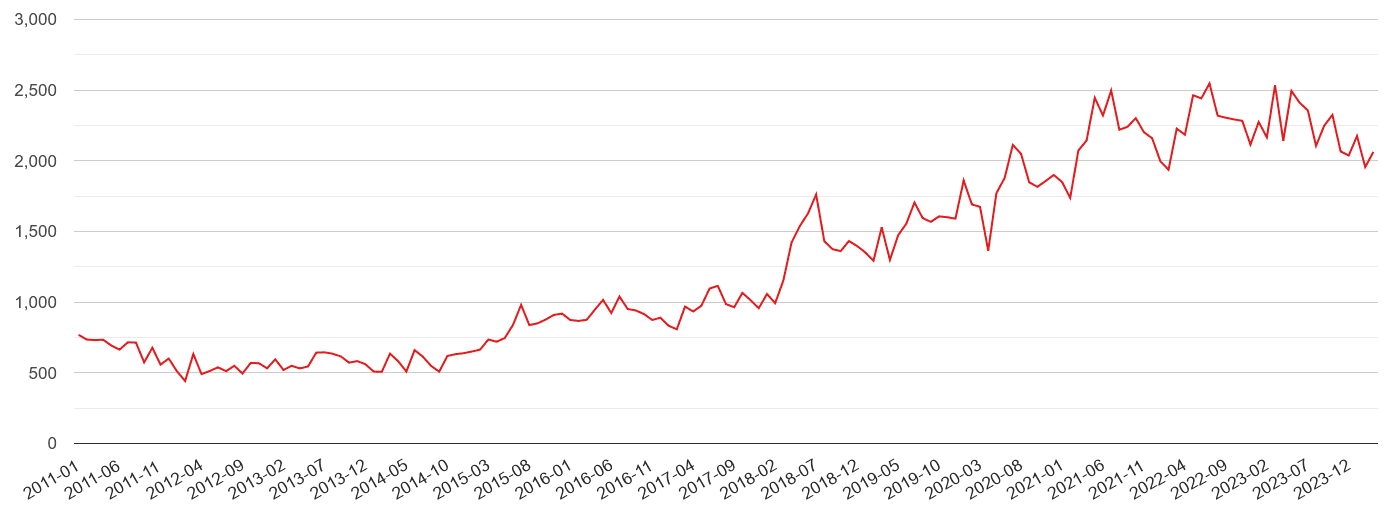
Buckinghamshire violent crime rate
Annual crime rate per 1000 workday people
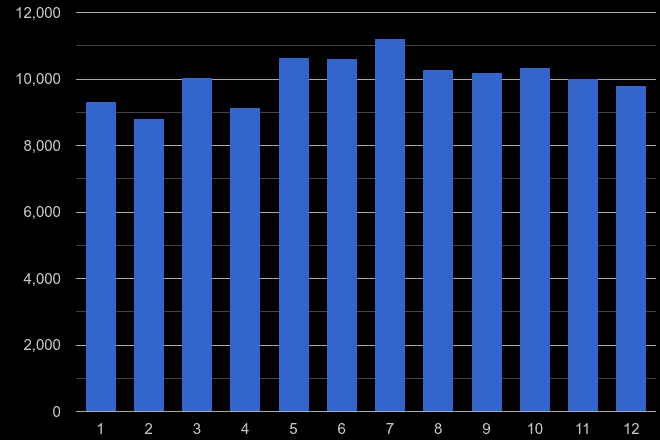
Buckinghamshire violent crime seasonality
Total number of crimes committed in a given calendar month (1 = January … 12 = December) in the previous five years.