Annual crime rate in Bradford postcode area is 55, i.e. 55 crimes committed per annum per 1000 workday people. Compared to the national crime rate, Bradford's crime rate is at 173%. Violent crime makes up 35.7% of all crimes committed in the postcode area. The total number of "violent crime" is 31.5k, and this number has increased by 9.8% when compared year-over-year in the period of November 2018 - October 2019.
55
annual crime rate per 1k workday people
173%
of national crime rate
35.7%
of all crimes
31.5k
crimes committed
9.8%
annual change
Bradford violent crime rate comparison map
November 2018 - October 2019
Postcode sector
Crime rate vs. ENG & WLS rate
Crime rate per 1000 workday people
Total number of crimes
BD1 1
198%
63
386
BD1 2
349%
111
535
BD1 3
283%
90
351
BD1 4
110%
35
159
BD1 5
105%
34
137
BD10 0
232%
74
542
BD10 8
141%
45
351
BD10 9
258%
82
456
BD11 1
146%
46
196
BD11 2
99%
31
139
BD12 0
111%
35
221
BD12 7
64%
20
60
BD12 8
338%
108
415
BD12 9
182%
58
219
BD13 1
156%
50
135
BD13 2
149%
47
258
BD13 3
178%
57
291
BD13 4
179%
57
148
BD13 5
123%
39
90
BD14 6
218%
69
426
BD15 0
75%
24
76
BD15 7
308%
98
619
BD15 8
89%
28
8
BD15 9
146%
47
82
BD16 1
95%
30
242
BD16 2
155%
49
238
BD16 3
55%
17
66
BD16 4
142%
45
232
BD17 5
170%
54
285
BD17 6
85%
27
130
BD17 7
139%
44
250
BD18 1
152%
48
232
BD18 2
376%
120
677
BD18 3
147%
47
396
BD18 4
107%
34
201
BD19 3
211%
67
387
BD19 4
103%
33
241
BD19 5
132%
42
122
BD19 6
176%
56
205
BD2 1
180%
57
348
BD2 2
186%
59
203
BD2 3
226%
72
463
BD2 4
230%
73
457
BD20 0
91%
29
128
BD20 5
97%
31
155
BD20 6
109%
35
357
BD20 7
69%
22
95
BD20 8
36%
11
53
BD20 9
47%
15
58
BD21 1
210%
67
402
BD21 2
214%
68
469
BD21 3
192%
61
410
BD21 4
146%
46
390
BD21 5
249%
79
316
BD22 0
80%
25
76
BD22 6
244%
78
434
BD22 7
200%
64
353
BD22 8
131%
42
137
BD22 9
107%
34
106
BD23 1
52%
17
131
BD23 2
79%
25
231
BD23 3
28%
9
46
BD23 4
49%
16
44
BD23 5
28%
9
30
BD23 6
25%
8
28
BD24 0
53%
17
34
BD24 9
38%
12
41
BD3 0
286%
91
759
BD3 7
141%
45
543
BD3 8
207%
66
606
BD3 9
127%
40
365
BD4 0
297%
95
606
BD4 6
186%
59
502
BD4 7
143%
46
468
BD4 8
211%
67
575
BD4 9
249%
79
559
BD5 0
259%
83
702
BD5 7
179%
57
414
BD5 8
164%
52
525
BD5 9
250%
80
706
BD6 1
219%
70
519
BD6 2
290%
92
621
BD6 3
231%
74
691
BD7 1
133%
42
483
BD7 2
201%
64
719
BD7 3
236%
75
556
BD7 4
201%
64
454
BD8 0
235%
75
541
BD8 7
217%
69
672
BD8 8
146%
46
363
BD8 9
125%
40
557
BD9 4
229%
73
579
BD9 5
157%
50
489
BD9 6
242%
77
756
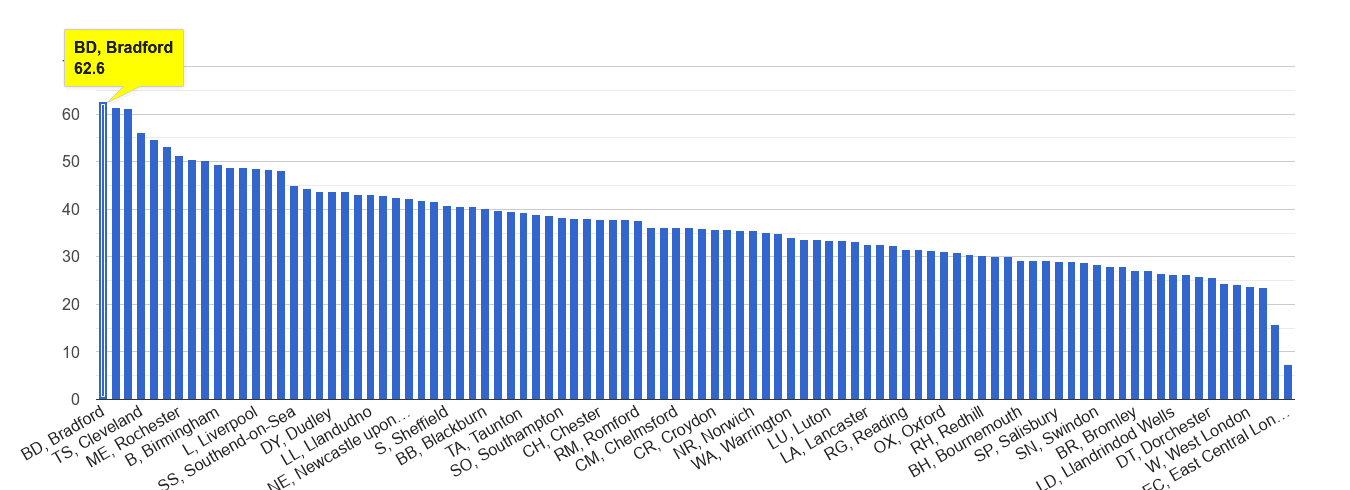
Bradford violent crime rate rank
Violent crime rate is 55 crimes committed per 1,000 working people per annum. It's the 1. highest crime rate out of 104 England and Wales' postcode areas.
1.
highest crime rate out of 104 postcode areas
55
annual crime rate per 1k workday people
Bradford violent crime rate compared to other areas
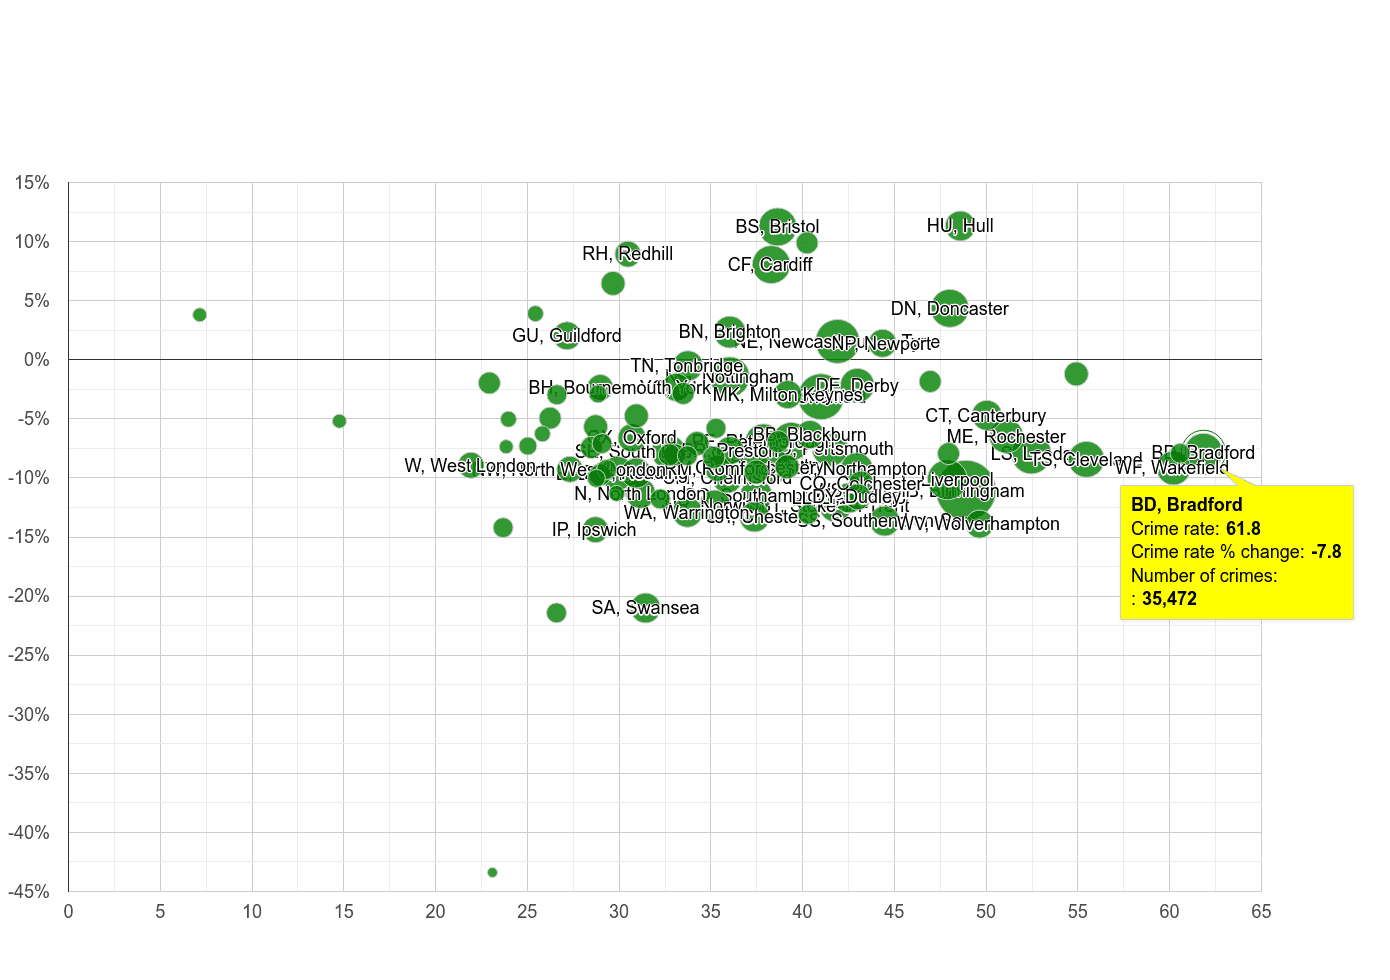
The total number of "violent crime" is 31.5k, and this number has increased by 9.8% when compared year-over-year in the period of November 2018 - October 2019. In the graph below, postcode area are compared by crime rate and crime rate percentage change. Crime rate percentage change compares the postcode area crime rate between November 2018 - October 2019 to the postcode area crime rate in the previous 12 months. The size of the circle reflects the number of total crimes committed. The bigger the circle, the higher the number of crimes committed in the postcode area.
9.8%
annual change
55
annual crime rate per 1k workday people
31.5k
crimes committed
Crime rate percentage changeCrime rate per 1000 workday people
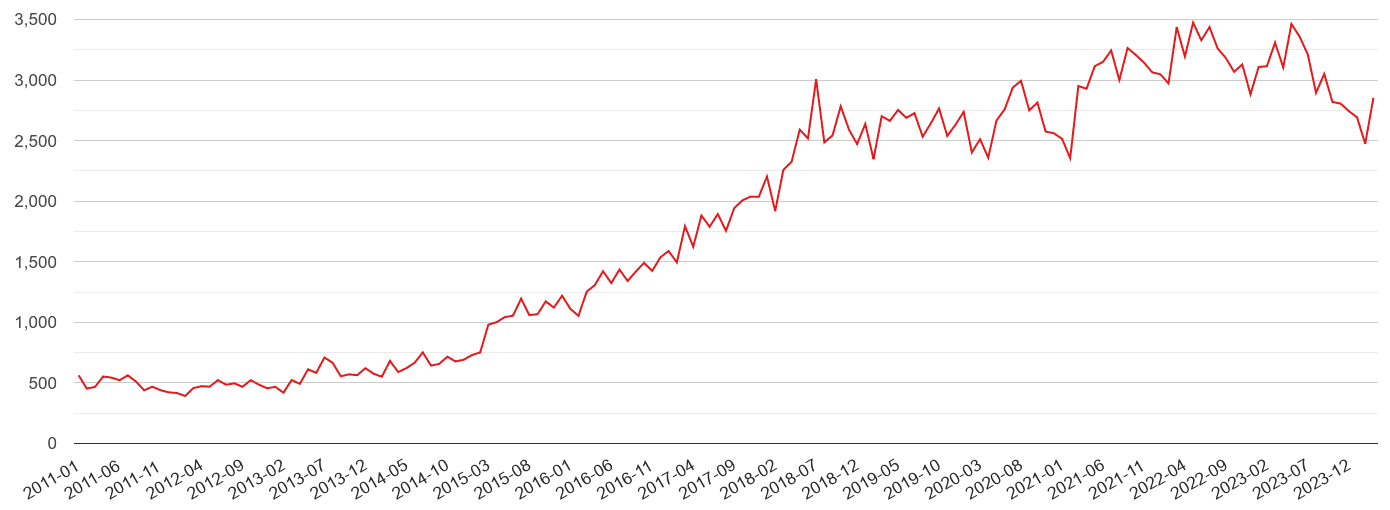
Bradford violent crime rate
Annual crime rate per 1000 workday people
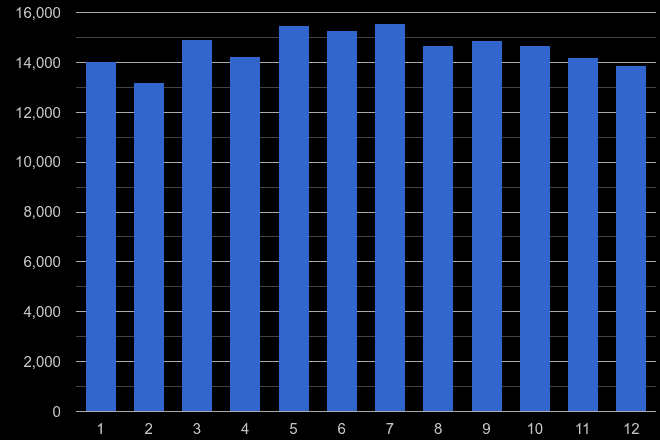
Bradford violent crime seasonality
Total number of crimes committed in a given calendar month (1 = January … 12 = December) in the previous five years.